
Financials are Overbought

Nothing gets my blood boiling more when it comes to market commentary than the following statement.
"The market is overbought"
In my opinion, that single phrase might constitute one of the most misrepresented terms in technical analysis because there are good overbought conditions and bad overbought conditions. It's essential to understand the difference.
A good overbought condition represents market momentum with bullish implications for intermediate and long-term trends; a bad overbought condition typically occurs at the end of a multi-year uptrend when sentiment is complacent and investors are all-in. January 2018 is a good example.
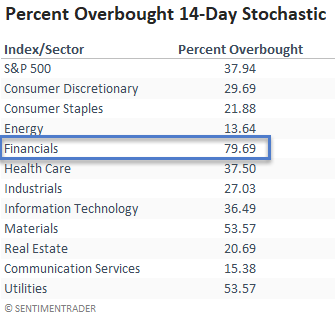
The percentage of S&P 500 financial members with a 14-day stochastic level of 80% or more has surged to 79.69%. The stochastic indicator measures momentum by comparing the current closing price to the high and low range of prices over a lookback period. The standard setting is 14 days and the indicator ranges from 0% lowest to 100% highest.
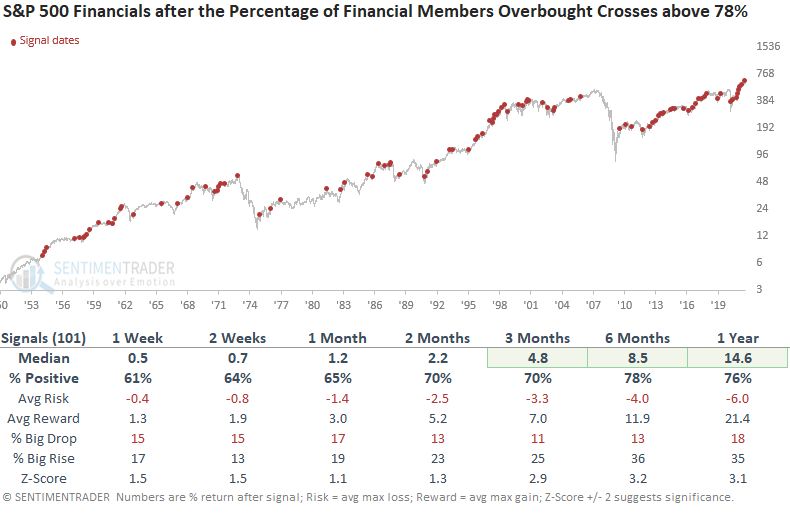
Let's conduct a study to assess the forward return outlook for the S&P 500 financials sector when the percentage of members with a 14-day stochastic of 80% or more crosses above 78%.
Financials have the best short-term momentum as of 8/10/21.
I like to review the results by creating buckets to assess the performance under different market conditions when it comes to momentum signals. Today's note will divide the signals into the following groups.
- All Signals
- Bear Market Signals
- Correction Signals between 10% & 20%
- Correction Signals of less than 10%
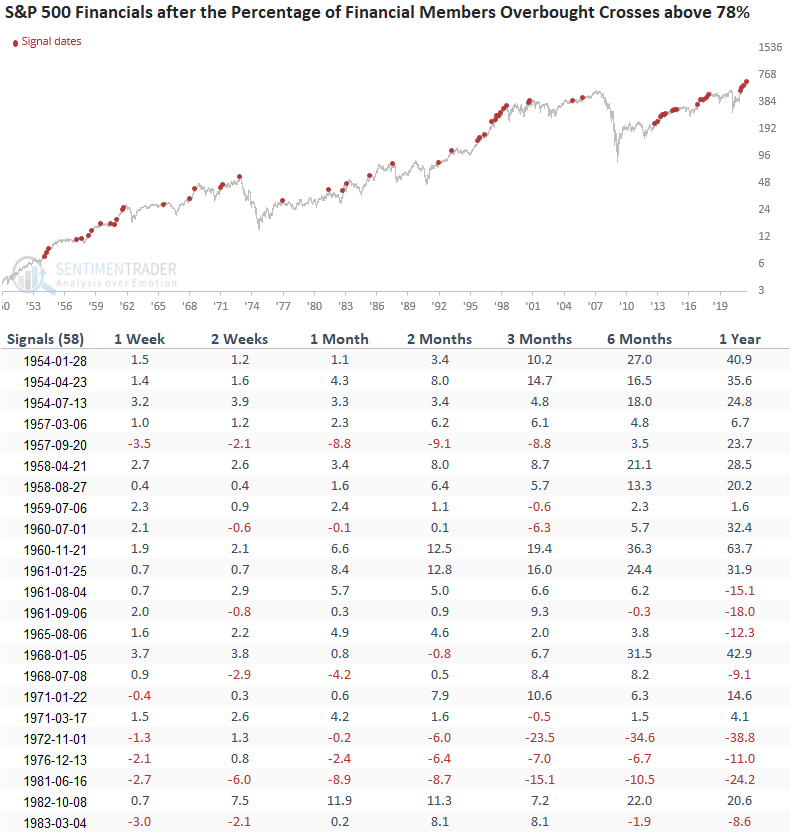
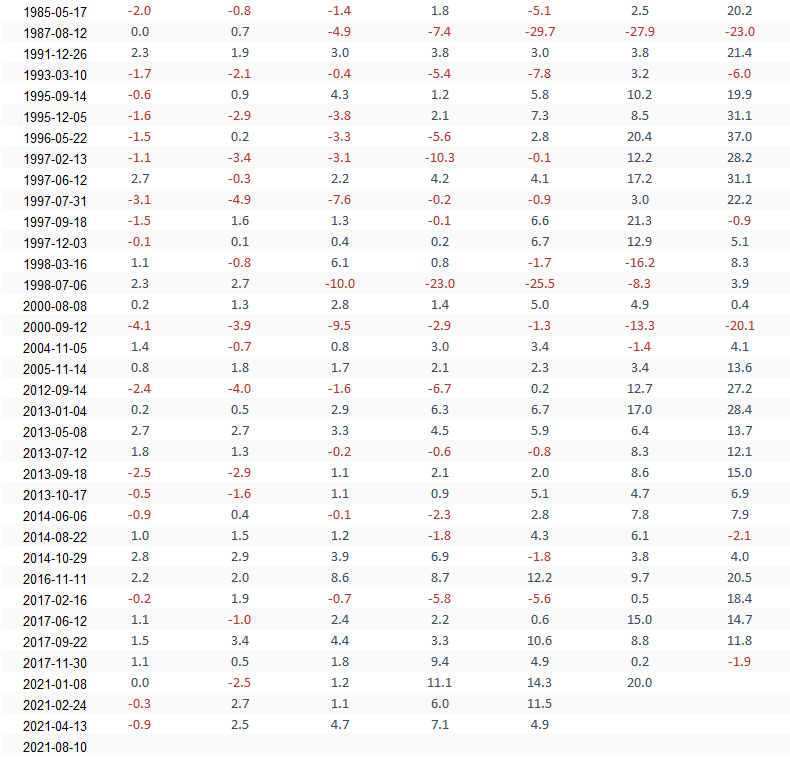
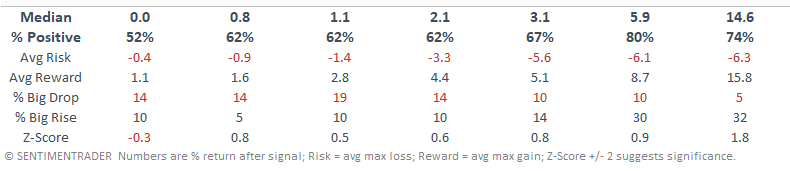
HOW THE SIGNALS PERFORMED - ALL SIGNALS
Performance looks good across all timeframes, especially the 3-12 month window.
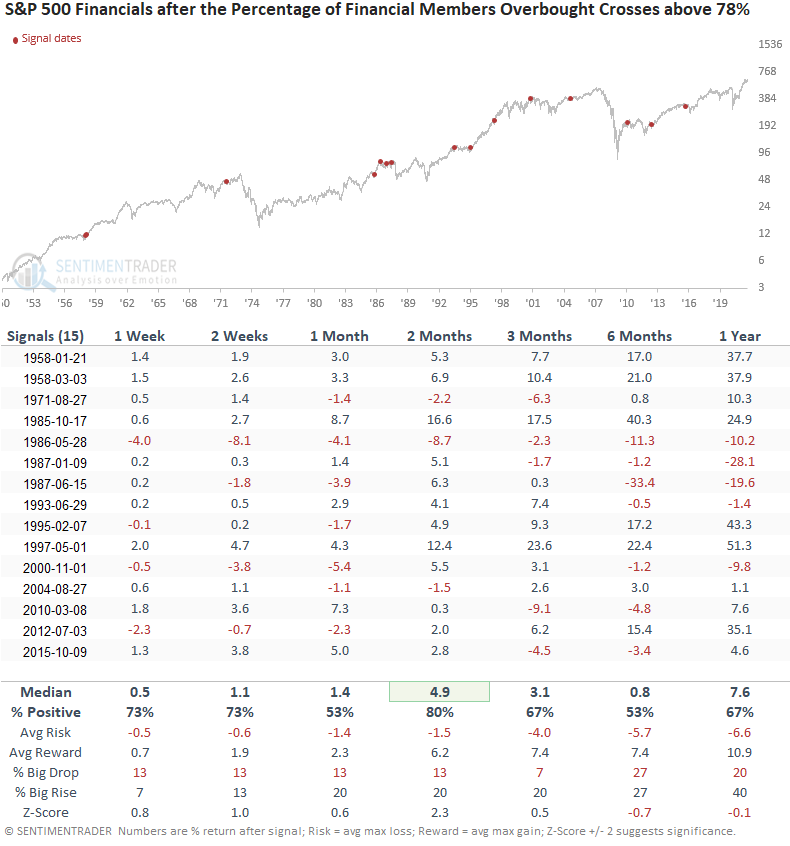
HOW THE SIGNALS PERFORMED - DOWN 20% OR MORE (BEAR MARKET)
While results look slightly weak in the short-term, the performance gets much better starting in the 2-month timeframe.
HOW THE SIGNALS PERFORMED - DOWN >= 10% BUT < 20%
Results look pretty good in the first couple of months and then dwindle after the 3-month window.
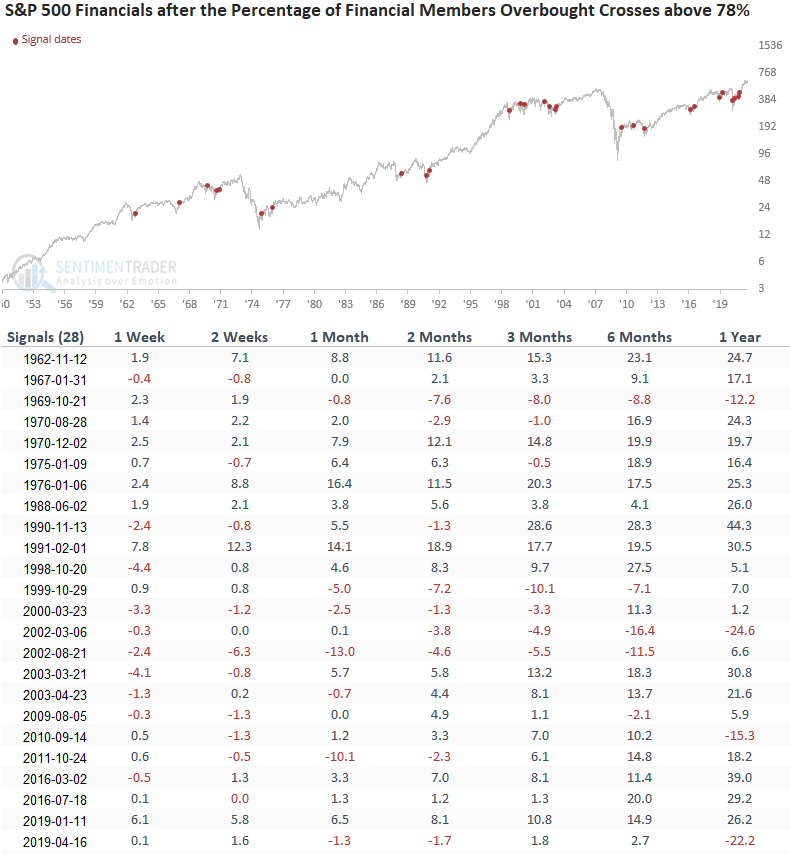
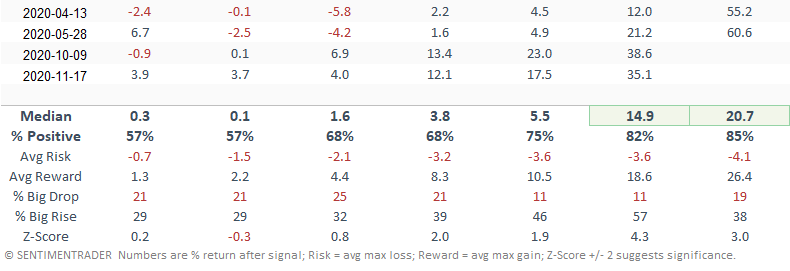
HOW THE SIGNALS PERFORMED - DOWN < 10%
Results look pretty good across all timeframes with several good risk/reward profiles.

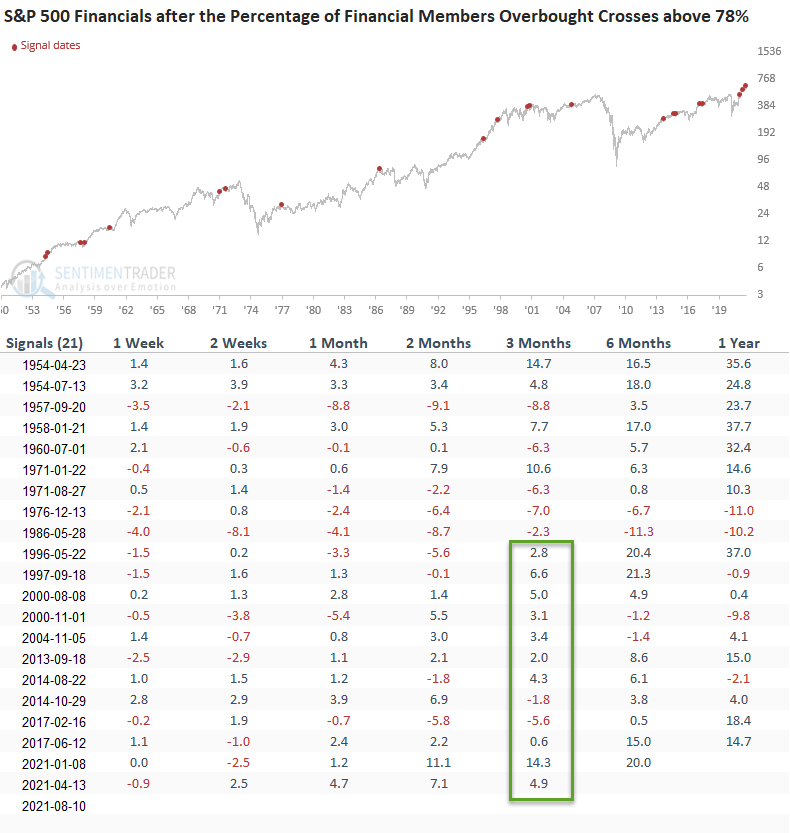
Let's narrow the study down further by looking for instances when the percentage crosses above 78% and the sector is down less than 5%, but not at a new high. I will also include that the financials have not made a new high in the last 42 days. The new requirements should help to isolate signals with a similar context to the current instance.
HOW THE SIGNALS PERFORMED
Results look pretty consistent across all timeframes. The risk/reward profile is not as strong, but I'm not surprised given the new requirements as the signal carries less momentum. i.e., a signal coming out of a bear market typically has more upward force than an instance from a shallow correction.
Remember, when you hear the phrase "the market is overbought," be mindful that an overbought condition can be good as momentum is a powerful force.