
Financials As A Sick Canary

Financial correction
Less than three weeks ago, financial stocks within the S&P 500 were within spitting distance of a fresh 52-week high. Now they’re mired in a correction, having pulled back more than 10% from their high.
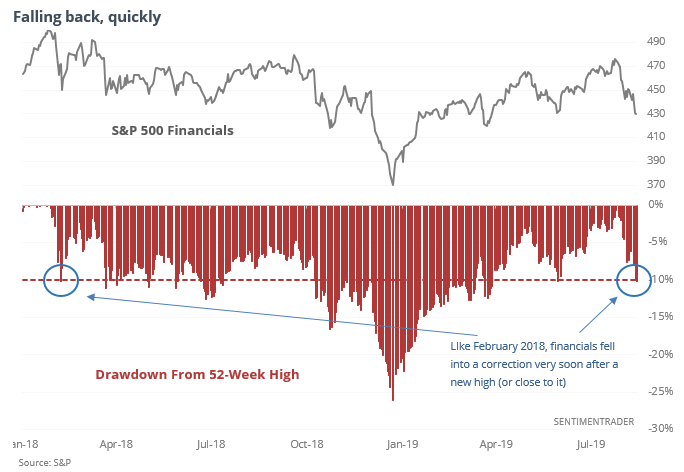
That’s a quick turnaround, which always worries investors. This was not a consistent recipe for weakness in the broader S&P index. There were only two losses over the next two months, both of which then showed a gain the next month. Most notably, the risk/reward was heavily skewed to the upside.
Extremes rising
More than a third of our indicators hit pessimistic territory by Wednesday’s close, the most in months. There was a drop in optimistic indicators as well, so the spread between them was the widest in more than six months.
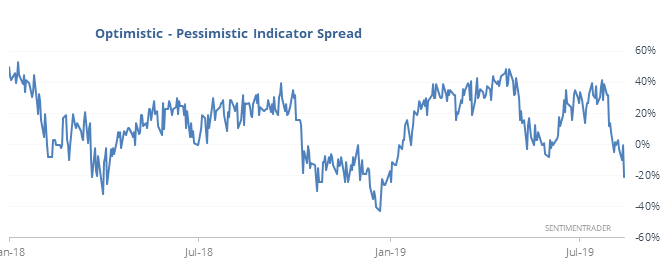
It has become quite a bit wider in the past, but by the time it gets this wide, ending a long streak with a smaller spread, future returns for stocks have been mostly positive.
Bad energy
The Heatmap shows that bond funds dominate the extreme optimism squares and energy funds populate many of the extreme pessimism ones. The 10-day Optimism Index for the oil services fund, OIH, is as low as it’s been only two other times. The Backtest Engine shows that OIH rallied more than 20% after those extremes.
Bonds again
For TLT, the 10-day Optix is the 2nd-highest in its history. The other, August 10, 2011, saw TLT drop 2.5% over the next two weeks, but then resume its rally.
This post was an abridged version of our previous day's Daily Report. For full access, sign up for a 30-day free trial now.