
Financials Relative Strength Low Count Risk-Off Model

In light of the recent deleveraging by Archegos Capital and the potential spillover effect on the banking sector, I thought it would be an excellent time to review one of the components in the Risk Warning Model. Financials are undoubtedly the most vitally important sector when it comes to identifying market risk. Anyone that says otherwise has not studied history. The TCTM Risk Warning Model contains two components that utilize time series from the financial sector. In today's note, I'm going to review the Financials Relative Strength Low Count Model.
Components
- S&P 500 Financials Cap-Weighted Sector
- S&P 500 Financials Equal-Weighted Sector
- S&P 500 Index
Financials Relative Strength Low Count Model
The financials relative strength low count model seeks to identify instances in history when financials severely underperform the broad market. The model will issue an alert based upon the following conditions.
Signal Criteria
Condition1 = 252-Day Relative Low Count for Cap or Equal Financials vs. S&P 500 >= 10. i.e., financials are making relative lows
Condition2 = 252-Day Relative Low Count for Cap or Equal Financials vs. S&P 500 > Count 10 Days Ago. i.e., a rising count
Condition3 = S&P 500 Index <= 3.5% from 252-Day High
Condition4 = S&P 500 Cap or Equal Financials >= 5.0% from 252-Day High
If Condition 1-4 = true, reduce market exposure.
Notes: The model will only issue one signal in an environment where the cap and equal-weighted sectors are underperforming. If you've had the chance to read some of my risk-off model notes, you will know that I like to use a momentum trigger as the final condition. However, because this model is part of a composite, I don't use one.
Let's take a look at some charts and the historical signal performance.
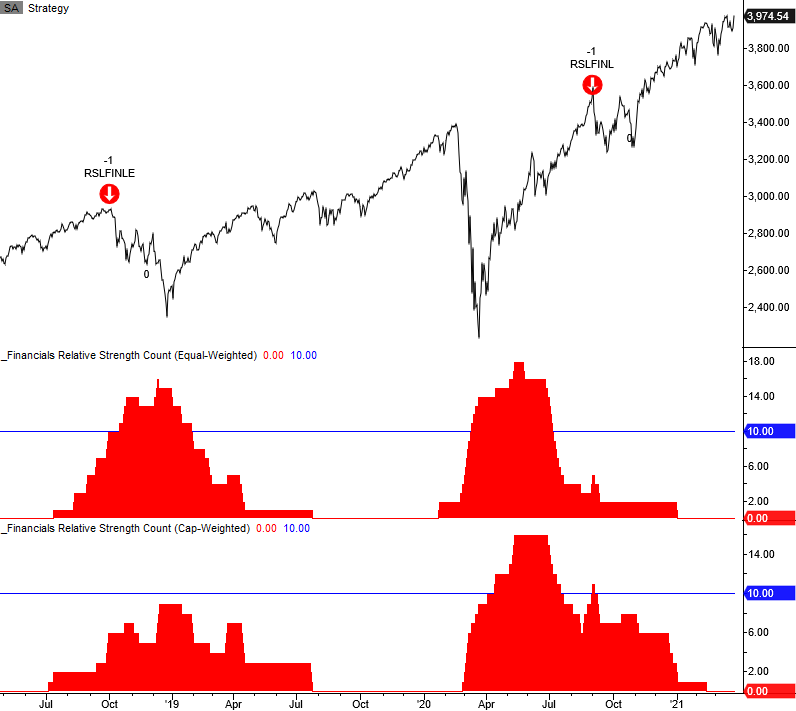
Current Day Chart Example
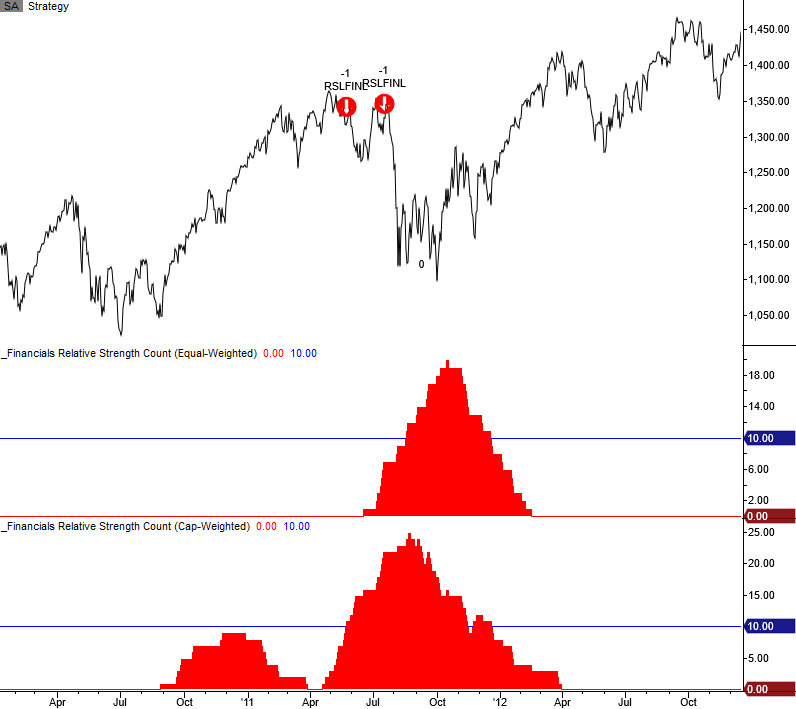
2011 Eurozone Debt Crisis
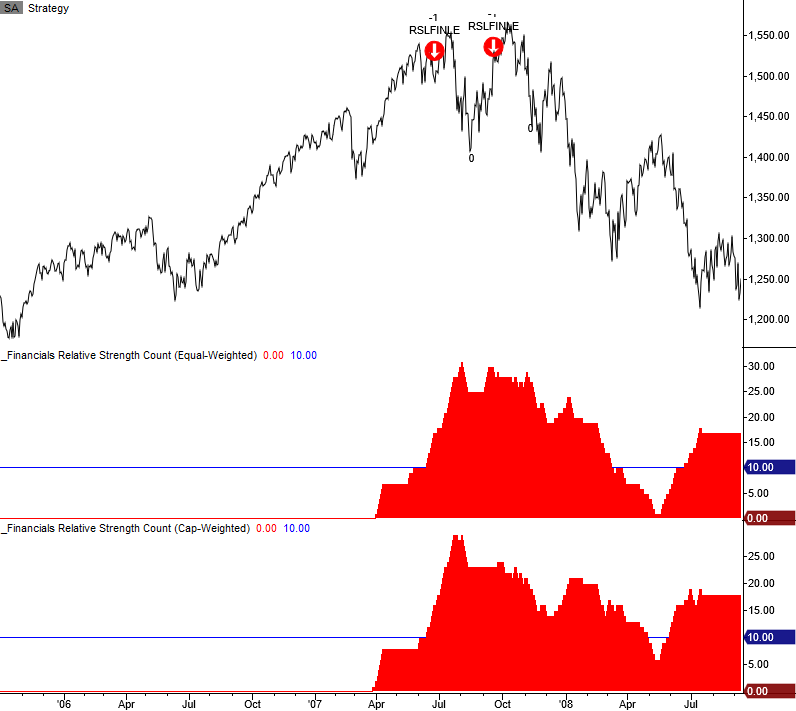
2007 Financial Crisis
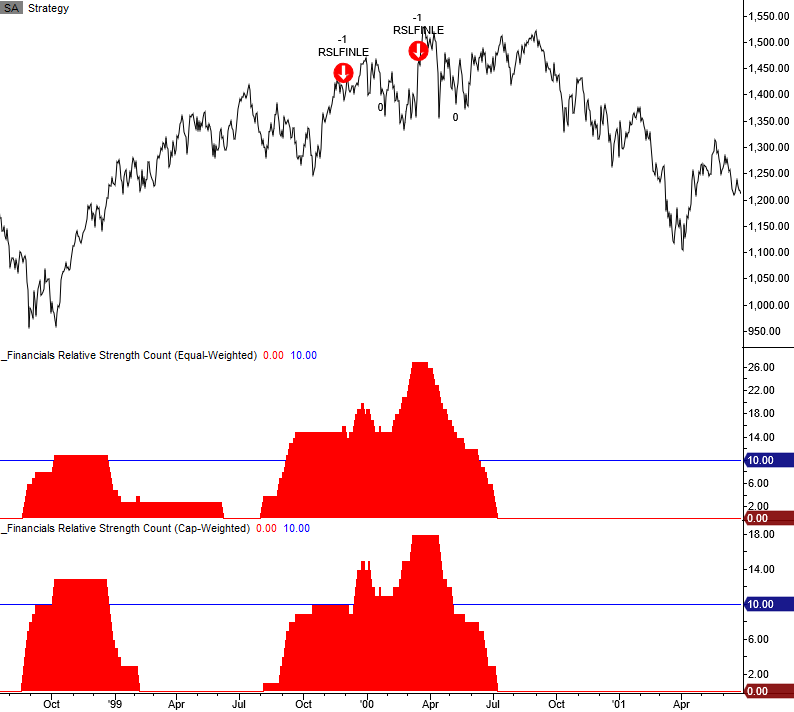
2000 Internet Bubble
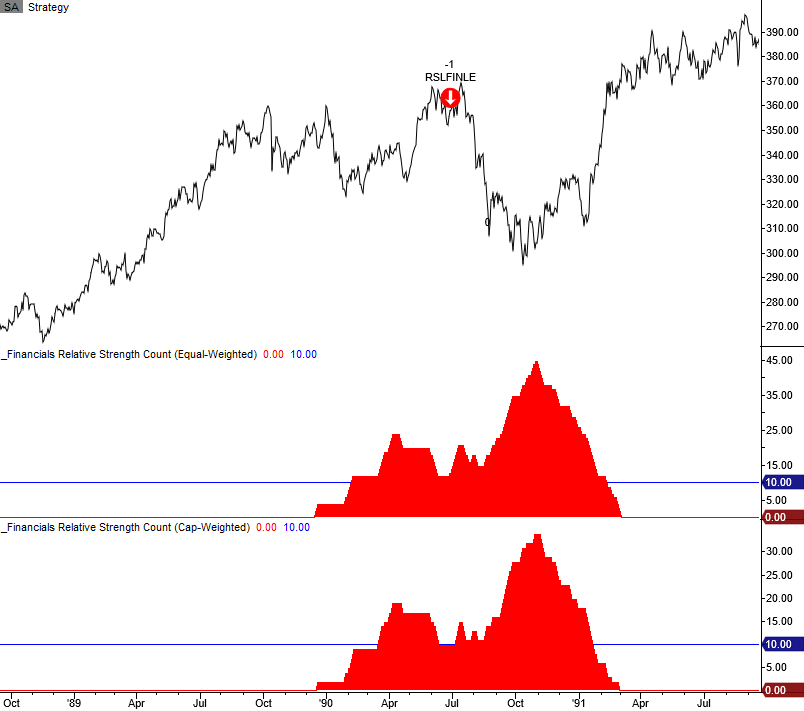
1990 Savings & Loan Crisis
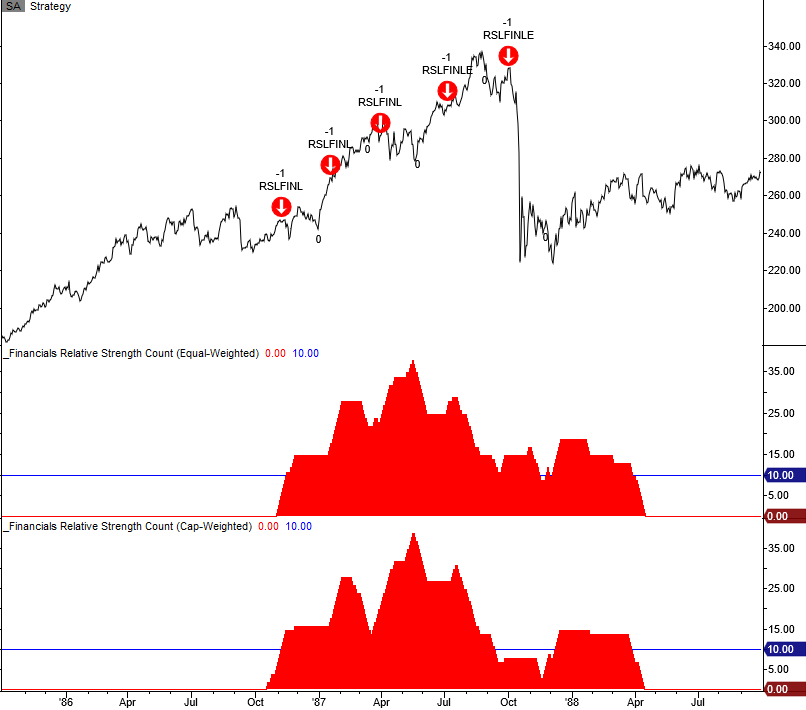
1987 Market Crash
The 1987 period is an excellent example of why I never rely on one model. I prefer a weight-of-the-evidence approach.
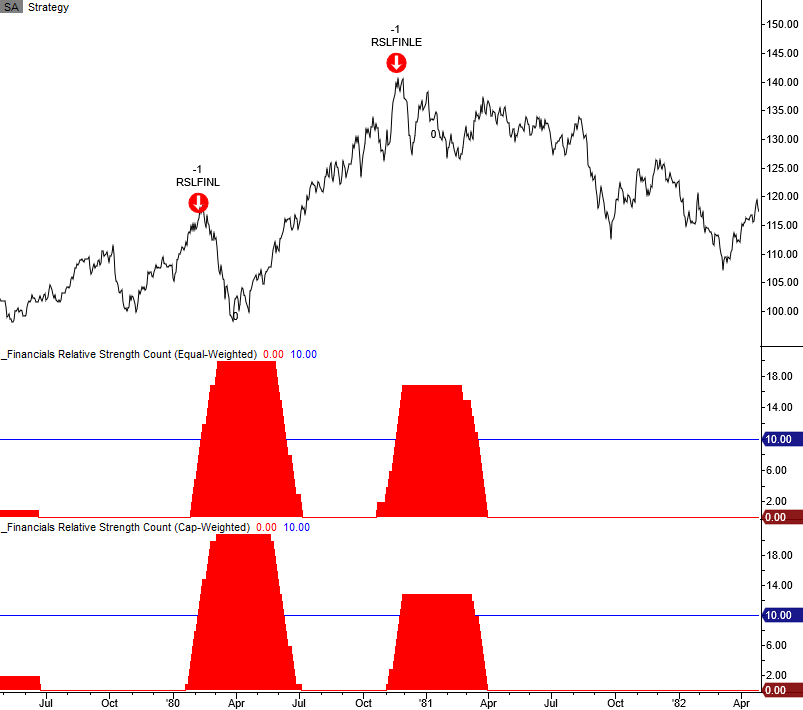
1980 Energy/Commodity Bubble
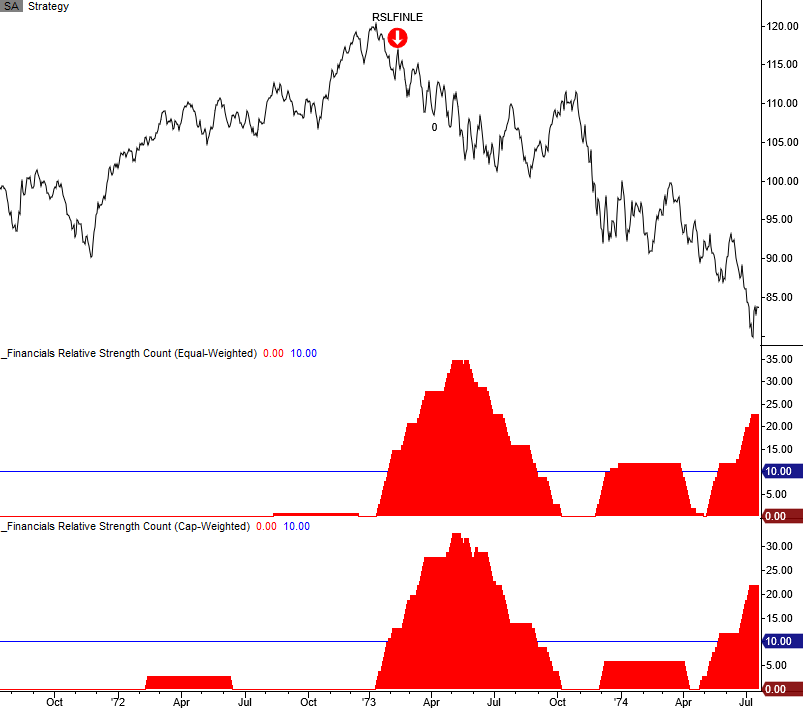
Bretton Woods/Nixon Shock/1973 Oil Crisis
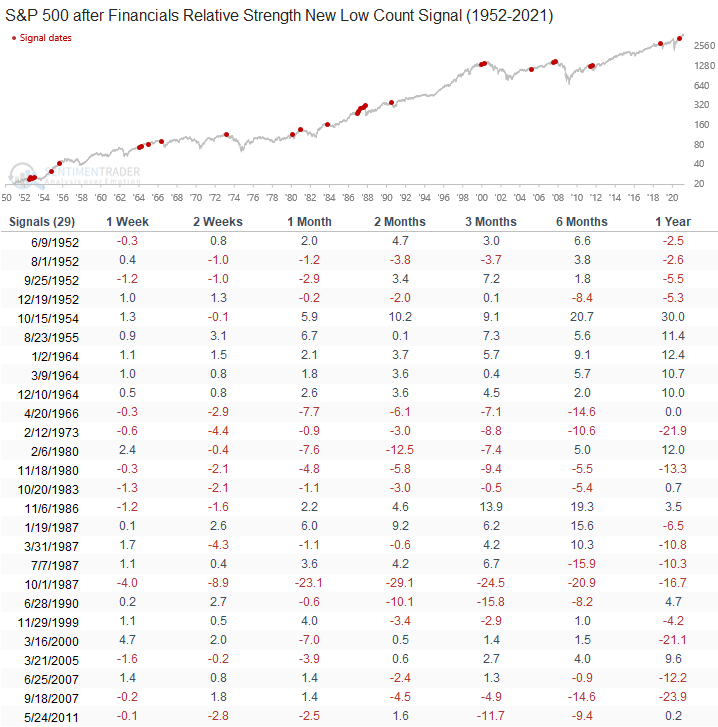
Signal Performance
As one can see, performance is weak across all timeframes with a notable z-score in the one-year forward period.
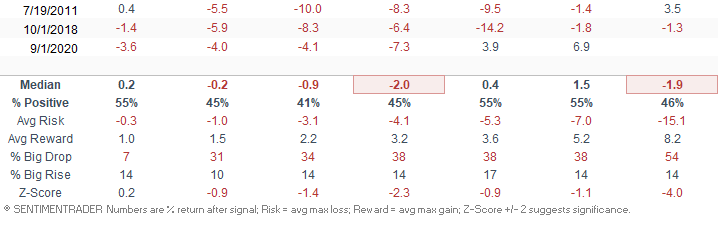
Financials Relative Low Count Correction and Bear Market Table
As shown in the table below, the financials relative low count model has issued a warning signal in 60% of the bear market periods since 1955.
Conclusion: While credit default swaps for several banks are on the rise due to potential knockoff effects from Archegos Capital, we have not seen a broader spillover effect in the financial group as measured by the RS Low Count Model. With the count at zero, the potential for a warning from the financials model remains low.