Products
SentimenTrader Trading Tools
‍
Backtest Engine
My Trading Toolkit
Correlation Analysis
Seasonality
Market Prediction
Indicators & Data API
‍
Proprietary Indicators & Charts
Market Data API
Strategies & Scanner
‍
50+ Trading Strategies
Smart Stock Scanner
Smart Option Scanner
Research Reports
‍
Research Solutions
Reports Library
Free Resources
Simple Backtest Calculator
Simple Seasonality Calculator
The Kelly Criterion Calculator
Sentiment Geo Map
Public Research Reports
Education
Sentiment Indicators
Technical Indicators
Pricing
Company
About
In the News
Testimonials
Client Success Stories
Contact
Log inLoginSign up
< BACK TO ALL REPORTS

For the 1st time in 2 years, bears reign

Jason Goepfert
2022-03-03
For the first time in almost 2 years, the Investor's Intelligence survey of newsletter writers showed more bears than bulls, ending the 6th-longest streak in its history. The ends of other long streaks of optimism tended to precede a multi-month bounce in stocks.

Key points:

  • The I.I. survey of newsletter writers showed more bears than bulls
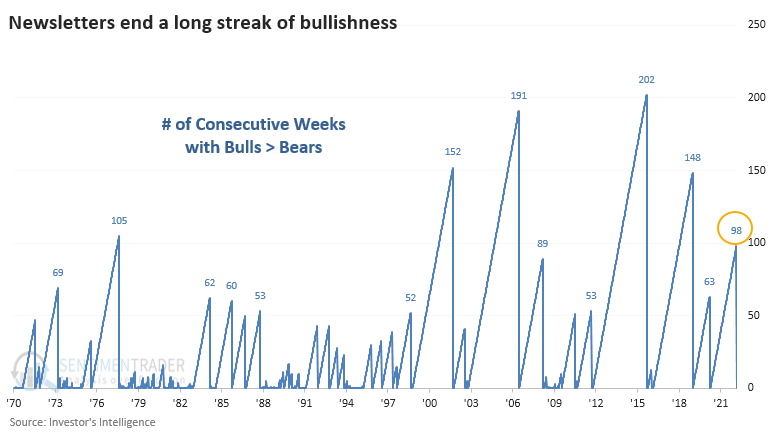
  • This ended a streak of nearly 2 years of optimism, the 6th-longest streak in 53 years
  • The ends of other long streaks mostly preceded gains for stock indexes and sectors

Survey of newsletters shows more bears than bulls, 1st time in almost 2 years

Investors aren't panicking, but they sure aren't very bullish, either. On an average day over the past week, nearly 30% of our core indicators have recorded a pessimistic extreme. That's the most since April 2020, but at most significant lows over the past decade, nearly 50% of indicators hit a pessimistic extreme.

Still, more and more indicators are falling out of neutral, including real-money gauges and surveys. One of the granddaddy surveys from Investor's Intelligence showed that more newsletters expect stocks to decline than rally in the months ahead. This is the first week with fewer bulls than bears in nearly 2 years.

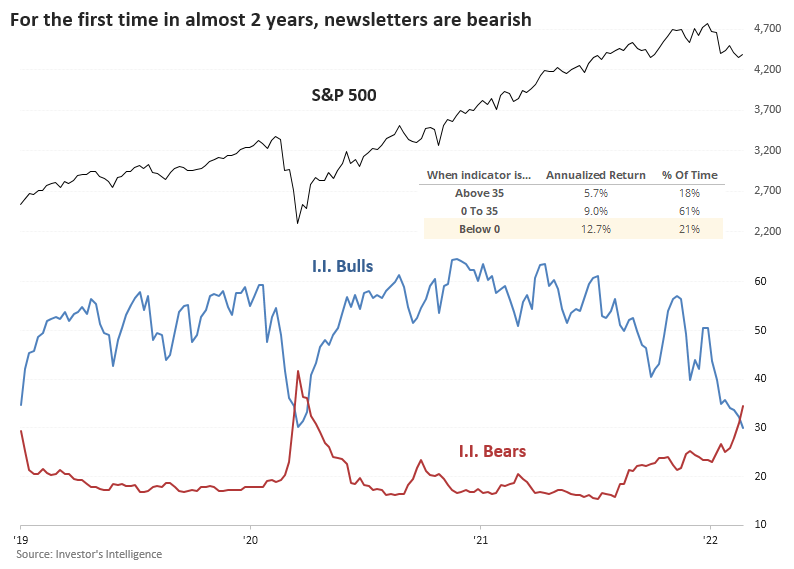
This ends the 6th-longest streak of bullish sentiment since the survey's inception.

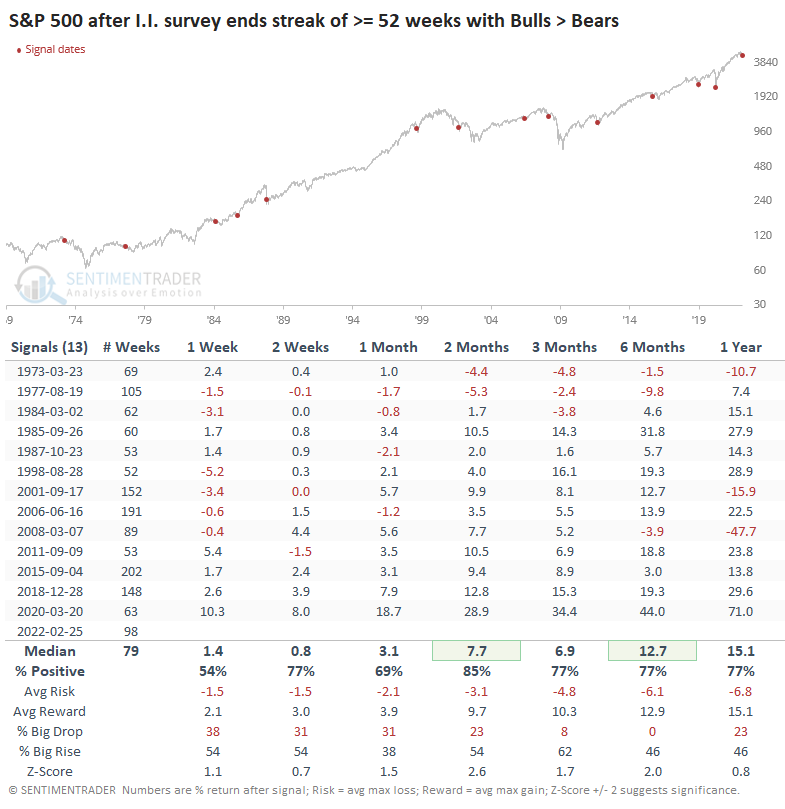
Best to fade the majority of newsletters

The ends of other long streaks of optimism tended to be a good sign for the S&P 500. While we prefer to see optimism rising instead of falling, by the time that pessimists accounted for the majority of newsletters, most stock declines were behind us. Over the next 2 months, the S&P rallied after 11 out of 13 precedents. The only two losses were in the 1970s, and the gains tended to persist, though they most certainly did not in 2008.

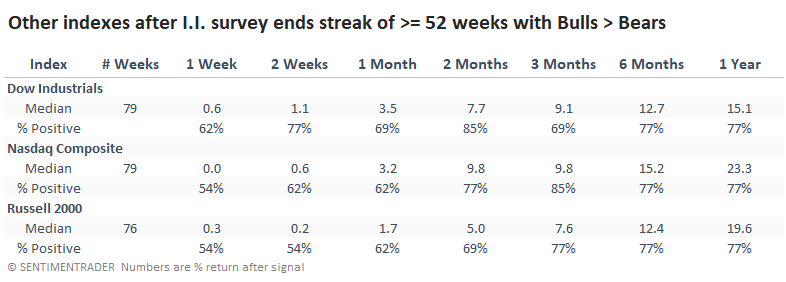
It was also a mostly good sign for the other major indexes. The Dow Industrials did the best in the short term, while the Nasdaq took the lead after that.

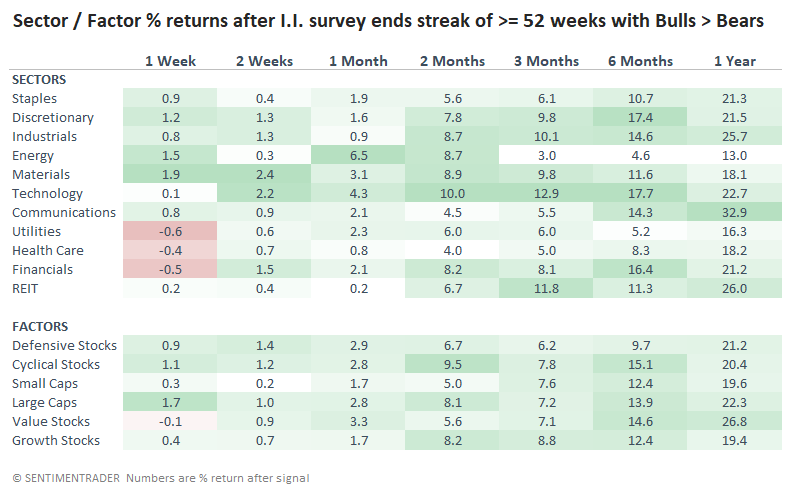
Among sectors and factors, Technology stocks showed the most consistently impressive average returns, with Industrials and Discretionary doing well, too. Cyclical stocks showed better short-term returns while Value stocks did best over the long term. Over the next 6 months, Value stocks gained after 12 out of 13 signals.

What the research tells us...

The Investor's Intelligence survey isn't yet showing that newsletters are extremely pessimistic. But the fact that they're pessimistic at all is noteworthy since it ends a long period of optimism. After other long streaks of bullish opinion, stocks had a strong tendency to rally in the months ahead. We'd prefer to see rising optimism, but the fact that stocks showed consistently strong returns after these streaks is a point in bulls' favor.

PRODUCTS
SentimenTrader
Trading Tools
Indicators & Data API
‍
Strategies & Scanner
‍
Research Reports
FREE
RESOUrCES
Simple Backtest
Calculator
Simple Seasonality
Calculator
The Kelly Criterion
Calculator
Sentiment Geo Map
‍
Public Research Reports
‍
Education
Sentiment Indicators
‍
Technical Indicators
‍
Pricing
Bundle pricing
‍
FAQ
‍
Announcements
‍
COMPANY
‍
About
‍
In the News
‍
Testimonials
‍
Client Success Stories
CONTACT
‍
General Inquiries
‍
Media Inquiries
‍
Financial Professionals Inquiries
‍
© 2026 Sundial Capital Research Inc. All rights reserved.
Setsail Marketing
TermsPrivacyAffiliate Program
Risk Disclosure: The information and tools provided are for research and analytical purposes only and are not intended as investment advice. Market analysis involves uncertainty, and outcomes may differ from expectations. Users should conduct their own due diligence and consider their individual circumstances before making any financial decisions. Past performance is not necessarily indicative of future results.

Hypothetical Performance Disclosure: Hypothetical performance results have many inherent limitations, some of which are described below. No representation is being made that any account will or is likely to achieve profits or losses similar to those shown; in fact, there are frequently sharp differences between hypothetical performance results and the actual results subsequently achieved by any particular trading program. One of the limitations of hypothetical performance results is that they are generally prepared with the benefit of hindsight. In addition, hypothetical trading does not involve financial risk, and no hypothetical trading record can completely account for the impact of financial risk of actual trading. for example, the ability to withstand losses or to adhere to a particular trading program in spite of trading losses are material points which can also adversely affect actual trading results. There are numerous other factors related to the markets in general or to the implementation of any specific trading program which cannot be fully accounted for in the preparation of hypothetical performance results and all which can adversely affect trading results.

Testimonial Disclosure: Testimonials appearing on this website may not be representative of other clients or customers and is not a guarantee of future performance or success.