Friday Color - Jobs, Econ Surprises, 4 Gains, Breadth, Energy, Gold

Like Tuesday, I won't be publishing a Daily Report, but will instead send this as a Bulletin. This is typically what's sent out around midday as a Premium Note - it's a look at my notebook of things I'm watching throughout the day, some of which then make it into the Reports.
The summary portions of the report, like Phases, Ranks, and Indicators at Extremes, can always be found on the Dashboard on the site (under the Market Overview section). You can also see the Geo-Map, as well as the thumbnail charts for Sectors, Countries, Bonds, and Commodities.
Jobs
We saw on Thursday that a big miss in the ADP report possibly meant a big miss in the Nonfarm Payroll report today, and if it dove to a 5-year low, would be a bad sign for stocks. The report missed, but wasn't bad enough to trigger the 5-year low. So at least there's that.
But the report did miss expectations by 100k, one of the larger oops in the past 20 years. It hasn't had a consistently negative bias for stocks, though.
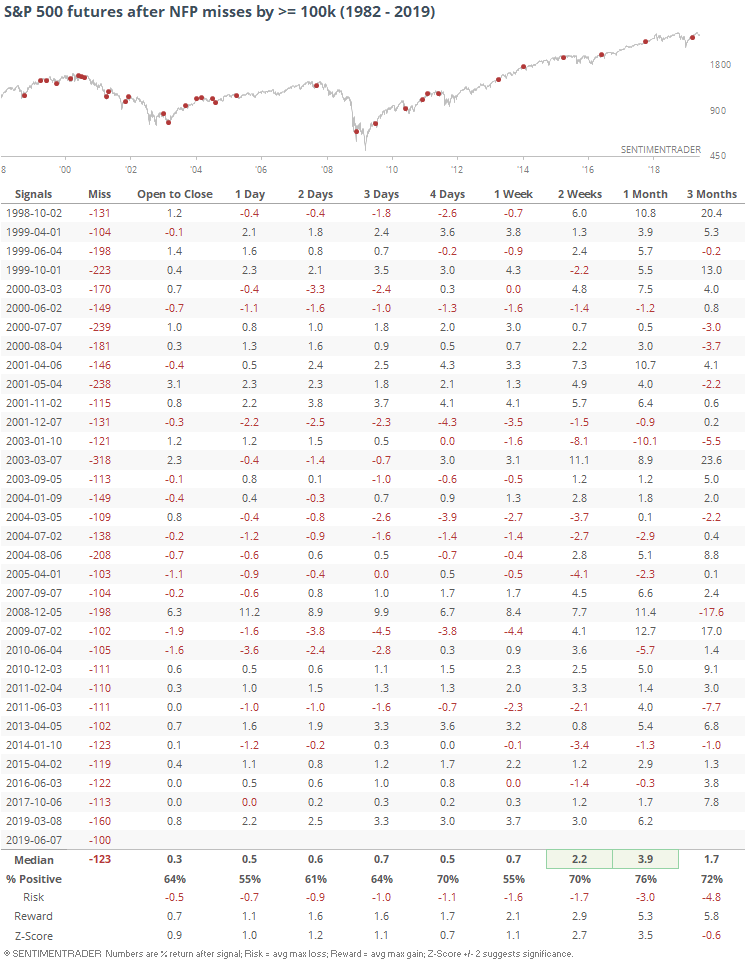
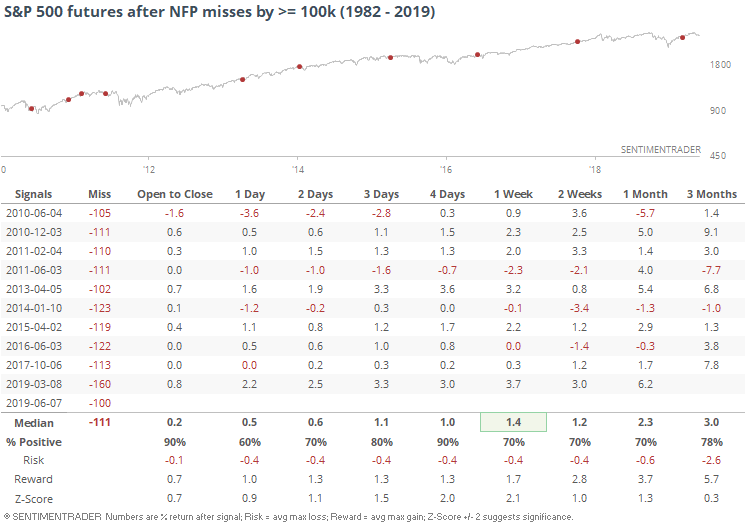
Especially since the financial crisis.
If we focus on a miss of any magnitude in the jobs report over the past 2 years, it's still not a consistent negative.
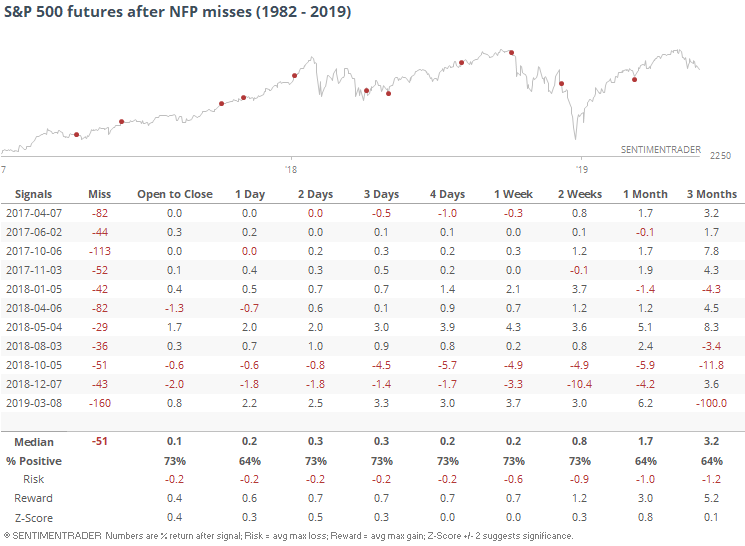
Futures have been hit much harder when expectations were exceeded by more than 100k (possibly fueling inflation).
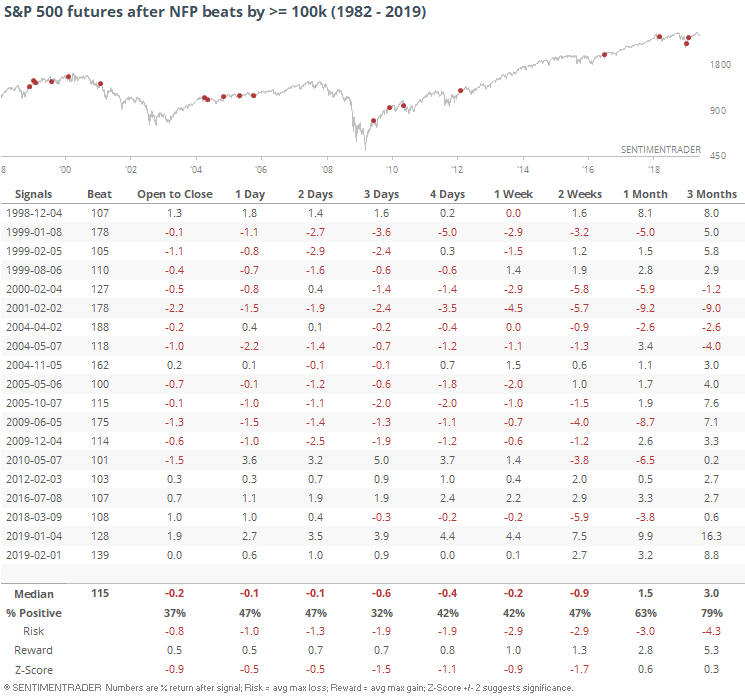
Investors' preference for strong or weak economic data changes all the time, but reactions to these jobs reports have held pretty steady.
More Bad Econ Data
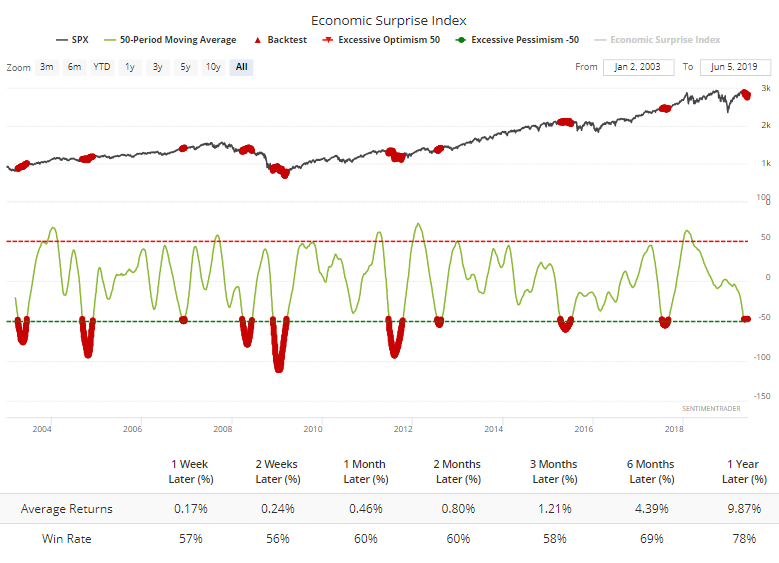
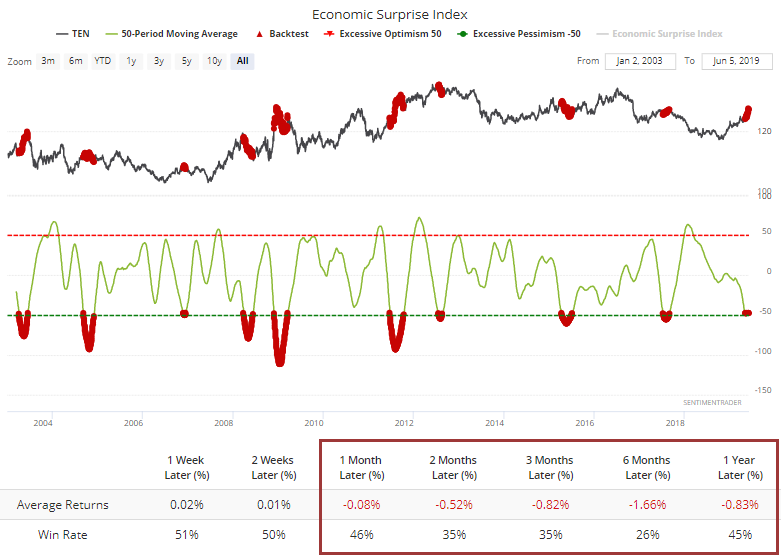
The big miss in the payroll report is going to further drag down the economic surprises indexes. When reports consistently miss economists' expectations, they adjust their going-forward estimates, and then future reports tend to beat those lowered numbers. But we haven't really started to see that yet. The Citi Economic Surprise Index has been at nearly -50 for the past 50 days.
It has been this low, for this long, only 4 other times since the financial crisis. There is only a loose correlation with stock prices, though, especially when looking forward instead of backward. The S&P 500's returns in the weeks and months ahead were decent, even when the 50-day average of economic surprises was this bad.
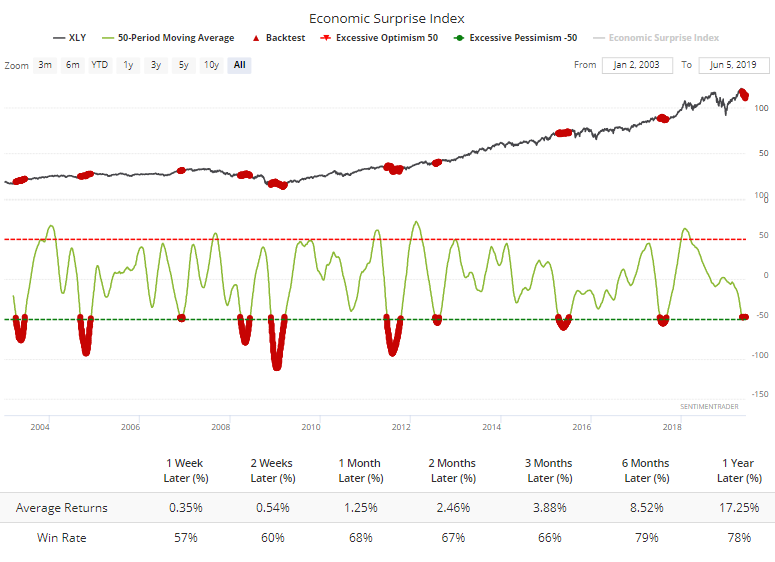
If we assume that investors sold sectors like consumer discretionary, then perhaps by the time economic reports got as bad as they've been lately, much of that selling was exhausted. Turns out that was mostly the case, but wasn't perfect.
You can change which market is being tested in the Backtest Engine, and if we swap out the S&P 500 for the XLY fund, we can see that forward returns were better than the S&P's.
Financial stocks fared less well.
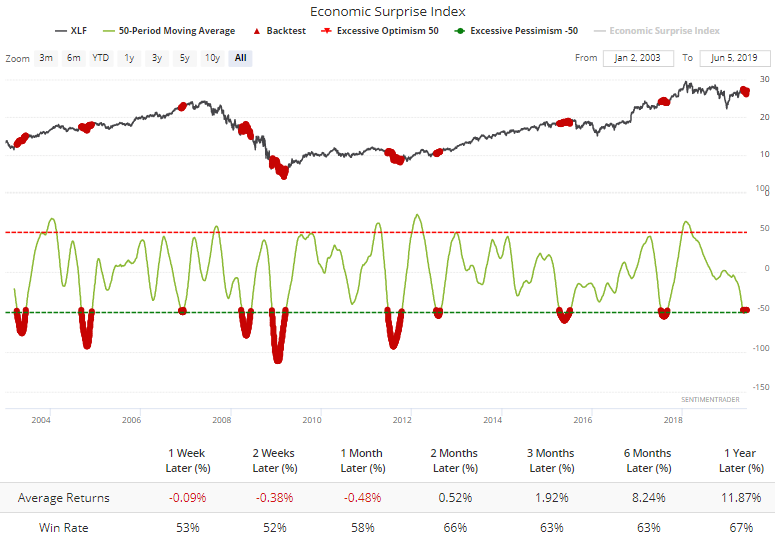
Since bad economic reports usually meant that investors would move into bonds, by the time the reports were this bad for this long, a lot of the bad news was already bake in, and 10-year Treasuries fared poorly going forward.
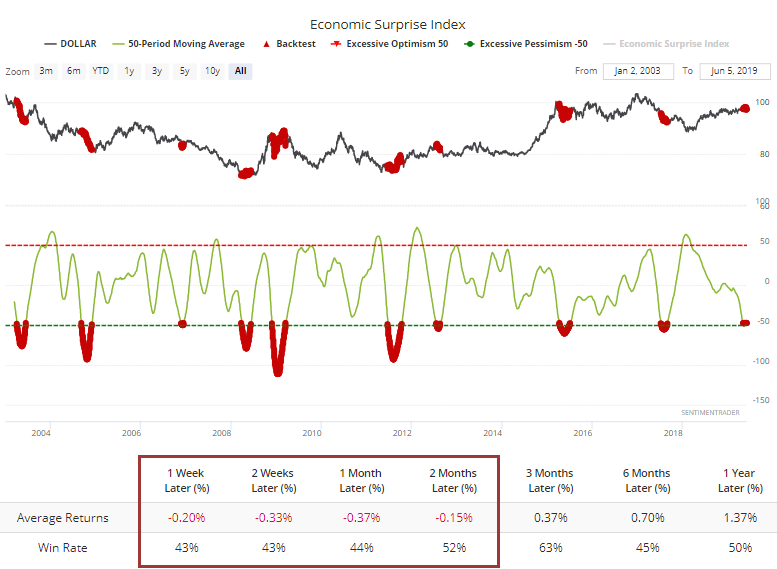
The U.S. dollar was weak in the shorter-term, then mixed.
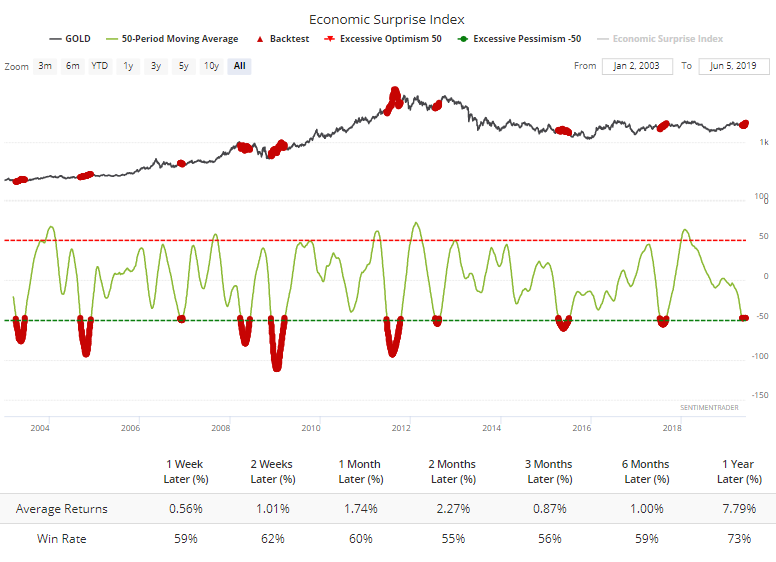
Buying gold was a mostly winning proposition, but by no means a slam-dunk.
Another Day Of Gains
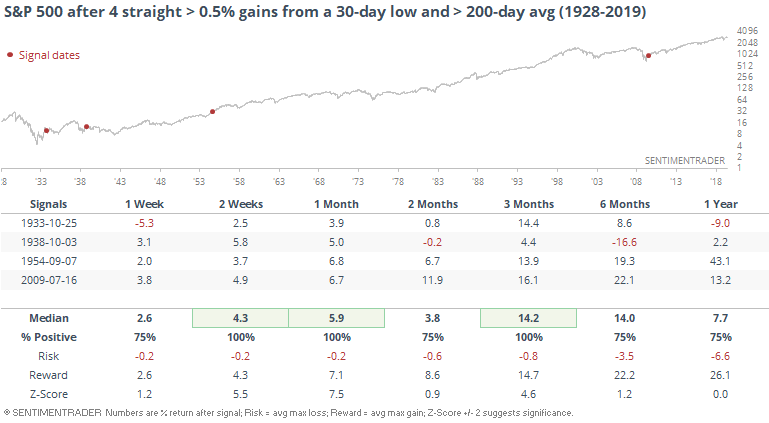
Based on the price action so far, the S&P 500 will enjoy its 4th straight day with at least a 0.5% gain, coming on the heels of what had been at least a 30-day low. This kind of momentum has tended to keep going.
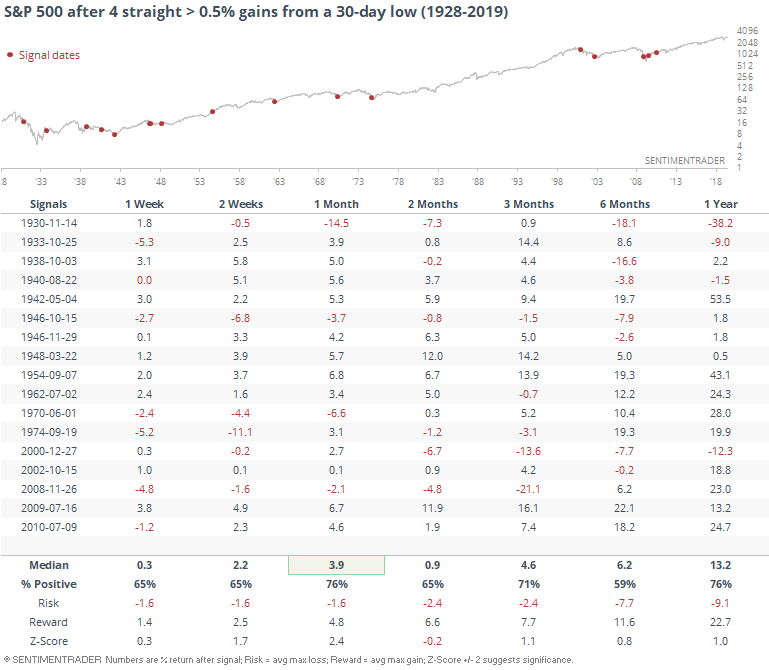
It's only happened 4 other times in history when the S&P was above its 200-day average at the time.
Breadth Review
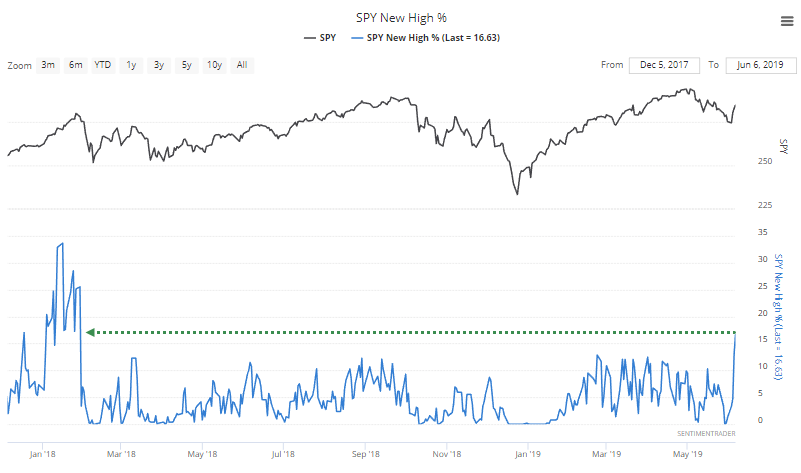
There was a further surge in stocks within the S&P 500 that hit 52-week highs on Thursday. More than 15% of stocks did so, the first time in a year and a half.
There have only been 5 other times since 1990 when it took a year or more to achieve this many new highs within the index.
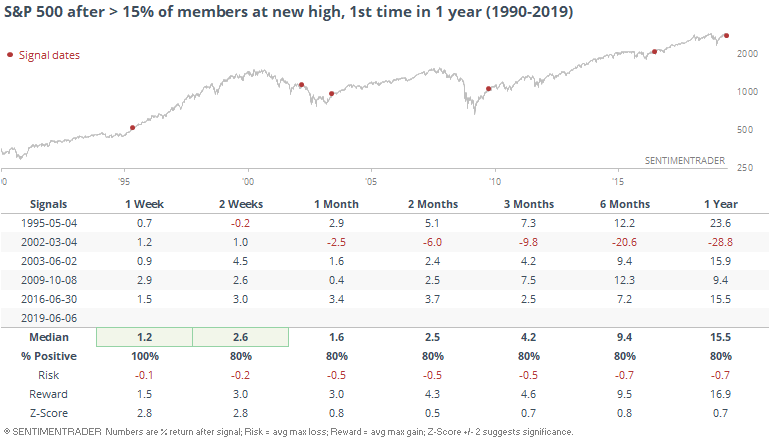
That was quite a fakeout in 2002, and a miserable failure for those who bought into the "breadth is expanding and the bear market is over" trope. But the others were all fantastic winners, with very little risk over any time frame.
If we look at the risk/reward table, only that failure in 2002 shows any appreciable risk (maximum loss) at any point even up to a year later.

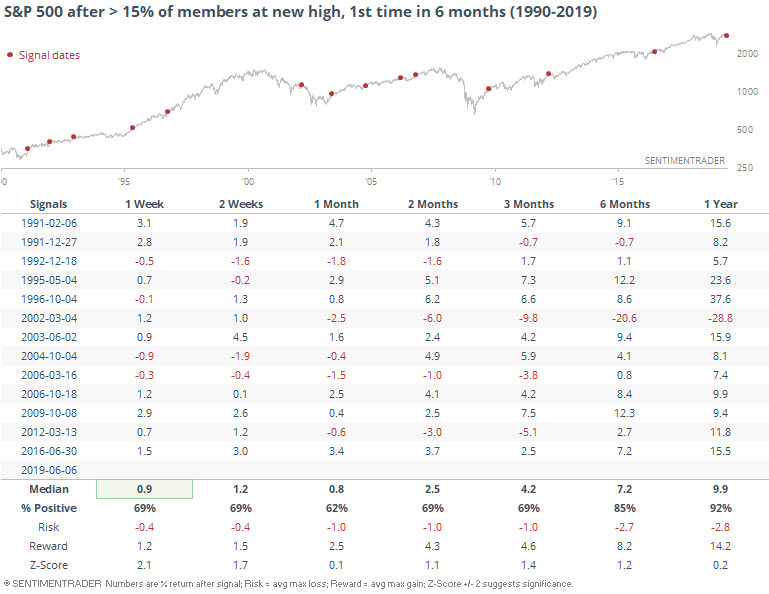
If we broaden the sample size by looking for the first time in at least 6 months that more than 15% of S&P stocks hit a new high, forward returns weren't quite so dramatic, but still consistently impressive, especially longer-term.
Granted, stocks have had a pretty steady ride higher since 1990, but the z-score shows that returns after these signals were still well above random during the study period.
Among sectors, there was some heavy buying across defensive-type sectors. Nearly a third of consumer staples stocks hit a new 52-week high. That has led to some short-term weakness.
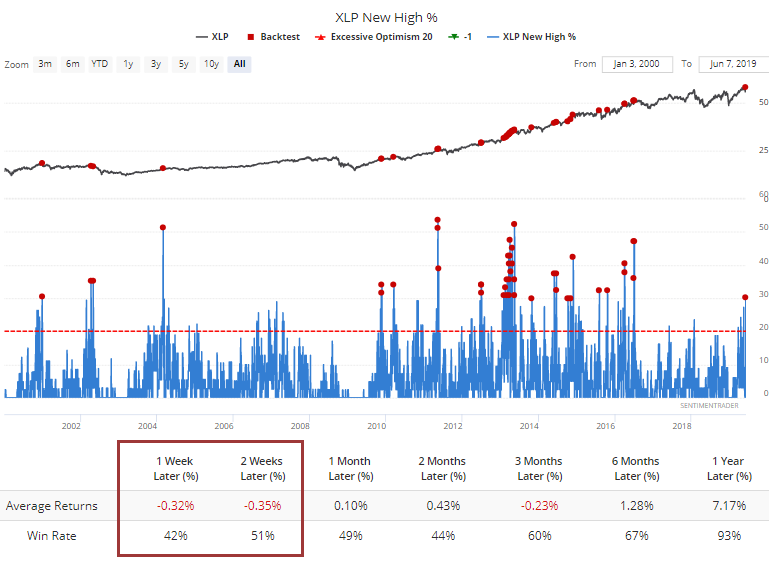
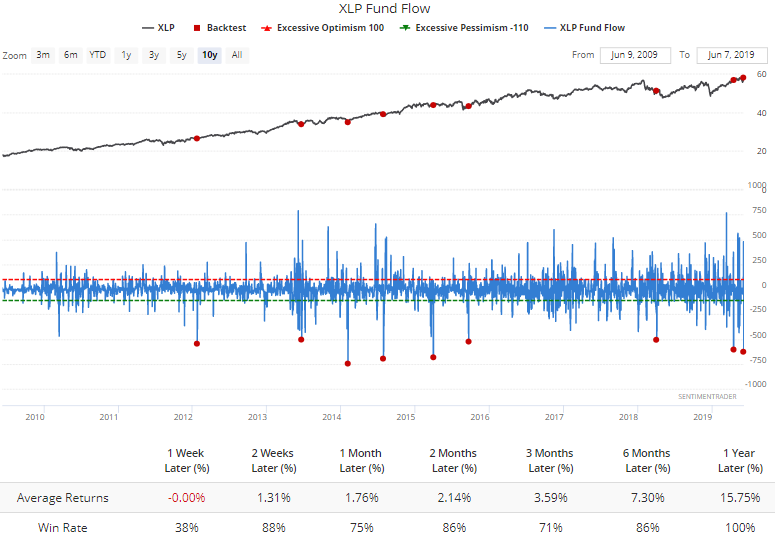
It's interesting that fast-money ETF traders yanked more than $500 million from XLP, one of its largest outflows since the financial crisis. Fund flows within sectors can be inconsistent - sometimes contrary and sometimes not - and staples are no exception. But other big outflows led to some very short-term weakness before mostly strength (it has been a bull market, after all).
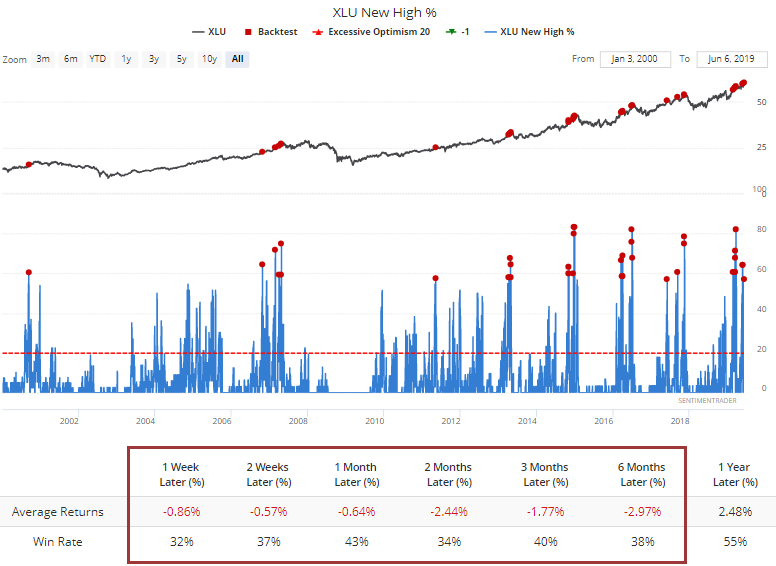
And almost a whopping 60% of utilities.
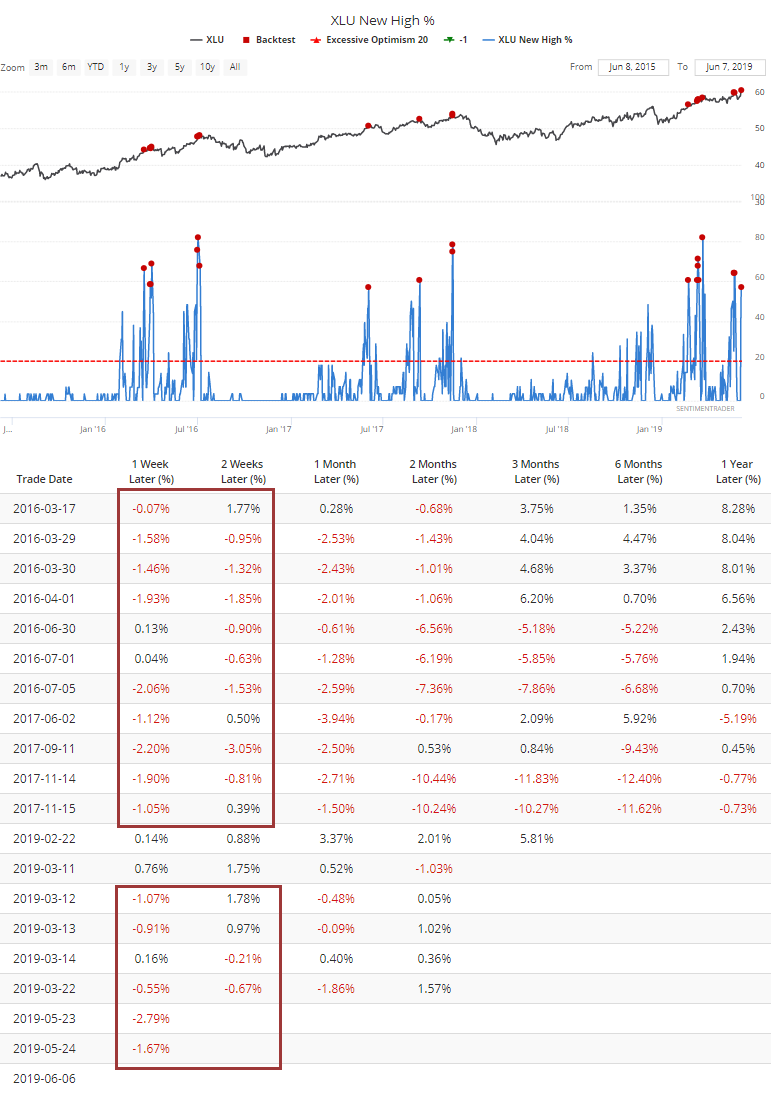
When we zoom in on the past few years, we can see that almost every signal led to a negative return either 1 or 2 weeks later.
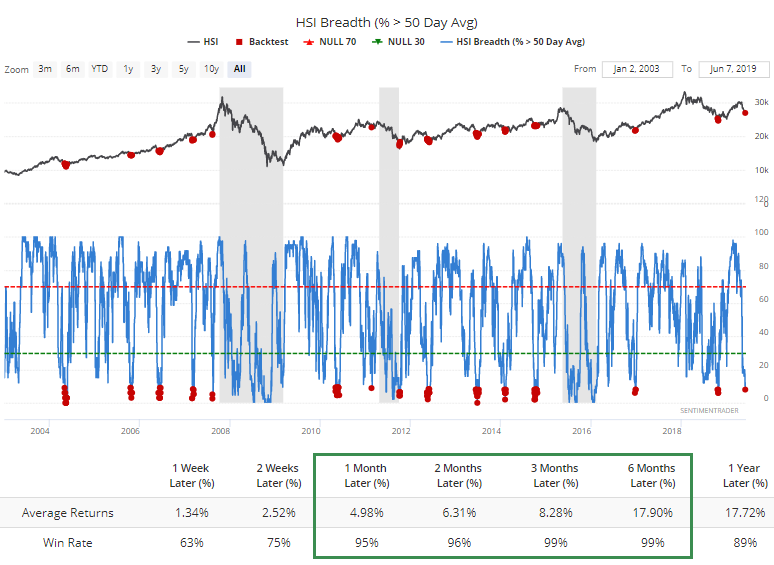
In overseas markets, fewer than 10% of stocks in the Hang Seng have managed to hold above their medium-term 50-day moving averages. This is an iffy way to look at things, but with that caveat aside, when U.S. stocks were still in a bull market environment, such a low reading on the Hang Seng preceded medium-term rallies almost every time.
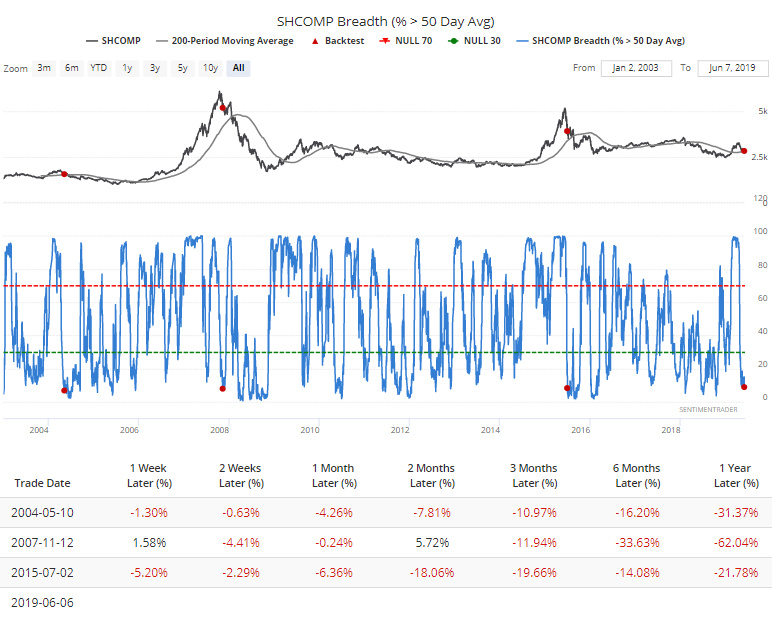
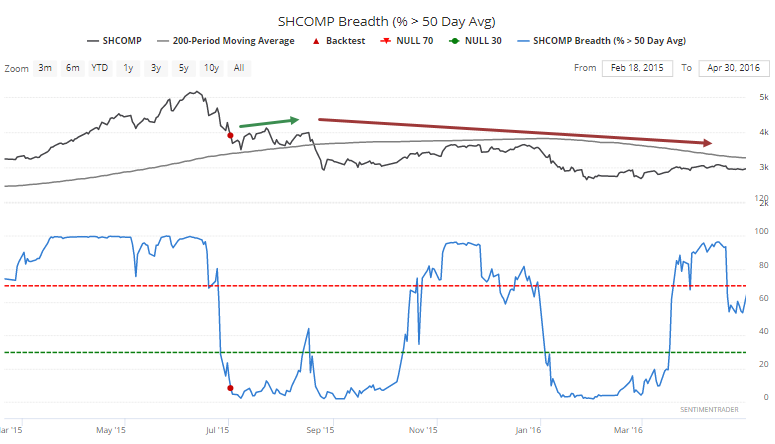
On the Shanghai Composite, fewer than 9% of stocks are above their 50-day averages when while the index holds above its 200-day. We've look at these kinds of selling thrusts several times over the past month, all with negative precedents. There have only been 3 similar instances, so that's a check against putting too much weight on this kind of activity, but still, those precedents were ugly.
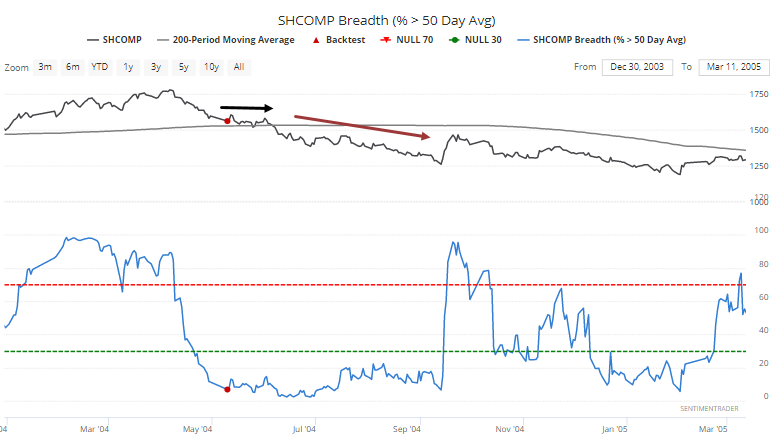
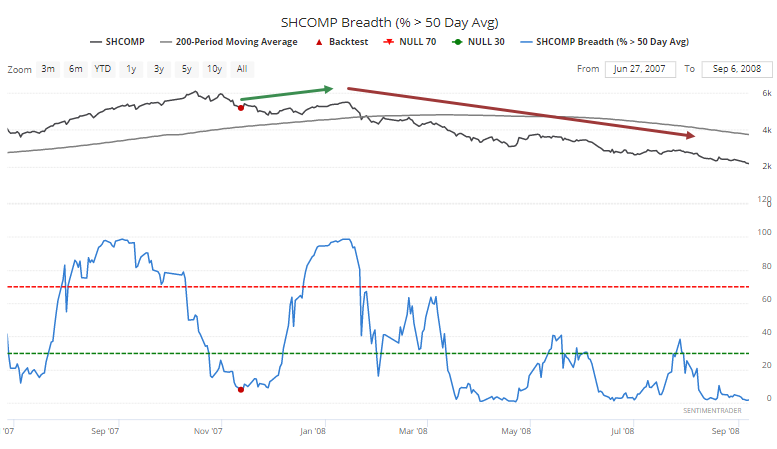
When we zoom in on those three, we can see that by the time breadth got this bad, there was some potential relief over the next few weeks or so, but it didn't last.
Negative Energy
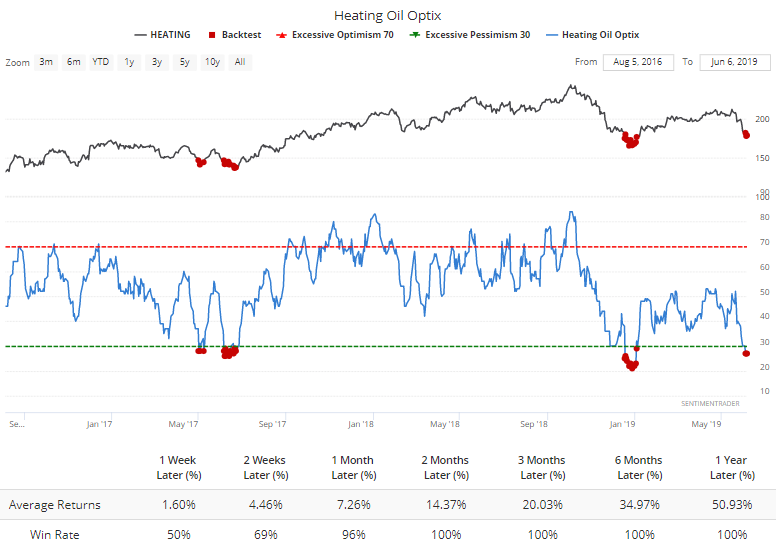
Sentiment on some of the energy contracts is nearing or at pessimistic levels. These markets tend to get "stuck" for weeks or months at a time, so it's less reliable than other markets.
For heating oil, optimism is at such a low point that it coincided with rallies in recent years.
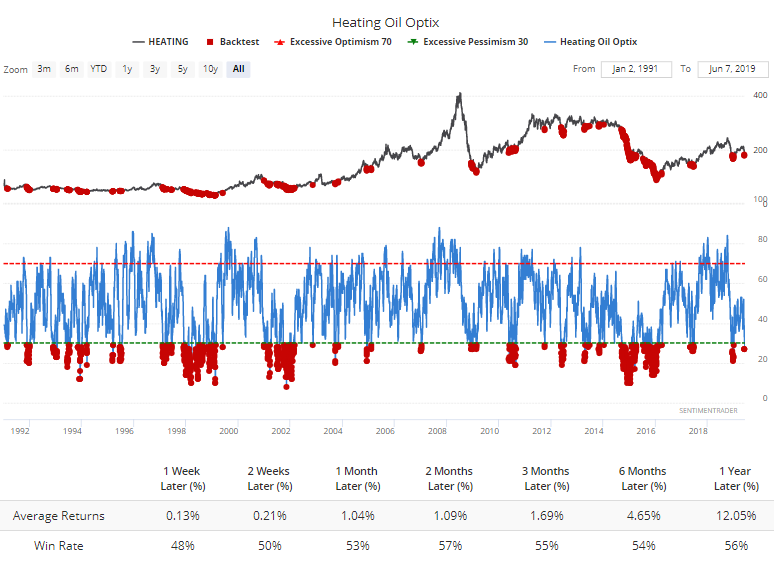
But long-term it's been barely reliable. Returns were better by waiting until the Optimism Index crossed back above 30, helping to avoid some of the worst drawdowns in years like 2014-15.
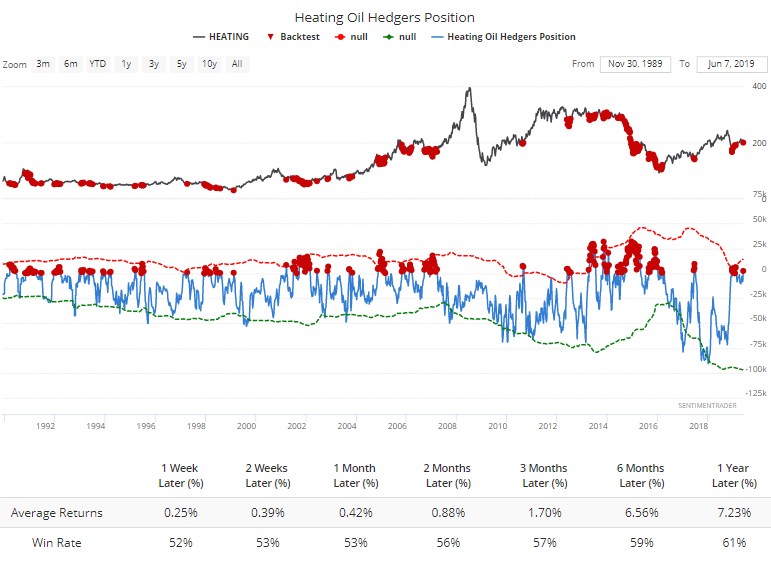
Hedgers are betting on a rally, holding a relatively rare net long position. But again, they've been less reliable in energy contracts, and heating oil is no exception.
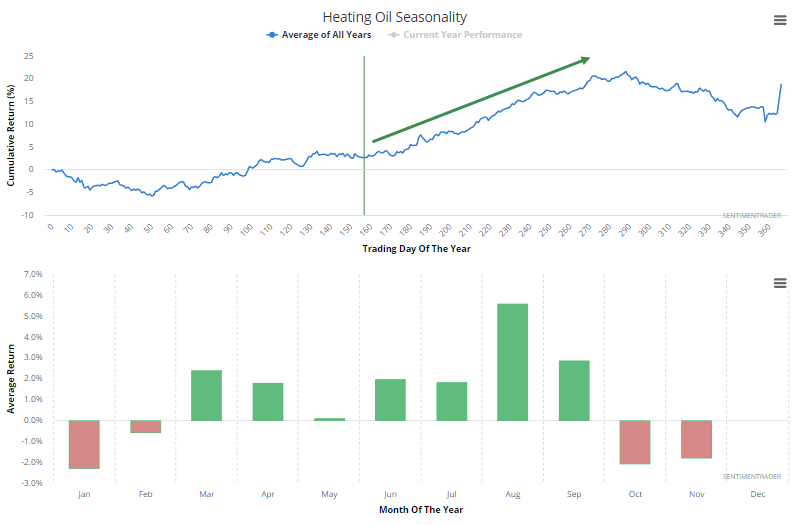
Seasonally, it's a good time of the year for this contract. The summer months have seen heating oil rise consistently.
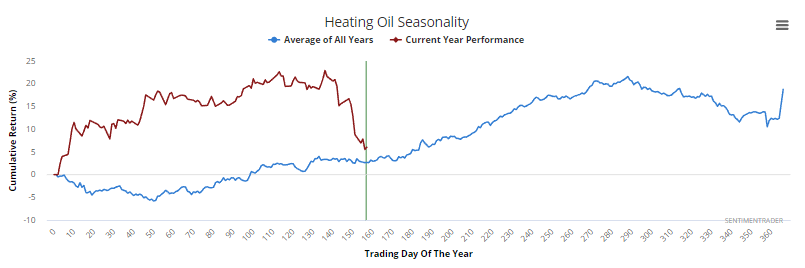
Unfortunately, it has done almost the exact opposite of its usual pattern so far this year.
Positive Messages
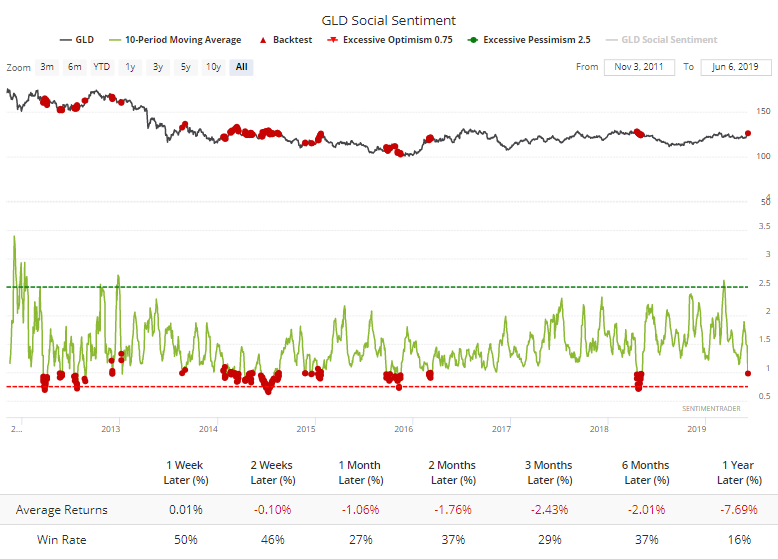
While sentiment on energy has been souring, gold has been the benefactor. Over the past 10 days, there have been more bullish Twitter messages about GLD than bearish ones, only the 2nd time in the past couple of years.
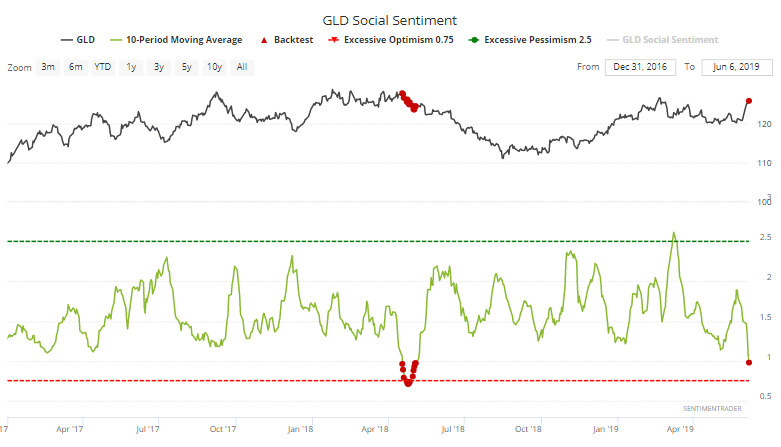
That has not been a good sign for a sustainable rally in years past, either.