Friday Color - Gold Momentum, Internal Warnings, Mexico

Here's what's piquing my interest on this summer Friday that's having some issues trying to hold any buying interest.
Unstoppable
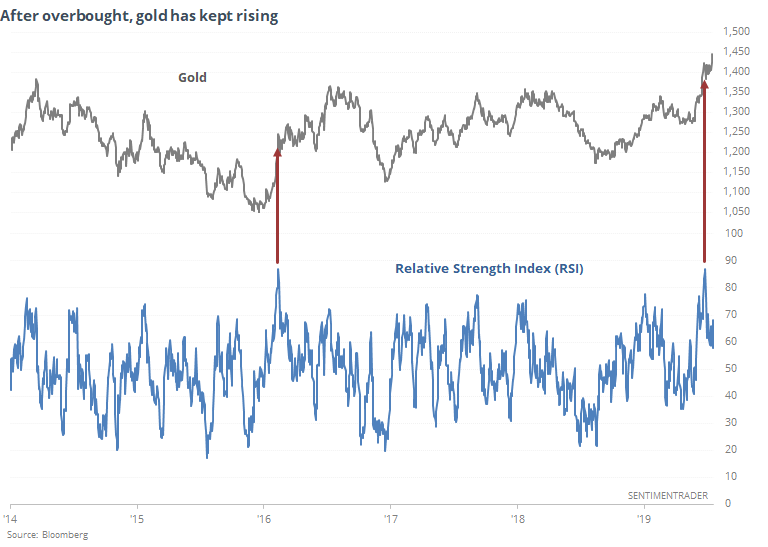
Gold reacted very well to the newly renewed projections of a larger rate cut at the next Fed meeting, breaking out again to another new high. So far, it has managed to shrug off the kinds of conditions that stopped other rallies in the past 7 years in their tracks. When we see behavior like this, very often it means something fundamental in the market has changed.
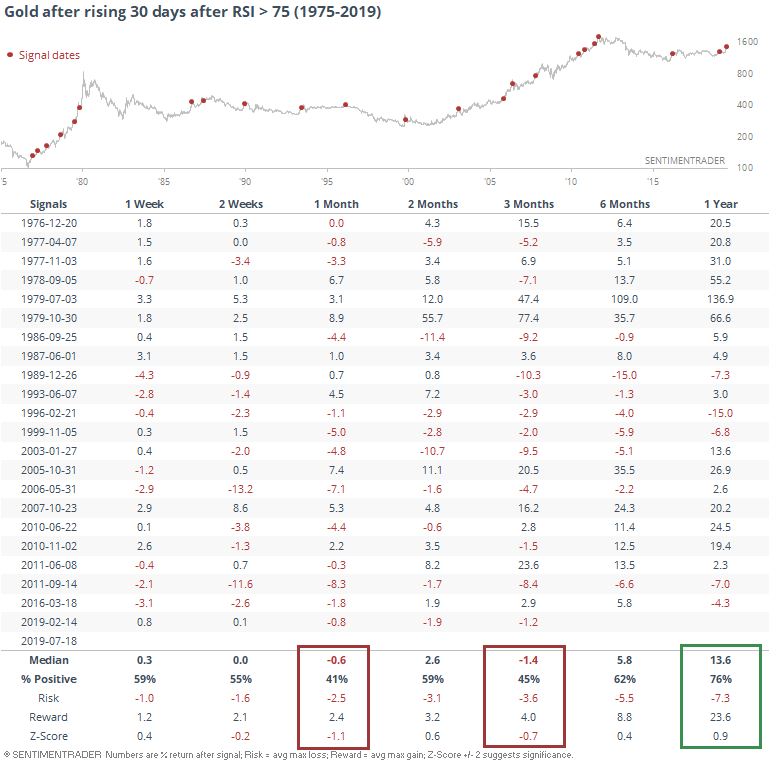
One of the better ways to test this is to see how the market reacts after overbought and oversold readings. Thirty days ago, gold's Relative Strength Index (RSI) exceeded 75, on route to one of its highest-ever readings. Since then, it has continued to gain like it did in early 2016.
Typically, a market that keeps rising in the face of shorter-term overbought conditions has buying pressure that tends to keep at it longer-term.
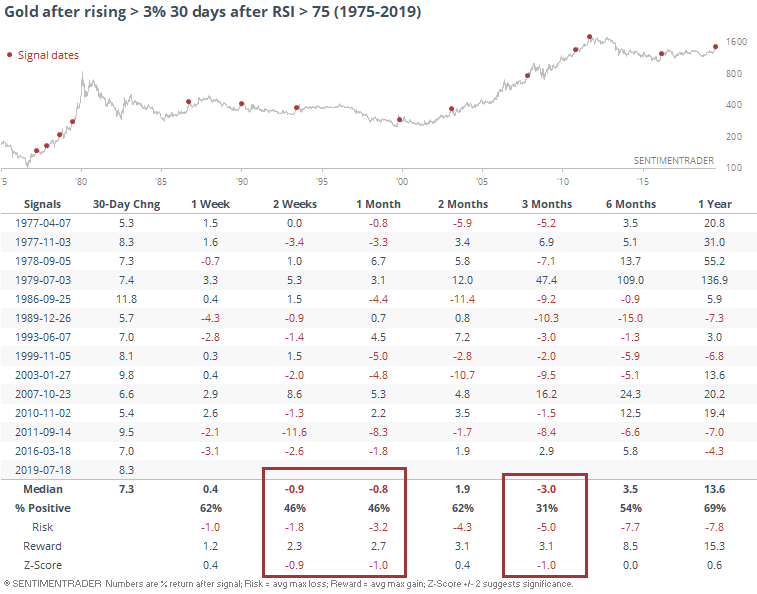
For gold, there wasn't too much sign of that. Its returns 1 and 3 months later were negative, with a risk/reward that was negative up to three months later. Only twice did it manage to post outsized gains over the medium-term.
Contract this to times when gold rolled over soon after hitting an overbought reading. Here, shorter-term returns were quite a bit better, with only a single loss over the next three months.
If we expand the sample size by looking at all times gold rose or fell 30 days after becoming overbought (instead of rising or falling by 3% or more), then it's a modestly different story.
First, here is every time gold became overbought then rose by any amount over the next 30 days.
Medium-term returns were still relatively poor, but a year later, it did quite well.
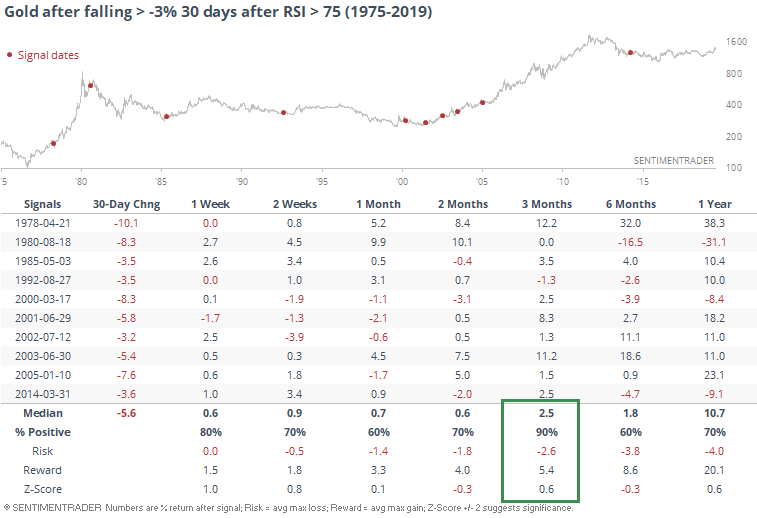
Contrast that to times when gold fell after hitting overbought.
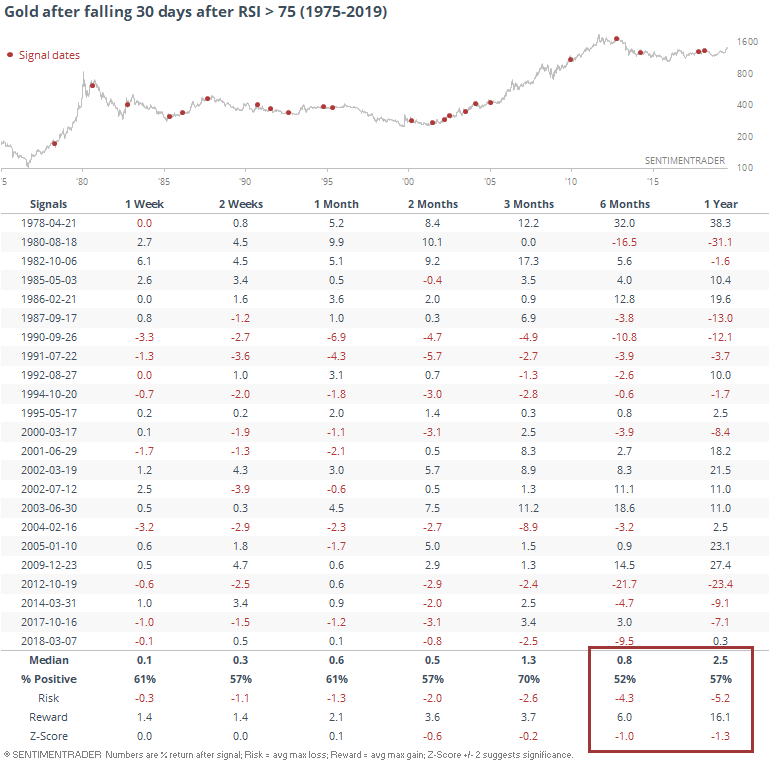
A year later, gold returned an average of only 2.5%, versus 13.6% when buyers had persisted. So, a modest suggestion that in the long-term, this kind of buying persistence is a good sign. Over the next few months, though, it's suggesting a breather.
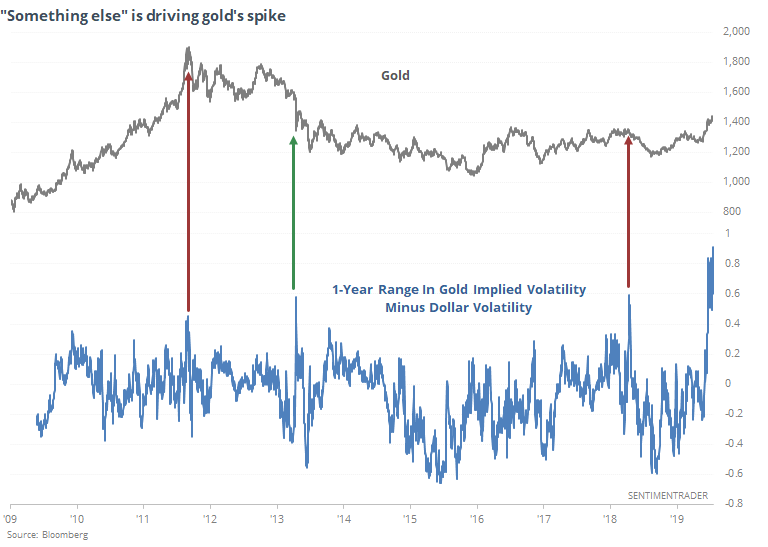
One of the most unusual aspects of this spike in gold is that the volatility is not being driven by volatility in currencies, as pointed out by TopDown Charts. Normally, the two go hand-in-hand.
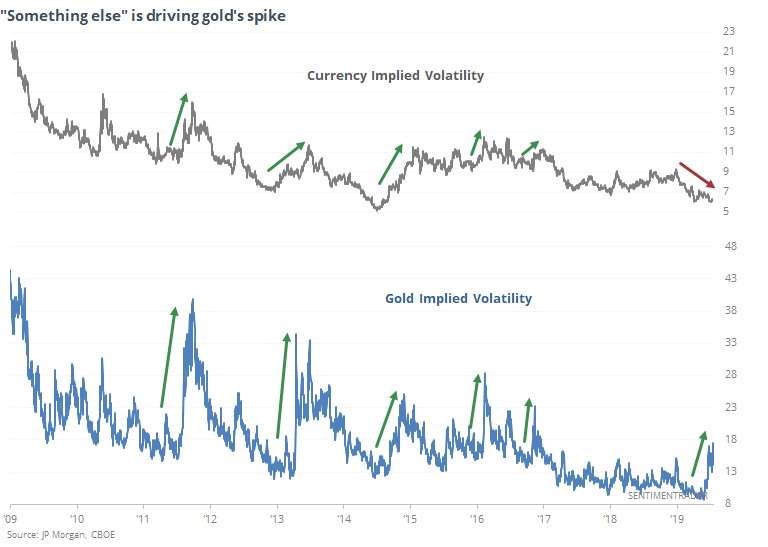
Each of the other times there has been such a wide divergence between the two, suggesting "something else" is driving gold, it formed at least a short-term inflection point.
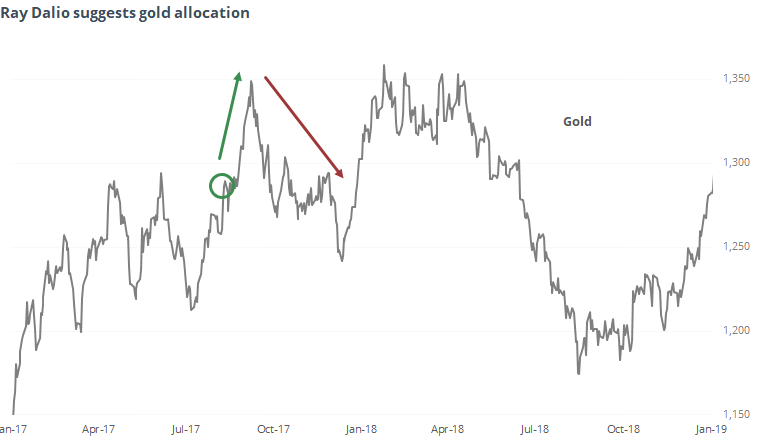
Suggesting some potential trouble for gold would go against some major traders and investors who have recently suggested its merits, mostly recently Ray Dalio.
When he originally recommended allocation to the metal in August 2017, gold was flirting with its highs, then broke out soon after his comments were posted. That was good for about 3 weeks, then it collapsed and only earlier this year sustained a move above the price it was then.
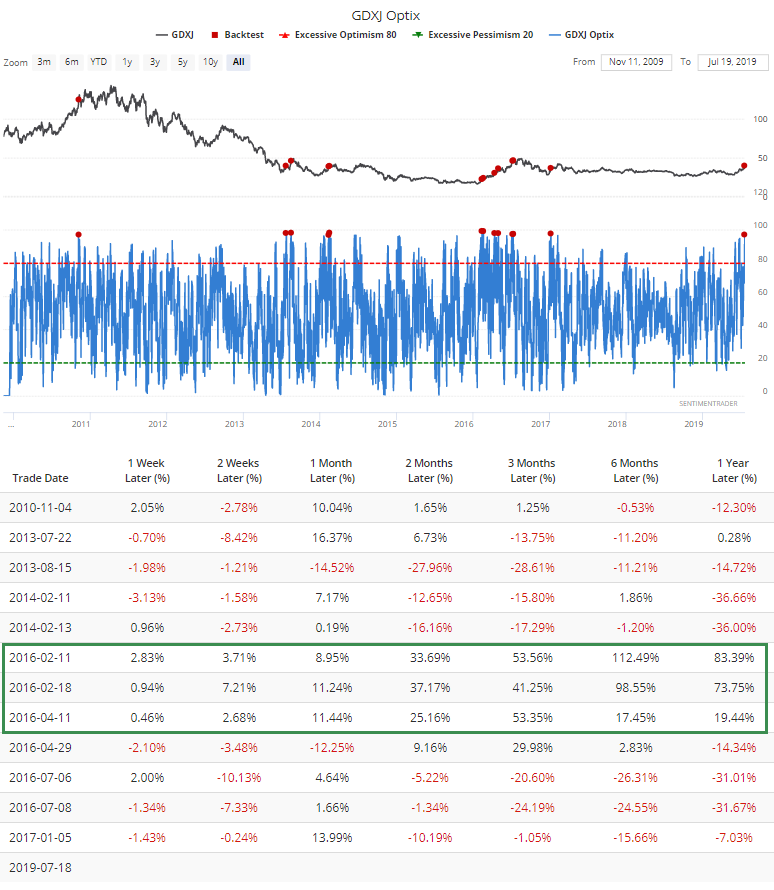
The jump in gold triggered a coincident jump in gold mining stocks, and the Optimism Index for the junior miners exploded to one of its highest in 8 years. Again, early 2016 was the only time it managed to shrug off readings like this, suggesting if it does so again now, something fundamental has changed in this corner of the market.
Warning
Last September and October, we discussed a persistent set of warning signs in market internals. The names given to some of these warnings are silly and nothing but marketing ploys, which means that "serious" investors tend to ignore them. That's good for the rest of us, because most of the time, they are very effective, as they were last fall.
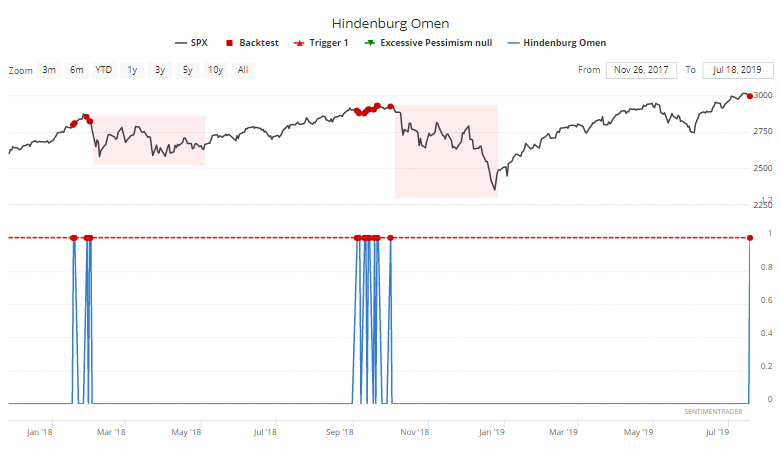
They're just now starting to pop up again.
On the NYSE, a Hindenburg Omen was triggered on Thursday, at least they way we've always calculated it. It's a more effective warning when these cluster together over a period of weeks, but even a single day has preceded significantly weak returns in the S&P 500.
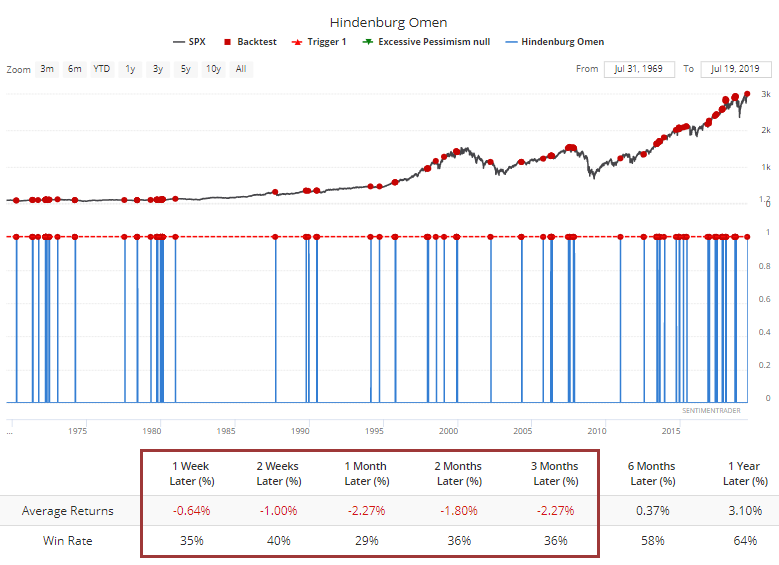
It was most certainly *not* effective in 2017, which caused those who marginally followed the indicator to abandon it. Everything fails from time to time. The last two clusters of signals were tremendously helpful.
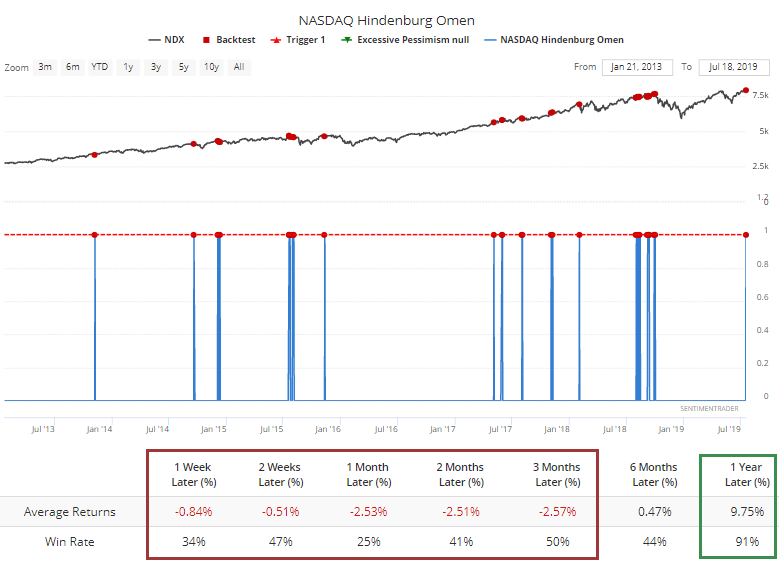
For the Nasdaq, it was less of an immediate warning, and more a heads-up that over the medium- to long-term, risk was building for some of its larger stocks in the Nasdaq 100.
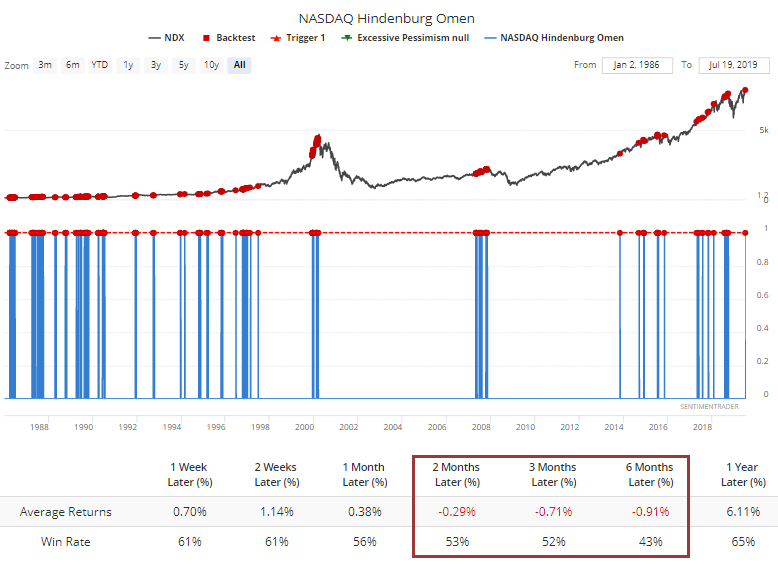
Many of those positive returns occurred in the early 1990s. When they triggered in 2000 and 2007-08, clearly they were effective. Since the financial crisis, they have triggered more often, and even though the Nasdaq has been in a monstrous uptrend, it has struggled after these signals, this time more in the short-term than long-term.
Sector Breadth
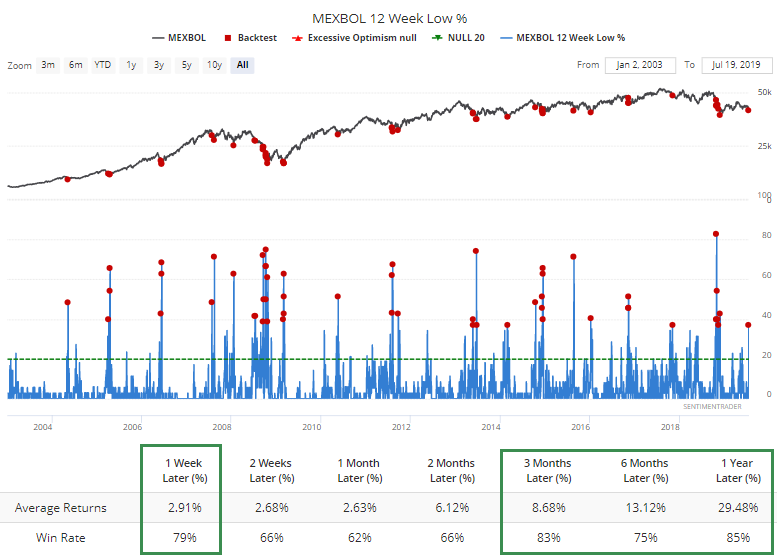
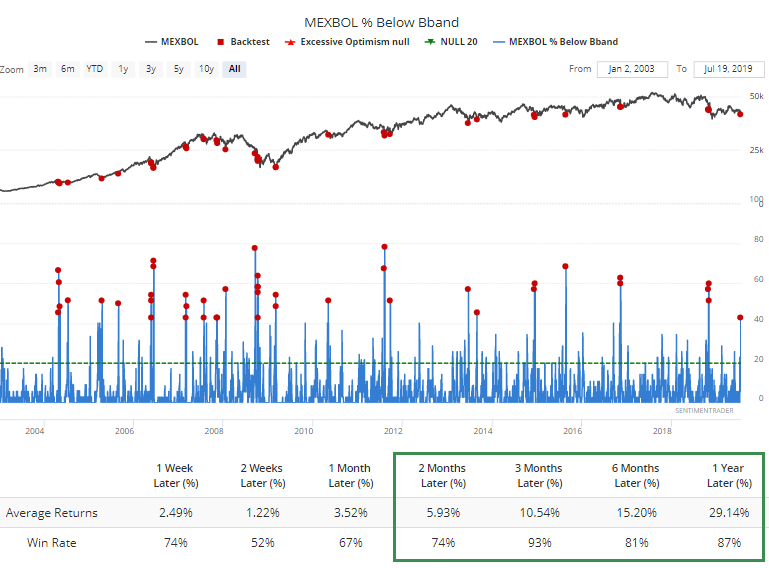
Among sectors and overseas indexes, the most extremes are currently registering for Mexican stocks. The S&P/BMV IPC, more commonly referred to as the Mexbol index of 35 stocks, is on the cusp of registering panic-level selling pressure.
More than 40% of the stocks have dropped below their lower Bollinger Bands. Out of 42 days when it was this high, 39 of them showed a positive return over the next 3 months.
Nearly 60% of them have dropped to their lowest prices in at least a month.
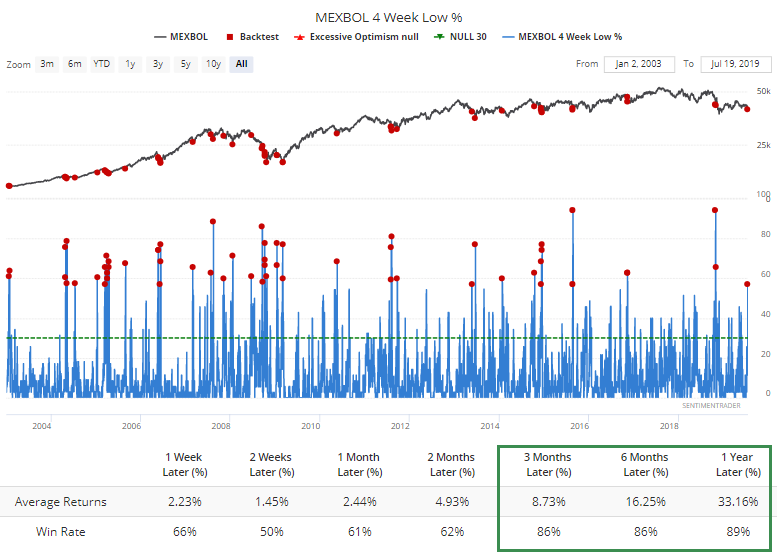
And for many of those, it's their lowest price in at least several months.