Friday Color - Risk Off, Options Anxiety, Many Lows, Big MOVE, Sector Extremes

Here's what's piquing my interest as bulls try to enjoy a summer Friday.
Anxious
Signs of nervousness are everywhere. Over the past couple of days, we've seen a spike in pessimistic extremes, so there's no shortage of examples. Troy pointed out several aggregate sentiment gauges (Dumb Money, CNN Fear & Greed, Risk Appetite) have moved to notable lows, especially given the market's trend is still relatively positive.
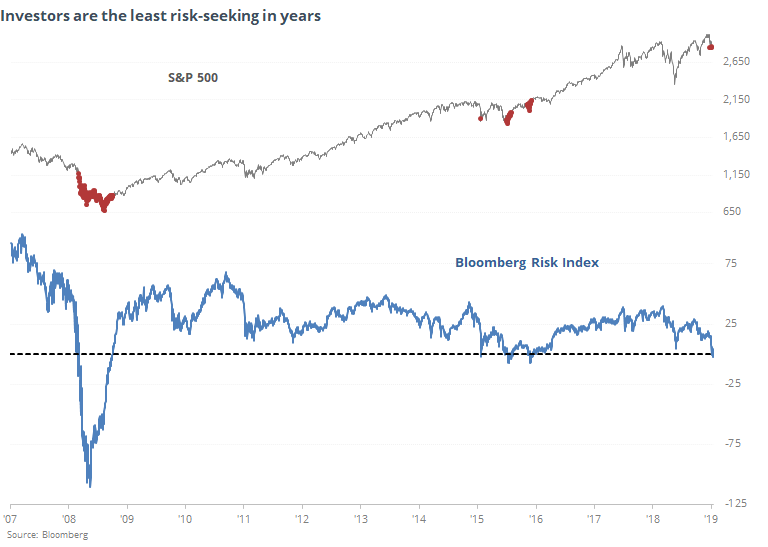
Even Bloomberg notes that their measure of risk-on sentiment is the lowest in years.
"A custom Bloomberg index that combines 18 indicators tracking equities, bonds, currencies, commodities, volatility and liquidity calibrated back to the financial crisis to measure whether markets are in a “risk-on” or “risk-off” mode fell on Thursday to its lowest level since mid-2016."
The index has nearly eclipsed its low from 2016 which would make it the most risk-averse since the financial crisis.
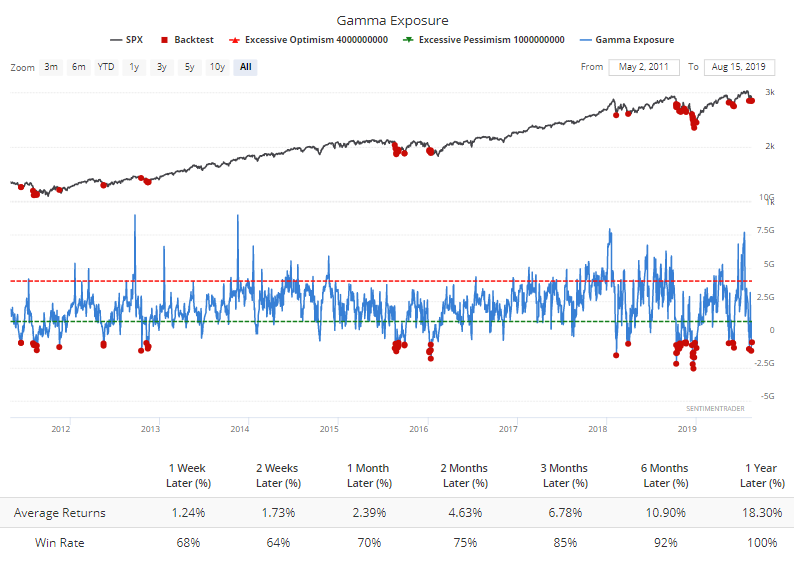
Options traders' gamma exposure appears to be extremely low now.
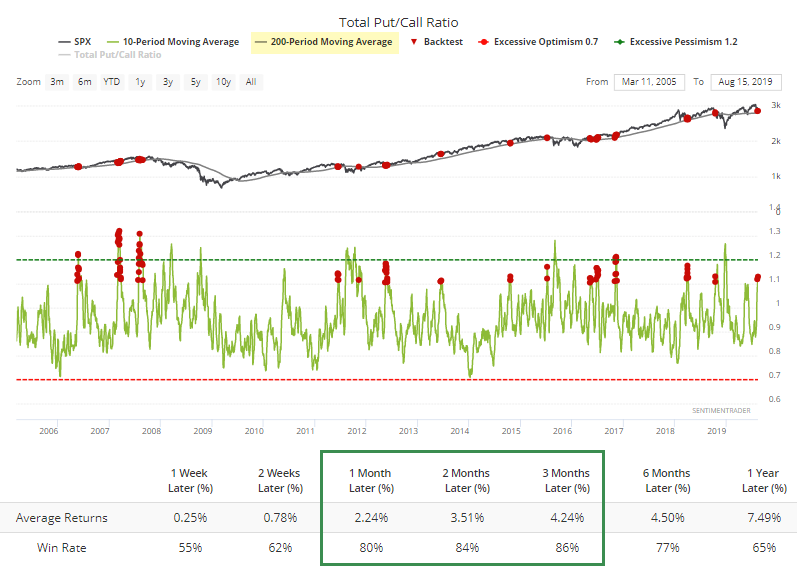
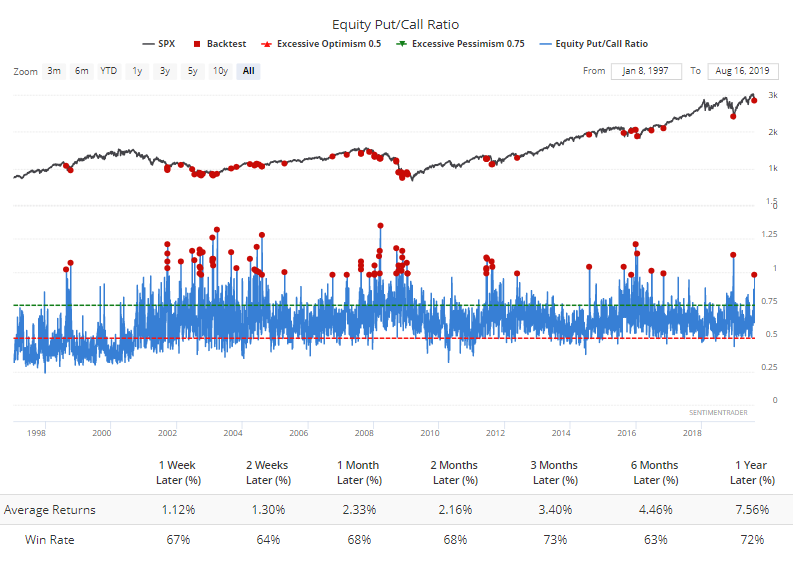
They've been busy trading put options, that's for sure. The 10-day average of the Total Put/Call Ratio has climbed above 1.1, meaning an average day over the past 2 weeks has seen 10% more put volume than call volume. During a rising market, that has had good medium-term implications (click here for the backtest parameters).
Much of that volume has been in equity options, with a big spike yesterday. Rarely seen since the financial crisis, and not exactly common even prior to that.
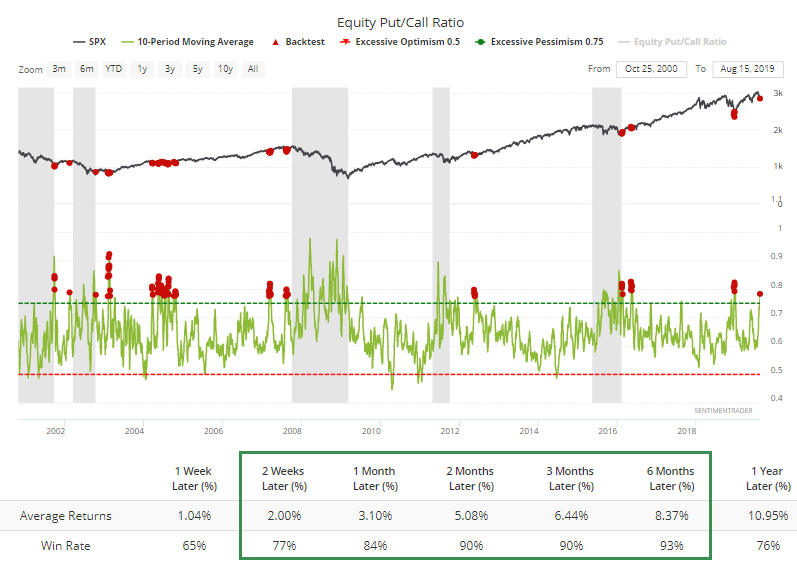
The 10-day average of equity-only volume is now among the highest since the financial crisis. Even including the last two protracted bear markets, 1-month returns were decent.
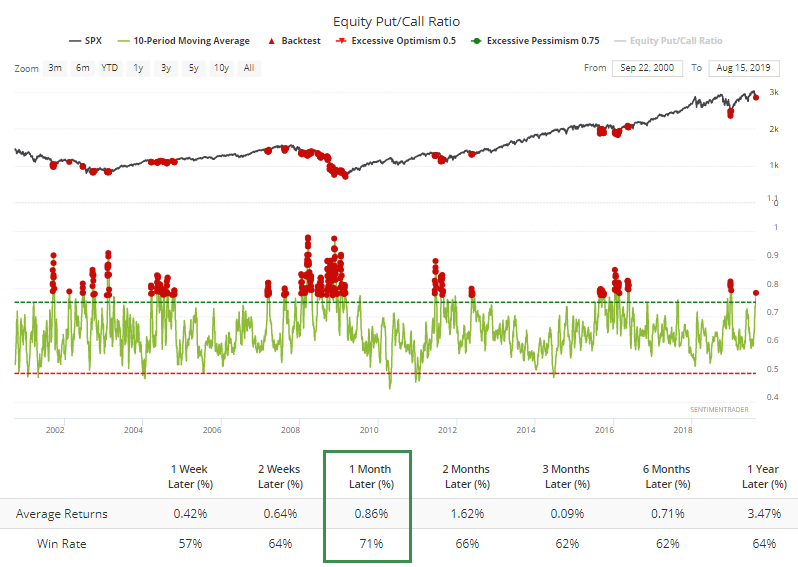
During bull markets, such heavy put activity was understandably positive.
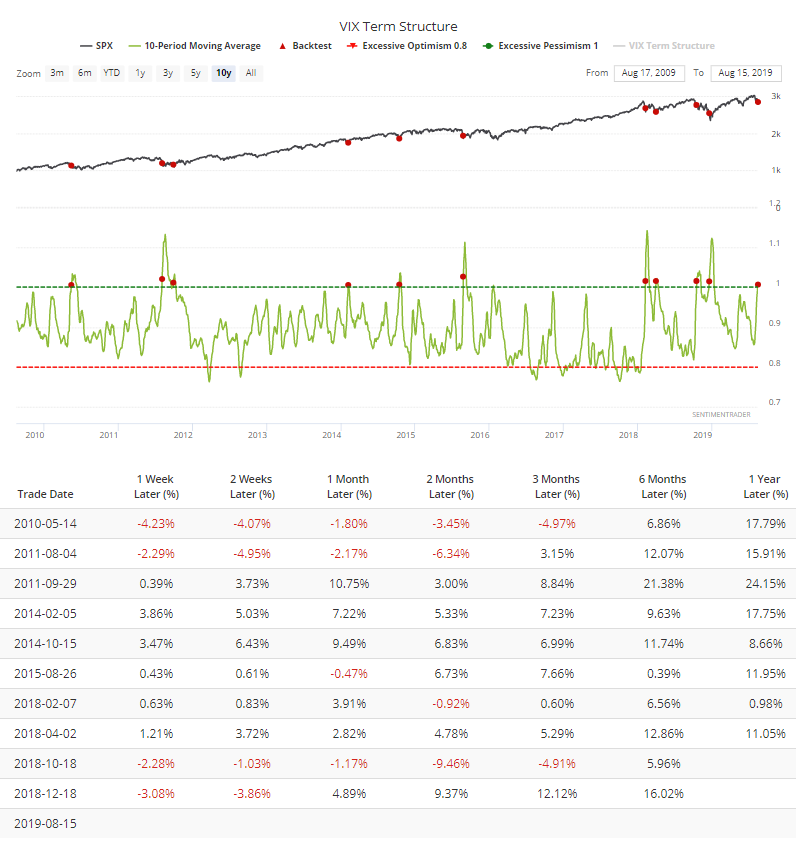
The concern has also pushed near-term volatility expectations above medium-term ones, something that happens when options traders get nervous about the immediate market environment. That has been the case for most of the past two weeks, so the 10-day average of the VIX Term Structure just crossed above 1.
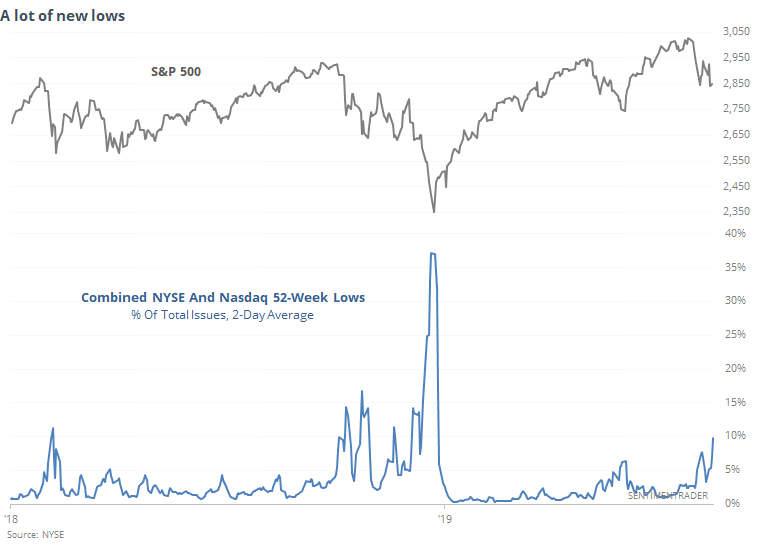
Lots Of Lows
Unlike at some of the past inflection points, not everything is in agreement just yet. We've been noting the "split" nature of the market since mid-July, and that has not changed. There are still many (too many) securities hitting one extreme or the other.
Over the last couple of sessions, that has skewed toward 52-week lows, with an average of 10% of issues on the NYSE and Nasdaq sinking to their lowest prices in the past year. That about marked the low last February, but only the beginning last fall.
The latter scenario has been the more common outcome. When the S&P 500 was still trading above its 200-day average and 52-week lows across both exchanges got this high, stocks struggled more than rebounded.
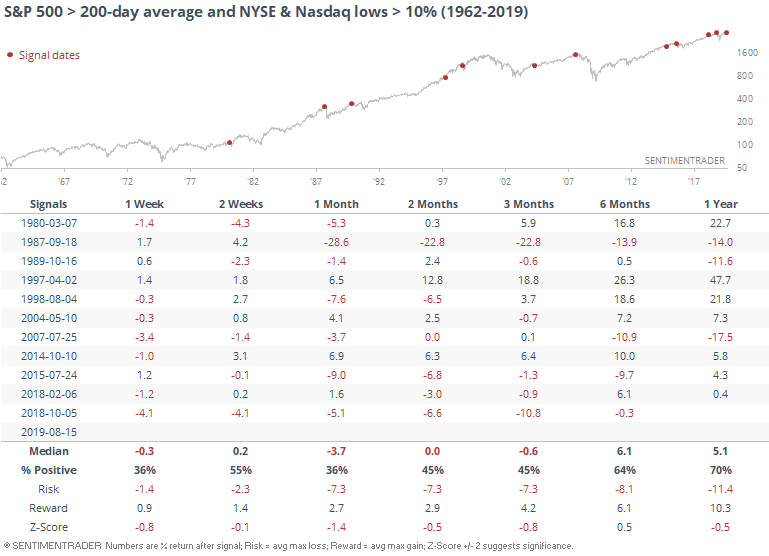
There was an initial sign the worst was behind us when new lows collapsed last week, but it surged again in the past couple of days. Bulls would be able to breathe easier if markets settled down and this figure once again started to drop instead of rise.
MOVEing
The volatility in bonds has been even more egregious than stocks, and the bond market's "VIX" is jumping. It has soared more than 50% in just the past two weeks.
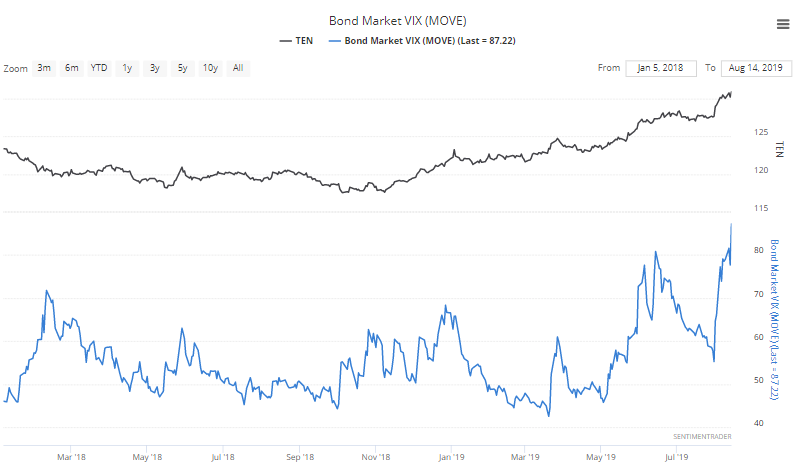
This is typically only seen during times of duress.
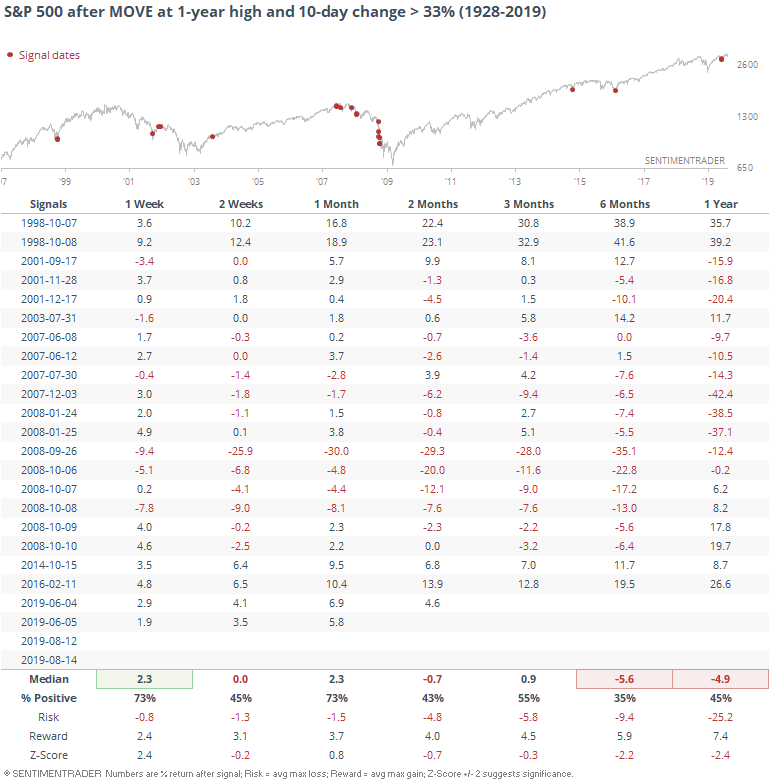
Forward returns don't look so good, because most of them triggered during the financial crisis. Using the first signal in months, it cleans it up quite a bit.
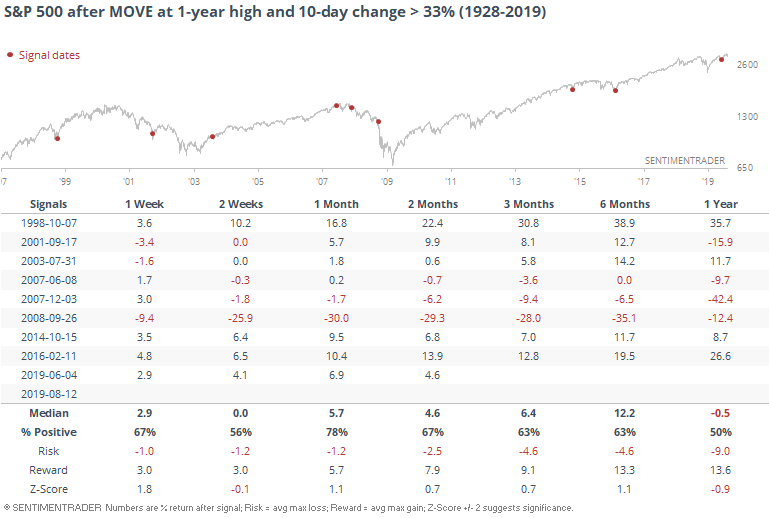
That warning in 2008 was helpful, but other than that, mostly signs of panic that were quickly relieved.
Returns on bonds weren't terrible (beyond the first couple of weeks) because the spike in volatility sometimes triggered when bonds were rising, and sometimes when they were falling in price.
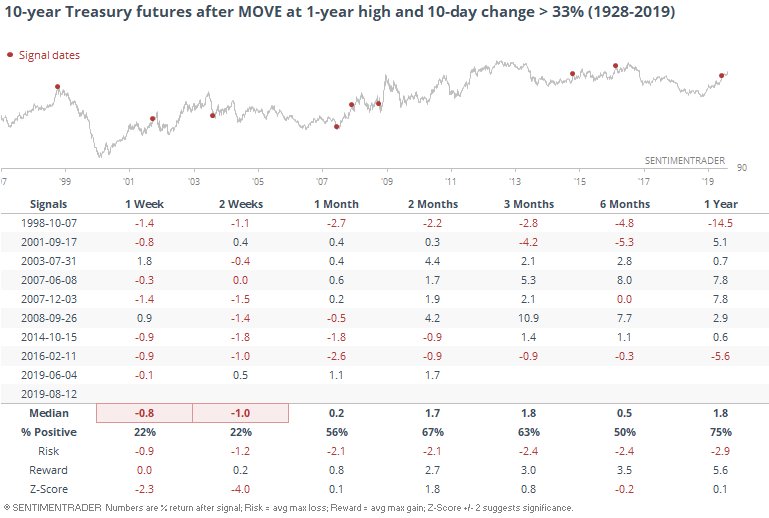
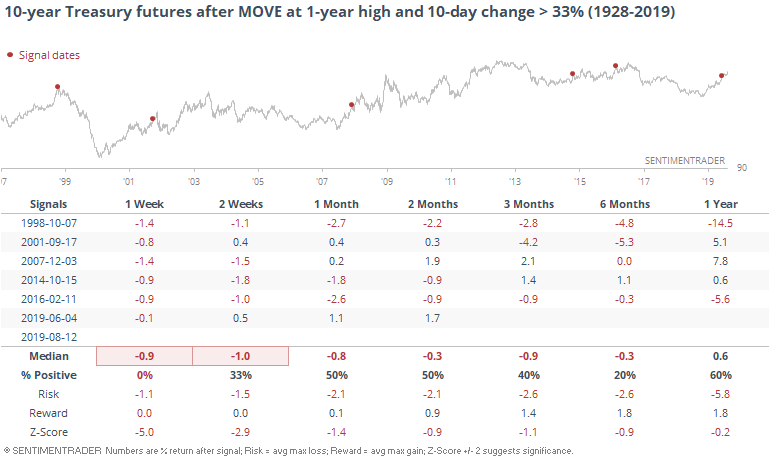
It's not a big surprise, then, that returns drop when we filter out the signals to only those times when MOVE spiked because of a rise in bond prices.
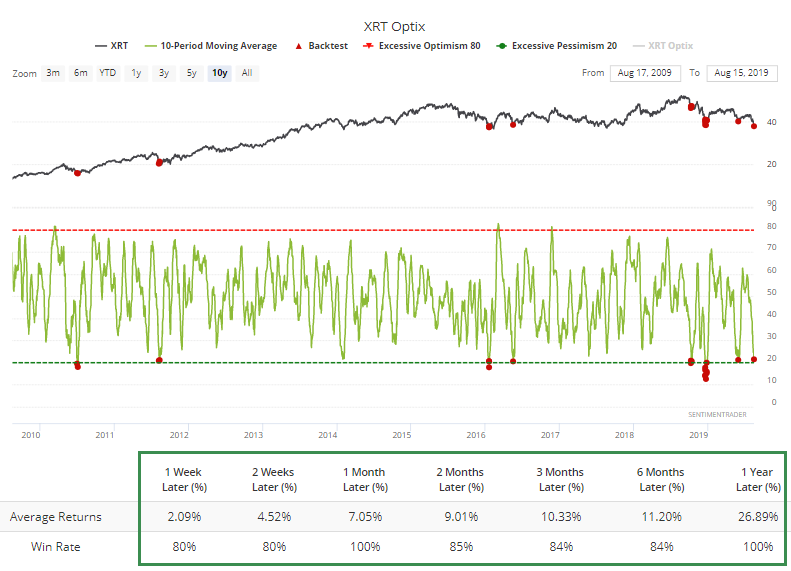
Retailing
The Heatmap shows that the most-hated ETF has become the retail-focused XRT fund as retailers got slammed. The 10-day average of the Optimism Index for XRT dropped below 21.5.
Since the financial crisis, this has been a sign of a true extreme (click here for the backtest).
Sector Breadth
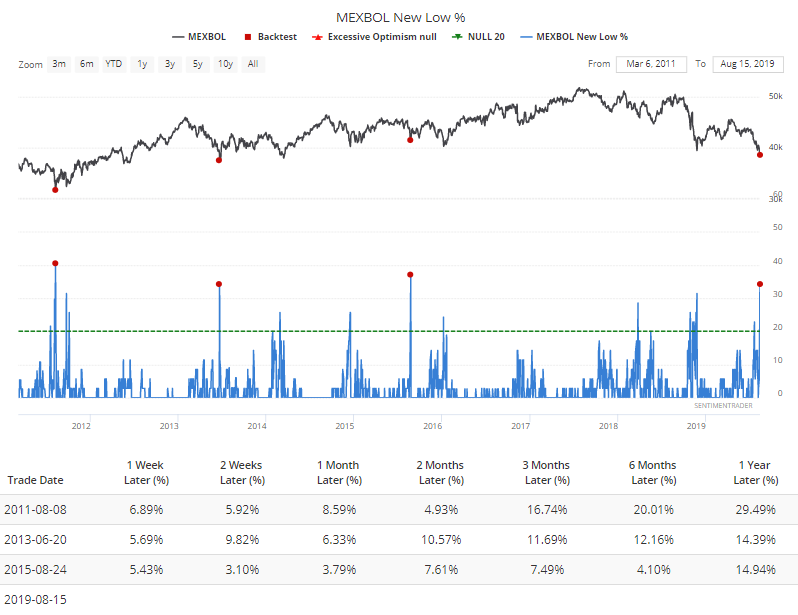
Yesterday, we saw that there was a spike of 52-week lows in the Mexbol index of Mexican stocks. Even more hit a low yesterday, and while that didn't quite equate to maximum pessimism during the financial crisis, it has in the 3 signals since.
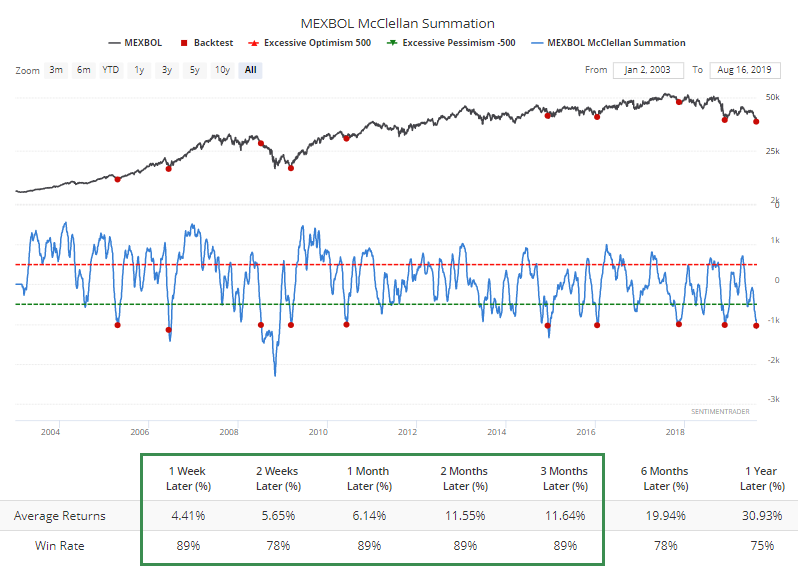
The downward pressure in that market has been so great, and so persistent, that its McClellan Summation Index has dropped below -1000. That was just the tip of the iceberg in early 2007, but according to the backtest, every other signal preceded a rally.
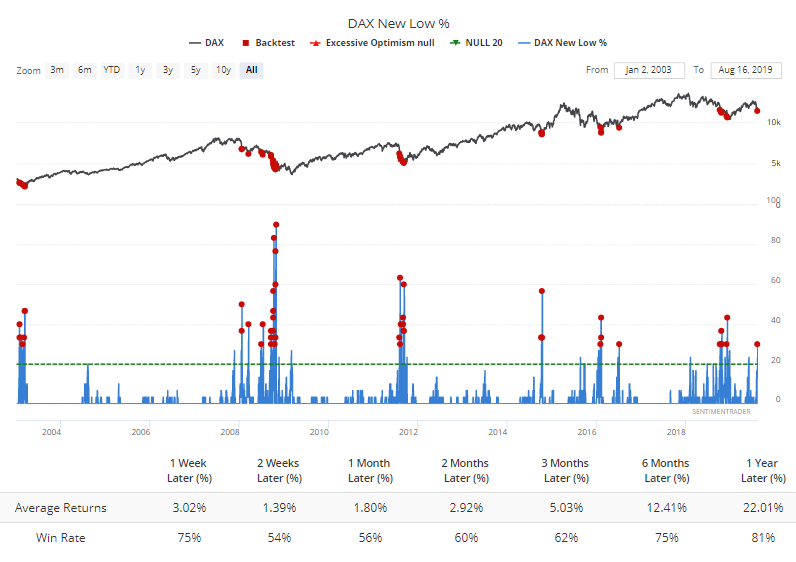
Among some developed markets, there have also been some cracks. Nearly a third of stocks in the German DAX just hit a new low. That has climbed above 40% at the worst levels, or even 60% at bear market lows, but it's still relatively extreme.