
Fund Flows - March

Anyone watching fund flows in recent weeks or seen the blurbs in the Daily Report would know that investors have been moving into emerging markets and out of some commodity funds.
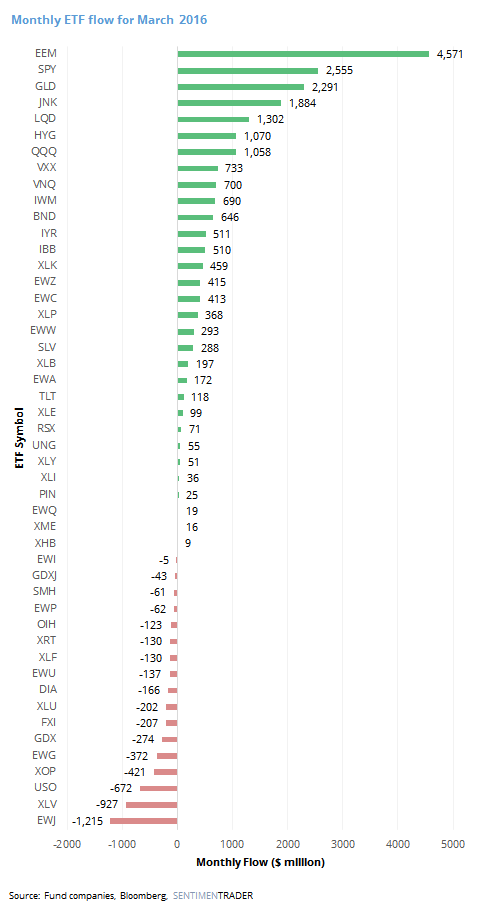
Preliminary totals for March are in and confirm what the weekly readings have been suggesting. For the month, EEM took in $4.5 billion, its 2nd-highest monthly intake since at least 2004. Only December 2012 was higher with an inflow of $5.2 billion.
Gold was a big winner on the month, resulting in an inflow of $2.2 billion to GLD. Bond funds took in a lot of assets as well, with JNK, LQD and HYG all taking in more than $1 billion.
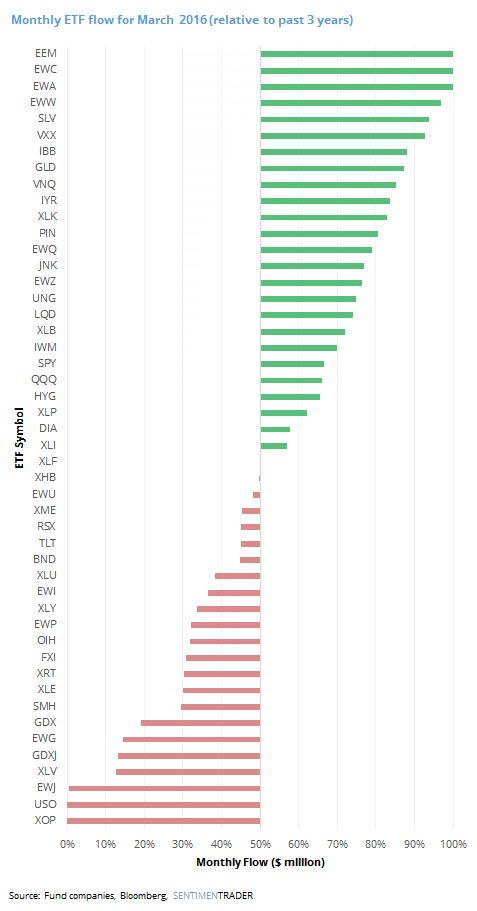
The following chart shows the monthly flows as a percentage of their 3-year range. We can see that EEM, EWC (Canada) and EWA (Australia) all took in their most assets in at least 3 years in March. Losers were EWJ (Japan), USO (Oil) and XOP (Oil Services), which suffered their worst outflows or lowest inflows in at least 3 years.
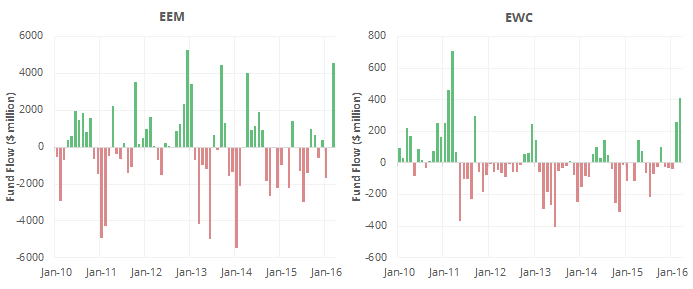
The top two funds relative to their 3-year range are shown below.
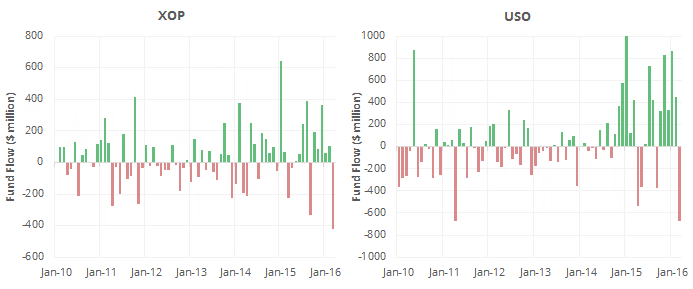
And the bottom two.
Fund flows are a little tricky to use with some funds because shares can be created for shorting purposes and do not strictly reflect buying demand. But for the most part, we consider flows to be a contrary indicator when they reach an extreme, suggesting some caution for the funds with largest inflows and a chance to search for bottoming action in the funds with largest outflows.