
Fund managers think tech is crowded to a record degree

A new bull market has begun.
At least, that's the take from the latest results of the monthly Global Fund Manager Survey conducted by Bank of America. The survey of more than 200 asset managers, with nearly $650 billion under management, reflects views through September 10.
Since a new bull market has begun and technology stocks are leading the charge, it makes sense that the managers are the most overweight that sector.
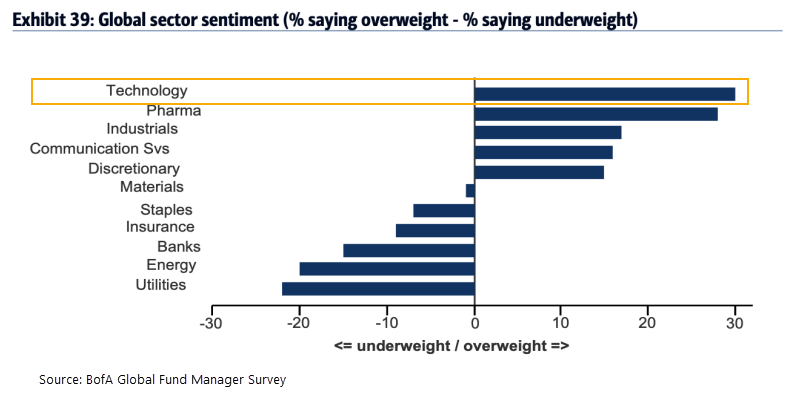
And yet despite being the most overweight in that sector, the managers also believe it's the most crowded trade. They're heavily overweight, more than any other sector or asset...and so is everyone else.
According to Michael Hartnett, Chief Investment Strategist at BofA Securities, if you're long technology stocks in the U.S. then you're a part of the most “crowded trade” of all-time. Managers believe that a tech bubble is the second-biggest tail risk this month, outweighed by a Covid-19 second wave. Volatility surrounding the U.S. presidential election was in 3rd place among concerns.
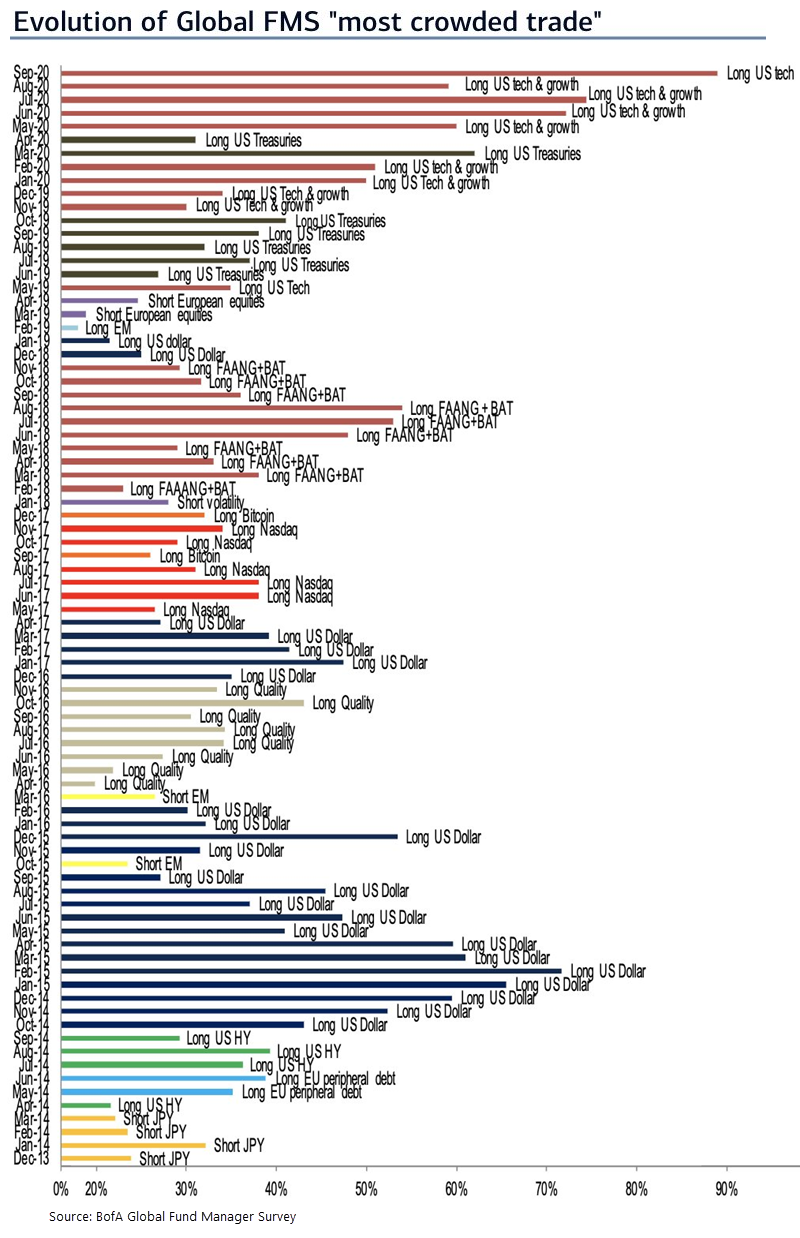
Below, we can see just how extreme this is relative to other "most crowded" trades over the past 7 years.
This is where we get to the "So what?" question that we try to answer every time one of our indicators reaches a notable extreme, there is a remarkable market development, or something gets a lot of attention in the media.
The question with this survey, especially the most crowded trade, is "Should we fade the crowd?"
We've gone back and computed the returns for each of the assets noted in the "most crowded" table above. Because we're assuming that we should trade against wherever the trade is most crowded, we'll short the asset if the crowd is long, and we'll go long if the crowd is short.
For example, if the most crowded trade is short the Japanese yen (relative to the U.S. dollar), then we'll be contrarians and go long the yen. If the crowd has rushed into FANG stocks, then we'll be reckless and sell them short. The table below shows the results of these trades based on various hold times.
If the returns are positive, then it might be a good idea to fade the herd. If not, then following the momentum would be a better strategy.
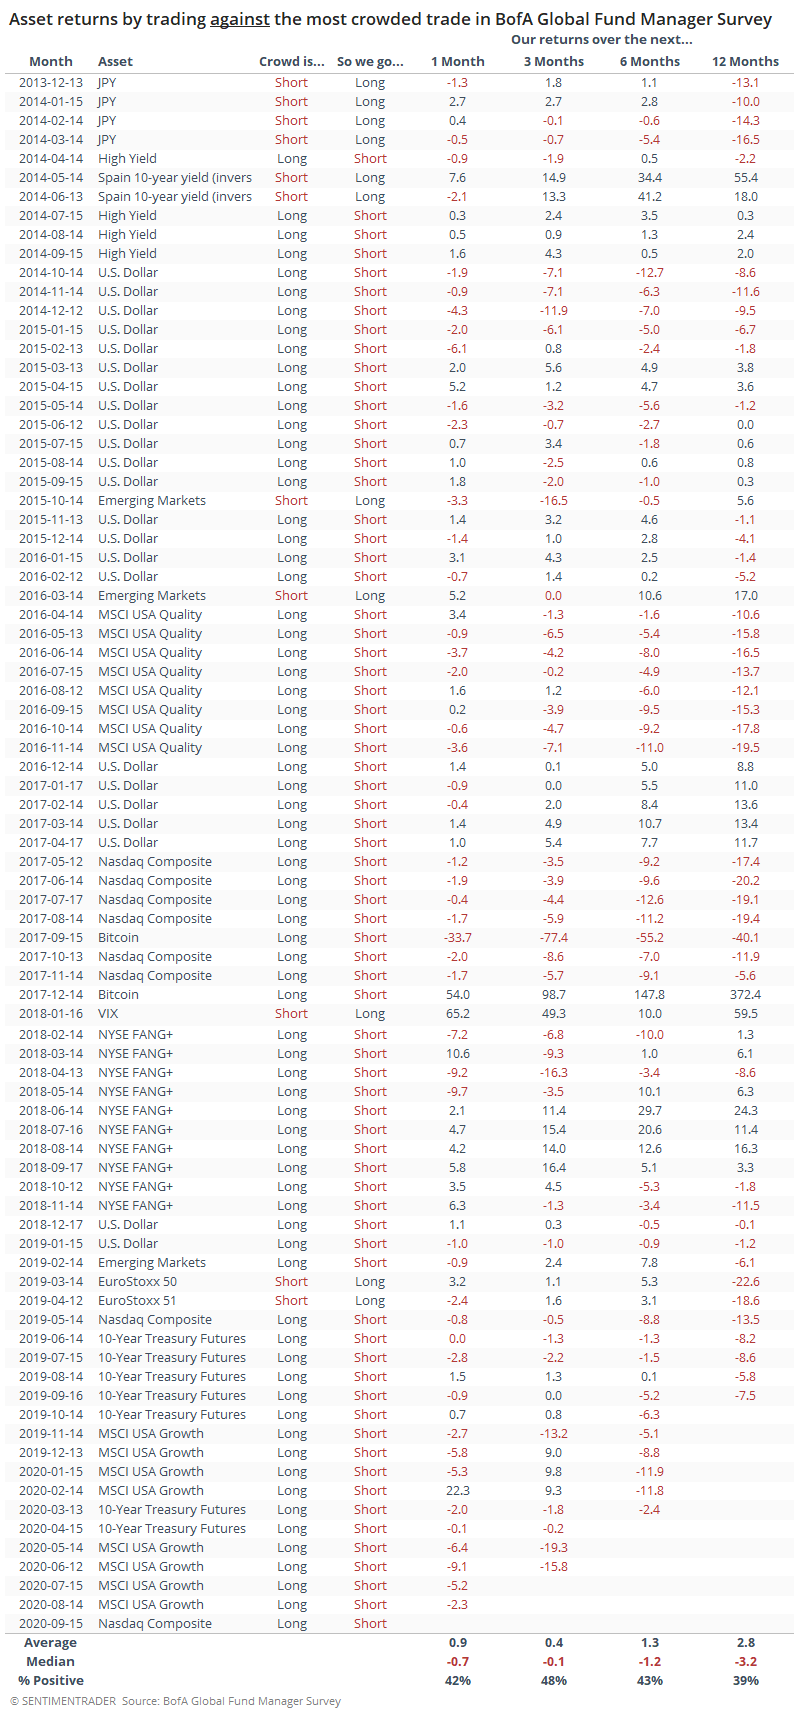 Overall, it was not a very successful contrary indicator. While these managers did tend to do a good job of determining what was driving most investors each month, that didn't necessarily mean the trends were about to end.
If you bet against the most-crowded asset or sector each month and held on until the next month, then you would have won only 42% of the time. The average trade was positive, but the median was negative, meaning that there were some big positive outliers that impacted the overall average - thanks to our short in Bitcoin near the peak and going long the VIX the next month.
These returns are theoretical only, for example, it would have been hard to get a return of more than 100% by shorting Bitcoin. The idea isn't necessarily to create a trading strategy, rather it's to get a general sense of whether we should use this widely-cited data as a reason to fade the crowd or otherwise adjust our positions.
The bottom line is that these managers are likely correct in that the most-crowded trade right now is tech stocks. There is a modest chance that it's so crowded, tech is likely to fall. But based solely on this survey's success at identifying too-crowded trades, we wouldn't use it in isolation to sell these stocks.