
Hang Seng is Nearing a Historic Washout

Fear that debt troubles with China's Evergrande would spread globally was the most common excuse for Monday's slide. Using it as a reason for drops in the U.S. is questionable, but the closer you get geographically, the more sense it makes.
Stocks in Hong Kong certainly have been feeling that pressure, thanks in part to a plunge in property developers and related companies.
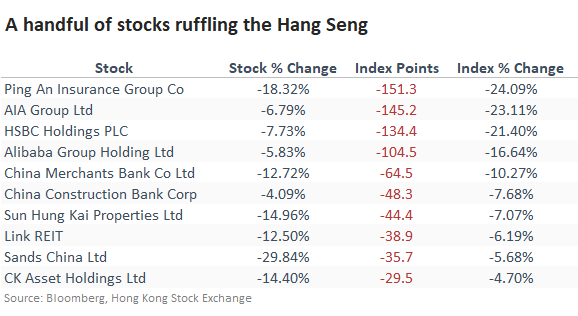
According to Bloomberg calculations, the five stocks with the most significant losses accounted for 600 of the Hang Seng's 628-point loss over the past month.
SELLING PRESSURE NEARING HISTORIC LEVELS
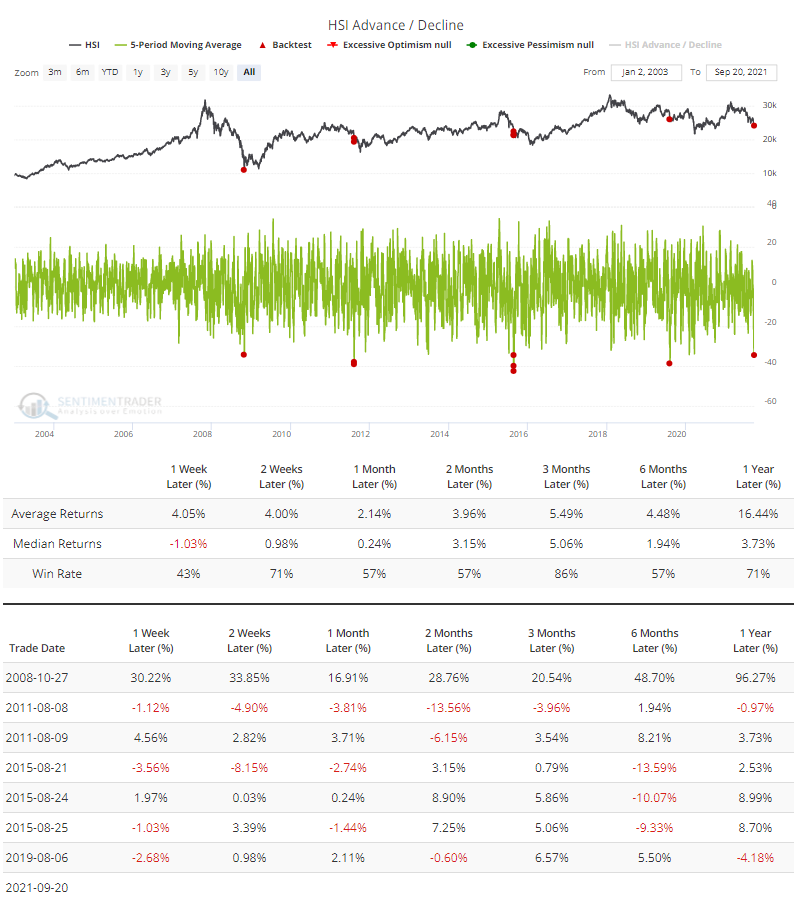
Over 5 days into Monday, an average of more than 34 stocks in the index declined versus advanced, one of the most extreme readings in nearly 20 years. The Backtest Engine shows mostly positive returns after the others. The index continued to slide for a couple more months in August 2011, then reversed those losses in the months ahead.
Internal weakness has been so severe that it helped push the McClellan Oscillator for the Hang Seng to one of its most extreme oversold readings of the past year.
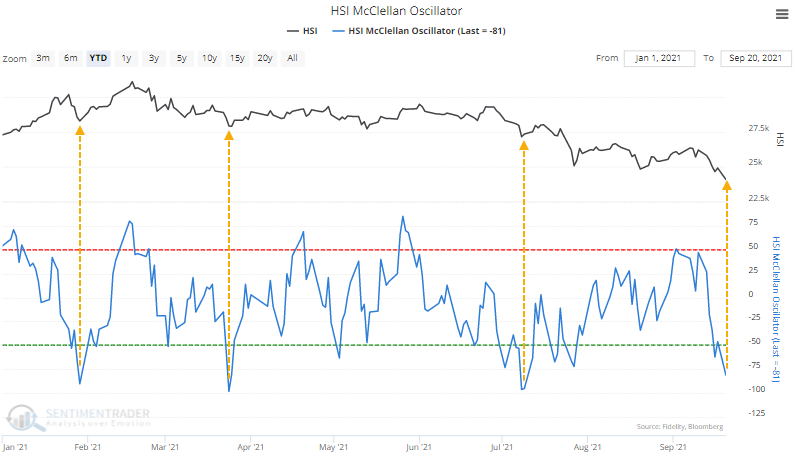
The other three instances all resulted in an immediate rally. The last one, in July, was short-lived, and the index soon rolled over to a lower low. That will be something to watch for this time around.
SIGNS OF PANIC
In prior years, we've looked at a breadth composite when a particular market looks like it's suffering panic-level selling pressure (like Mexico and South Korea in 2019). This composite includes nine breadth metrics that have a good record at highlighting overwhelming internal selling pressure.
- % of stocks above 10-day average
- % of stocks above 50-day average
- % of stocks above 200-day average
- % of stocks at 1-month low
- % of stocks at 3-month low
- % of stocks at 1-year low
- % of stocks below Bollinger Band
- % of stocks with oversold RSI
- McClellan Oscillator
The chart below shows this composite along with its recent record.
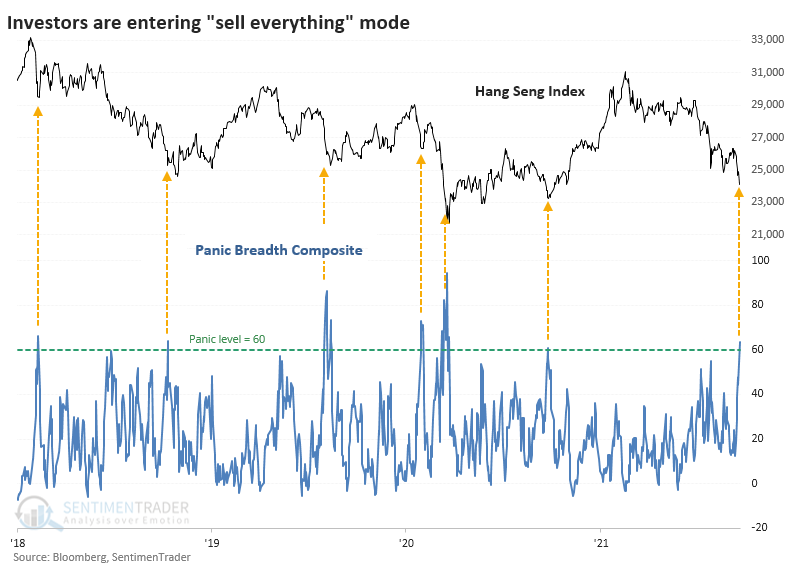
It was a decent medium-term sign with returns above random across most time frames, consistent gains, and more reward than risk. It wasn't outstanding, though, as there were several large losers. The sweet spot, as we so often see, was over the next 1-3 months.
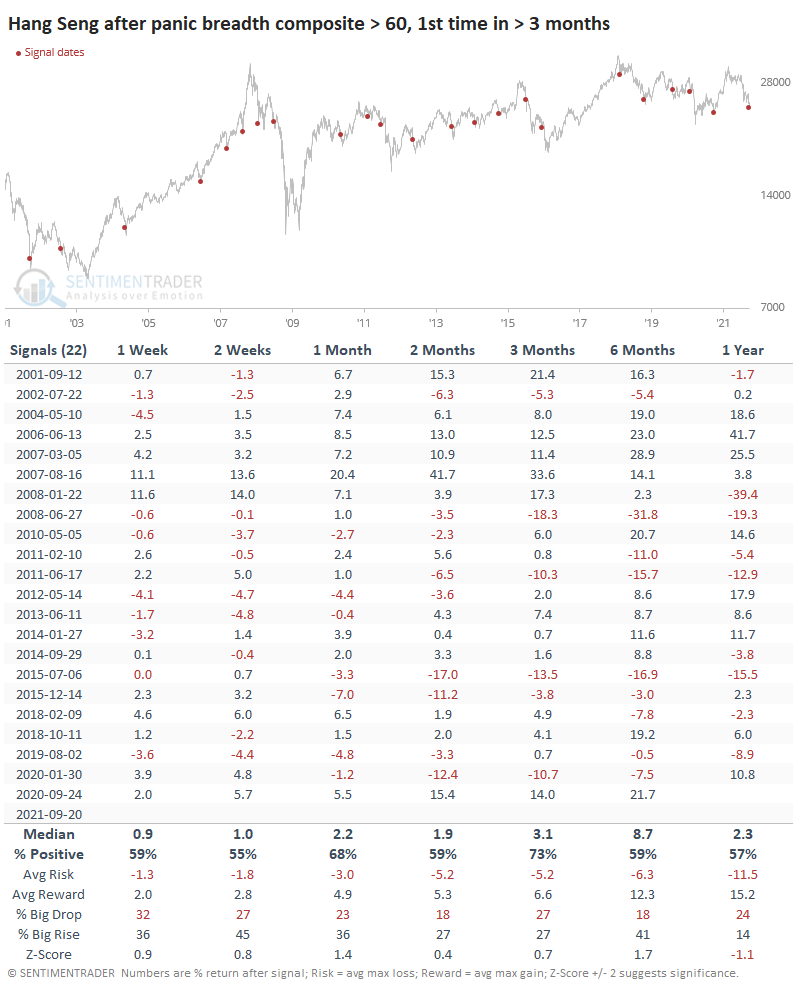
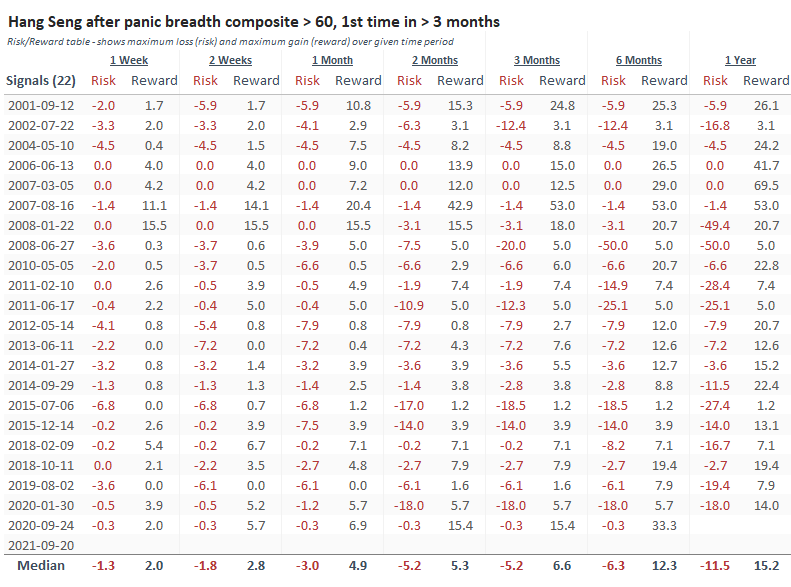
Successful signals didn't see more than an 8% drawdown during the next six months, and most of those were under 5%. The handful of failures didn't see any more significant rallies than about 5% before cratering.
China's steps with property developers in the coming weeks will likely have the most impact on these stocks and even the broader Hang Seng index. Even after selling pressure like the past month, the index hasn't yet suffered full-out puke conditions, but it's getting close.
Internal selling has been significant enough to consider it heavily oversold, which typically means a multi-month rebound. Bulls will need to watch the risk/reward in the coming weeks, with anything further than a 5% slide ushering in some unpleasant precedents and anything more than a 5% rally suggesting the worst is likely past.