Hard Economic Releases Have Been Uber Disappointing

When economic releases beat economists' expectations, they raise their forecasts for the next releases. Like investors, economists suffer terribly (in aggregate) from recency bias.
And recently, that bias has been ugly. Hard economic releases covering topics like labor conditions, housing, and industrial performance, have missed expectations by an average of 22%. It's been more than a year since the gauges of the "real" economy have disappointed by so much.
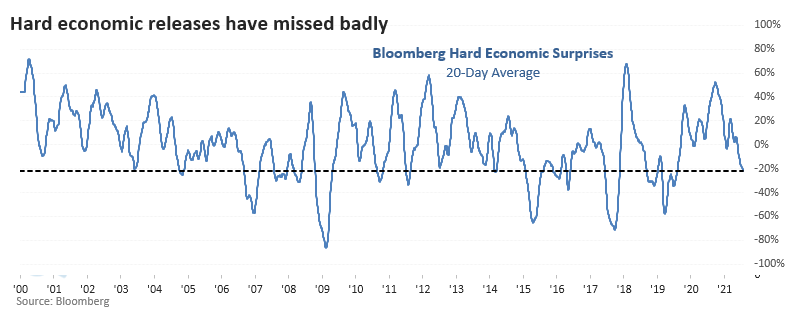
The 20-day average of Bloomberg's real economic surprises has eclipsed -22% for the first time in well over a year. This ends the 3rd-longest streak of "not really bad" surprises in over 20 years.
Despite a string of disappointing economic news, the S&P 500 tended to hold together. There were a couple of larger interim losses, but otherwise, stocks gained by at least a modest amount in the months ahead.
We might expect such soft performance in economic indicators to lead to a bump in bond prices (lower yields), but we would be wrong. The opposite was more the rule than the exception. Prices on 10-year Treasury futures showed a loss every time sometime between 2-4 weeks later.

What else we're looking at
- Returns in the S&P 500, Treasury futures, the dollar, and gold following negative real economic surprises
- How sectors and factors reacted to negative surprises
- What the next 3 months have often shown for a particular auto stock
- An update on absolute and relative trends in sector, industry, and country ETFs
| Stat box Due to Monday's reversal, there were 37 stocks in the S&P 500 with a buying climax, where they set a 52-week high then closed below the prior day's close. That's the 5th-highest number of climaxes of any day in the past year. |
Etcetera
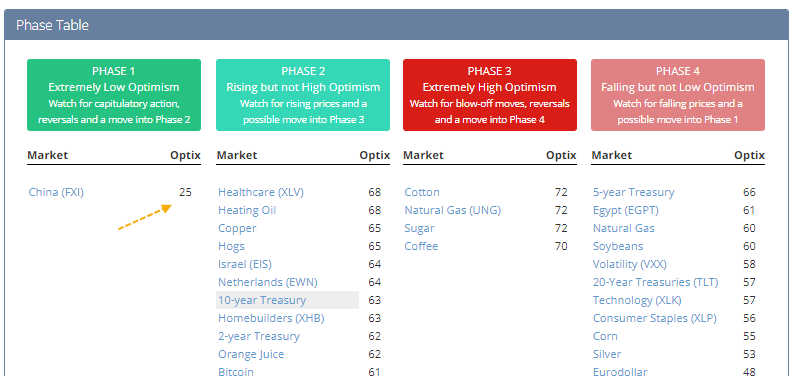
Un-phased. Our Phase Table shows only a single fund in Phase 1, where the 10-day average Optimism Index is in deeply pessimistic territory. That's for the FXI China Fund, which is now starting to curl higher.
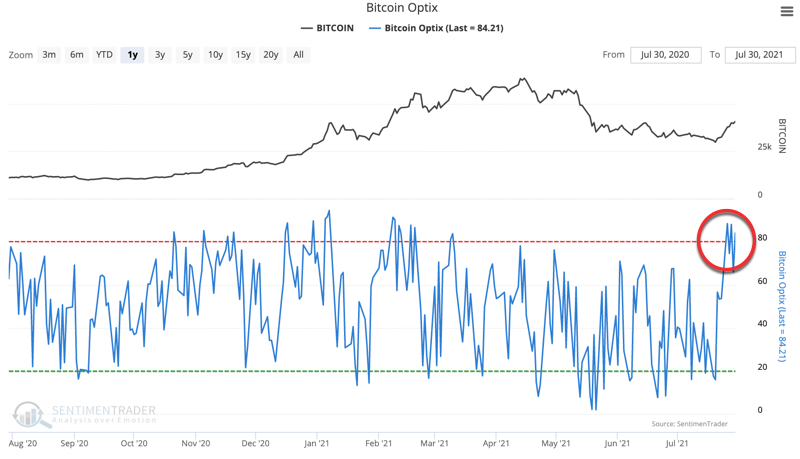
To the moon? The Bitcoin Optimism Index is refusing to decline, sticking around the 80 threshold for the past week. The 5-day average hit its highest level since February.
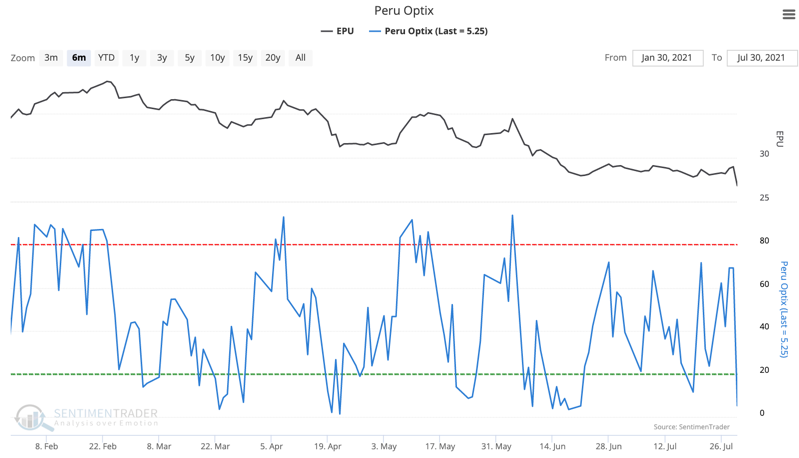
Decline. The Peru Optimism Index dropped dramatically, plunging to less than 5.5%. In the history of the EPU fund, the Backtest Engine shows there were 58 days with a reading this low or lower, leading to a positive return over the next month 67% of the time.