
Have a Nice Week(?)

In this article last week, I wrote about a little know seasonal anomaly that "hides in plain sight." In this piece, we will focus solely on this anomaly during the month of September.
THE DAYS
As I detailed last week:
- The last trading day of the month is designated as TDM -1
- The next to last trading day is TDM -2
- The day before that is TM -3
- Etc.
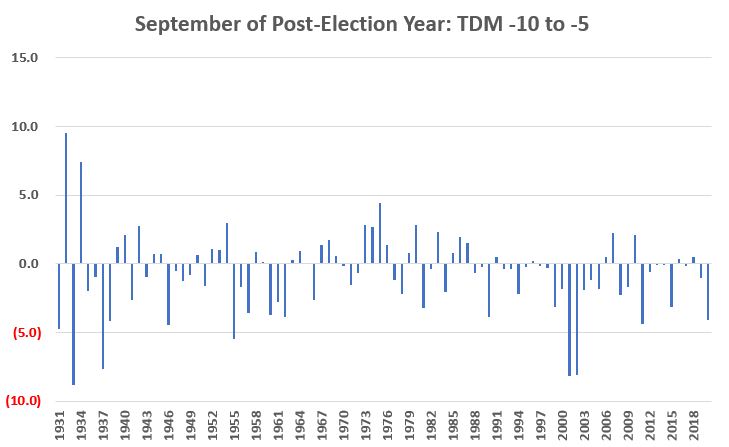
The period we are focusing on includes TDM -10 through TDM -5. The chart below displays:
- The percentage + (-) price change for the S&P 500
- During this 6-trading day period
- ONLY during the month of September
- Since 1931
Things to Note:
- # of times UP = 35
- # of times DOWN = 54
- # times Unchanged = 1
- Ave UP = +1.83%
- Ave DOWN = (-2.36%)
- # of UPs +4% or more = 3
- # of DOWN -4% or more = 10
If your first inkling is that these results are not too good, you are correct. The chart below displays the cumulative % price gain/loss for the S&P 500 Index if held long ONLY during this 6-trading day period every year since 1931.
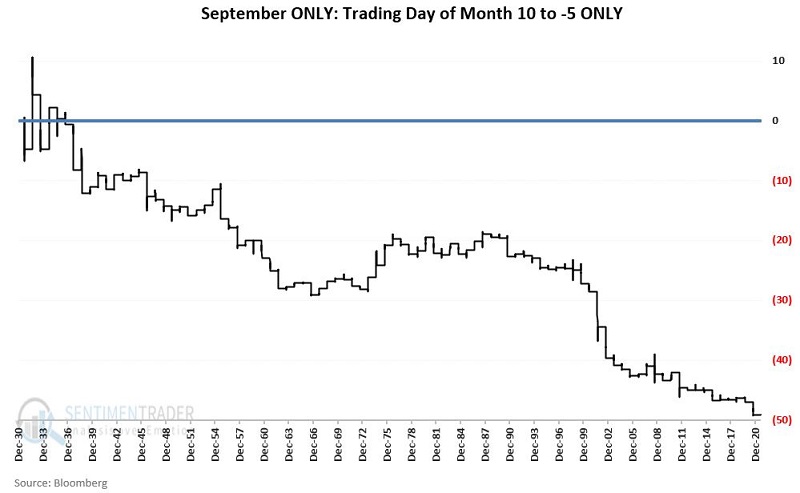
The cumulative loss through 2020 is -49.2%.
SEPTEMBER OF POST-ELECTION YEARS ONLY
Let's now focus solely on performance during post-election years (1933, 1937, 1941, etc.) to drill a little deeper.
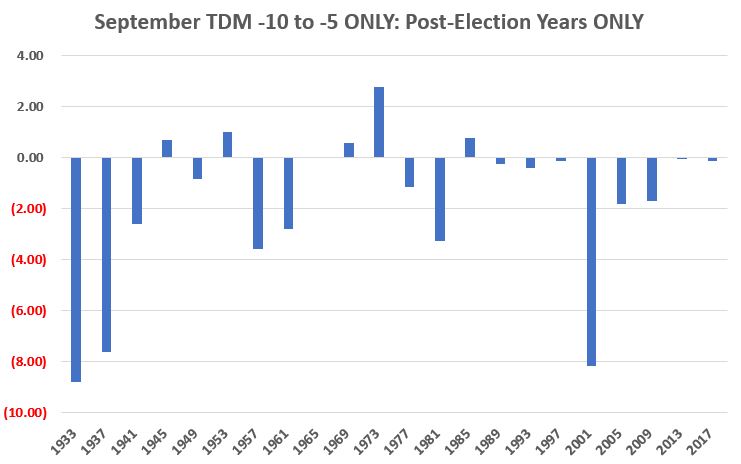
The chart below displays:
- The percentage + (-) price change for the S&P 500
- During this 6-trading day period
- ONLY during September within Post Presidential Election years
- Since 1931
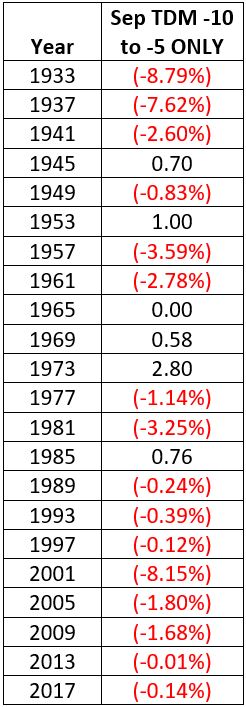
The table below displays the results from the chart above in numerical format.
Finally, the chart below displays the cumulative % price gain/loss for the S&P 500 Index if held long:
- ONLY during this 6-trading day period
- ONLY during September
- ONLY within post-election years
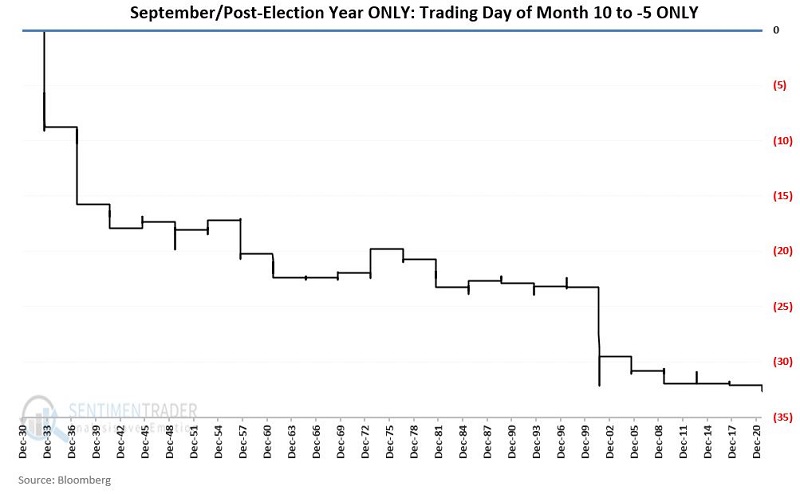
Things to Note:
- # of times UP = 5
- # of times DOWN = 16
- # times Unchanged
- Ave UP = +1.17%
- Ave DOWN = (-2.70%)
- Max % UP = +2.80% (1973)
- Max % DOWN = (-8.79%) (1933)
2021
2021 is a post-election year. During September of 2021, this seasonally unfavorable period extends:
- From the close on Thursday 9/16
- Through the close on Friday 9/24
SUMMARY
Since 1931 there have been 22 post-elections years. During our 6-day unfavorable period within the month of September during those 22 years, the S&P 500 Index has managed a gain only five times (23%).
Does this mean that the stock market is doomed to decline this week? Not at all. The stock market has shown historical resilience in 2021, and the most recent dip could easily be just another "buy the dip" opportunity.
That said, it is interesting to note that a period of seasonal weakness on the Annual Seasonal Trend chart for the S&P 500 Index below is just beginning.
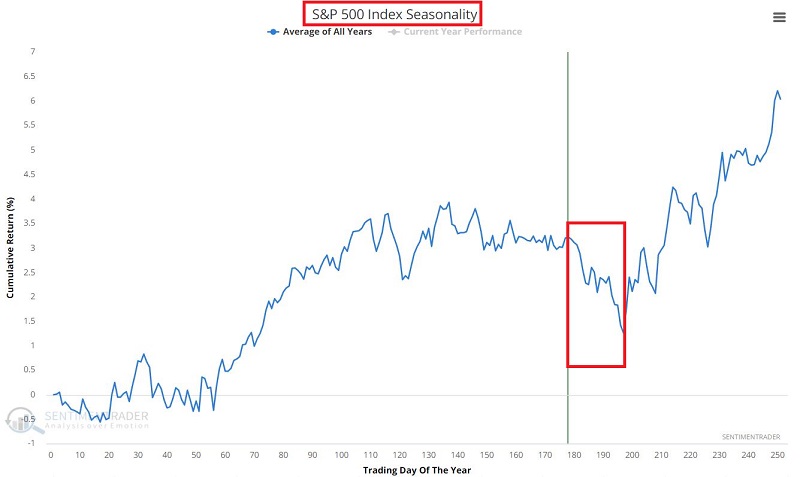
All-in-all, traders ought to be prepared for anything in the near term.