
Heavy selling in high-yield

Bonds of all stripes had been getting hit in recent weeks, and the stress is starting to show in some of the measures we follow for the high-yield corner of the market.
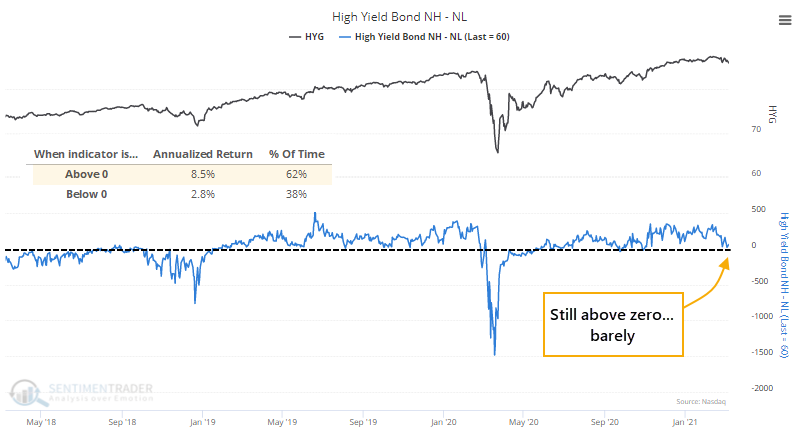
One of the primary ways to determine the internal health of the junk bond market is simply whether more bonds are hitting 52-week highs or lows. A net New High - New Low reading above zero is good; below zero is bad. It's still good for now but has been flirting with that zero line.
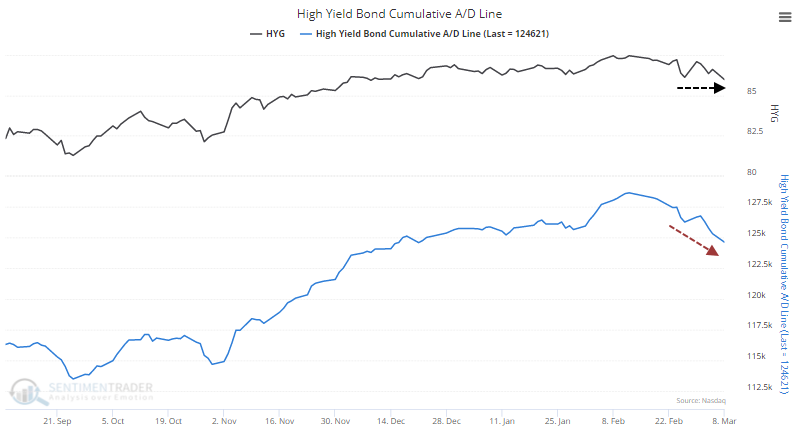
This is partially because more bonds have been declining than rallying. The Cumulative Advance/Decline Line has dropped quite a bit more below its recent low than have indexes and funds like HYG.
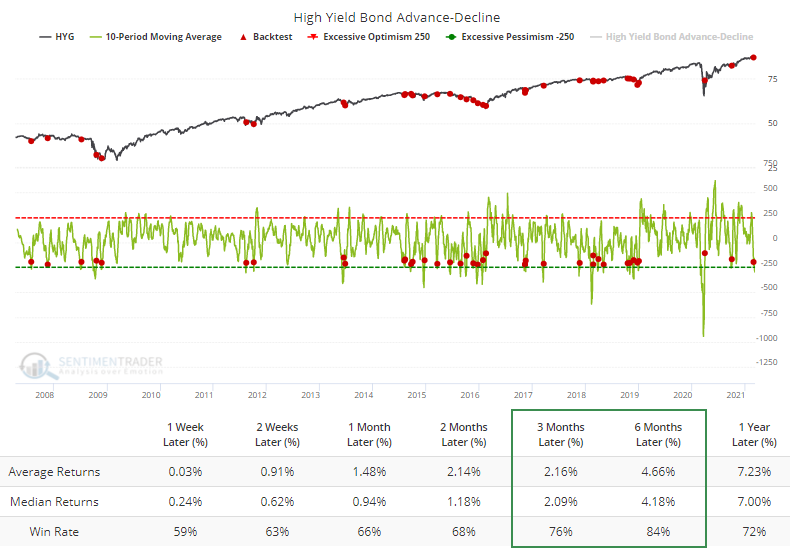
In fact, a lot more bonds have been declining than advancing over the past 10 days. On an average day, nearly 300 more bonds have dropped than rallied. When the 10-day average drops to a low level and then reverses, the Backtest Engine shows mostly positive returns going forward. To run this test, premium users can click here and then the Run Backtest button. Click the Multi-Timeframe Results tab to see returns across various time periods.
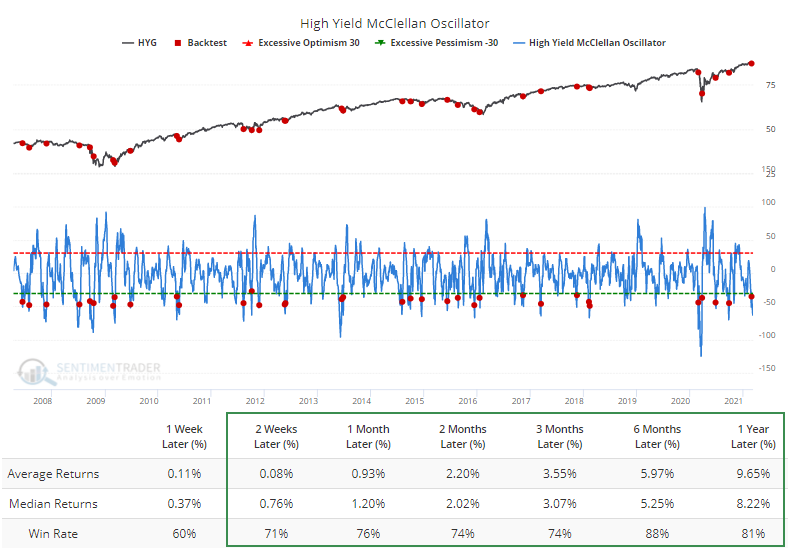
This internal selling pressure has pushed the McClellan Oscillator for high-yield bonds down to a very oversold level. Again, when this reverses up from a low level, the Backtest Engine shows that HYG has typically rallied further.
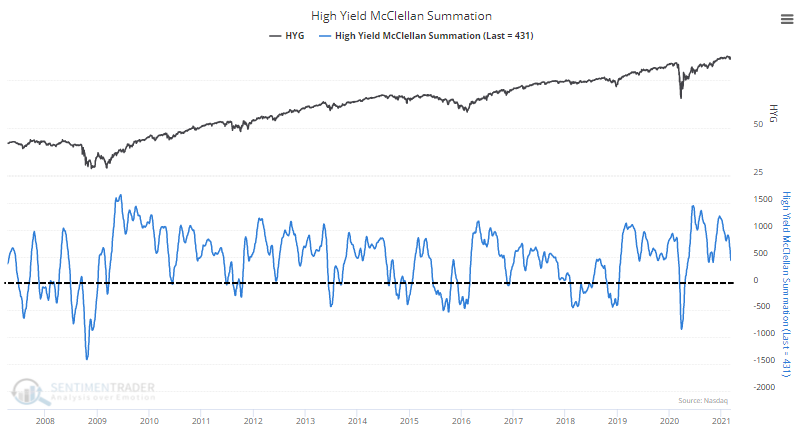
The persistently low Oscillator has caused the longer-term Summation Index to drop significantly from its highs. That shows weakening momentum, but it's still heavily positive. When this is below zero and declining, then it's more of a worry.
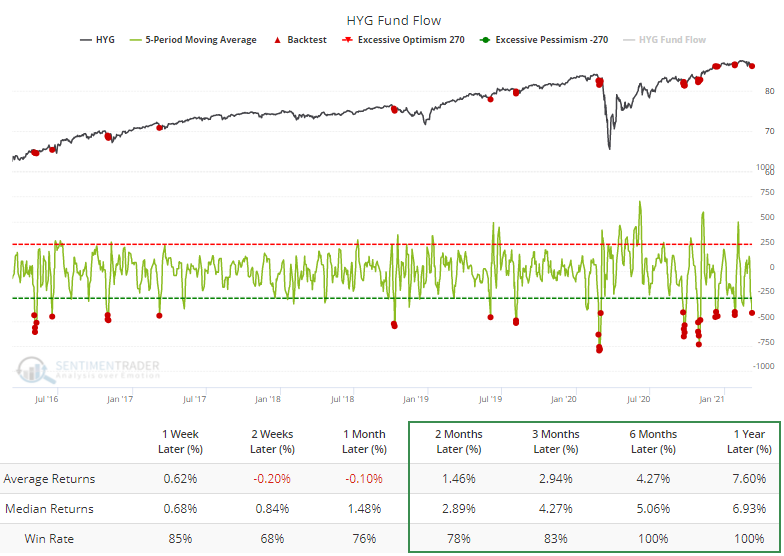
ETF traders aren't waiting around to see if there is a reversal. Over the past week, they've pulled an average of more than $400 million per day from the HYG fund. Such negative fund flows have preceded positive returns.
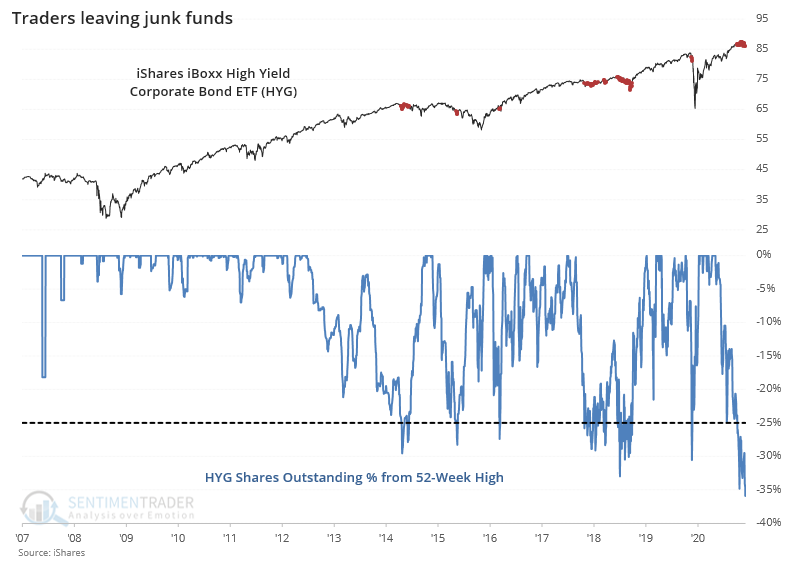
Those outflows have caused the shares outstanding to crater by more than 35%, the most that the fund has ever contracted. Other times when shares outstanding dropped by more than 25%, the share count bottomed out.
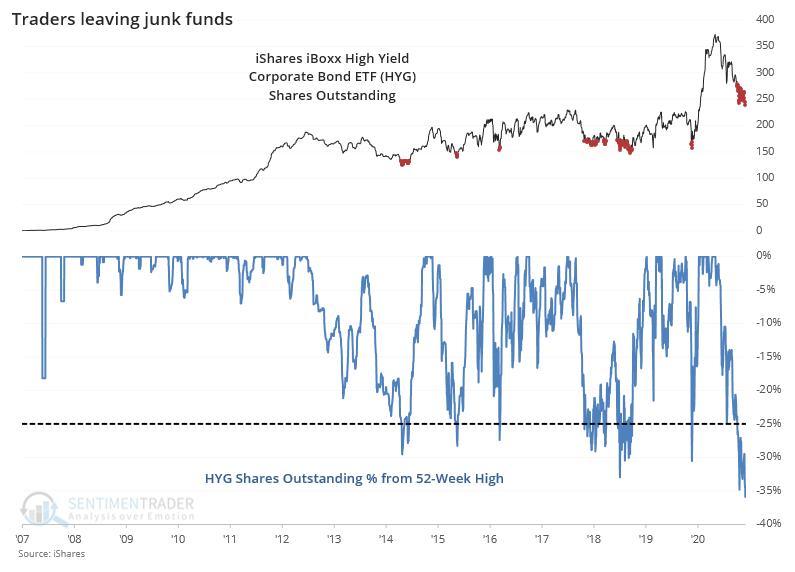
Shares can be created for either buying or selling, and redeemed for similar reasons, so a contraction in the share count was not necessarily a sign that there was too much pessimism.
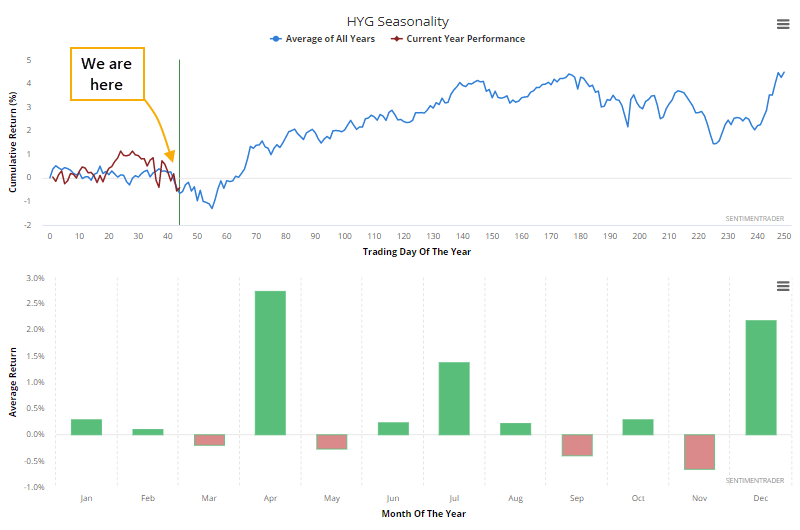
These traders may be leaving at an inopportune time, at least according to the calendar. The seasonal pattern for HYG shows a turn during March, with April being its most positive month.
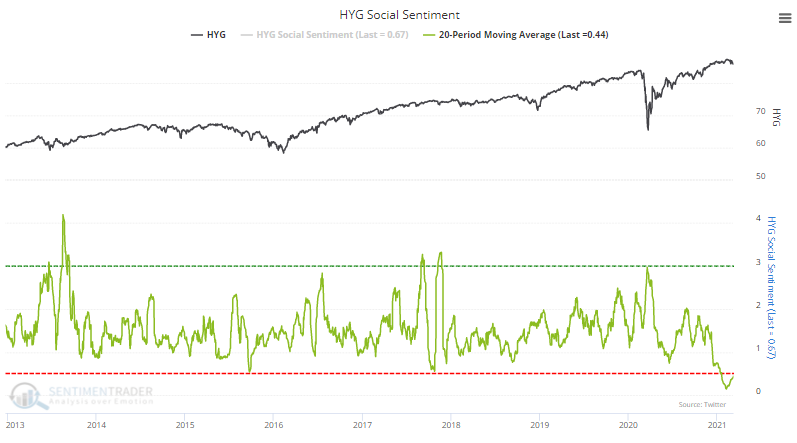
Another curious outlier is that Social Sentiment on HYG is still very positive. Using machine learning that Eric pioneered during his doctorate work, Social Sentiment works like a put/call ratio - the higher the indicator, the more that Twitter users are showing pessimism toward HYG. Currently, it's very low, suggesting that social media users are looking to buy the dip. This isn't a great sign, as it has been better as a contrary indicator.
Not all the factors are aligned, but there is a modestly positive suggestion for high-yield bonds, given what is still longer-term health, with shorter-term oversold conditions, heading into a seasonal tailwind. If funds like HYG don't respond well to these conditions, then it's a sign that the larger trend is likely changing for the worse. Continued deterioration in this market would trigger divergences with the stock market, and that has typically been a negative for stocks.