
Heavy Trucks Sales - Keep On Rolling

Most investors recognize a direct link between the state of the economy and the performance of the stock market. And a majority of investors understand and generally accept the link between things like unemployment, new home construction, new car sales, etc., and the state of the overall economy.
However, far fewer are aware of the usefulness of Heavy Truck Sales as a leading economic and stock market indicator. So, let's spell it out.
HOW TO MEASURE HEAVY TRUCK SALES (HTS)
Regarding Heavy Truck Sales:
- They are reported once a month and are quoted as a fraction of millions
- So, if 500,000 heavy trucks were sold in the latest month, the HTS data series would report a value of "0.50"
- HTS can be viewed and downloaded at this link
It will appear as in the chart below (NOTE: red lines added for emphasis).
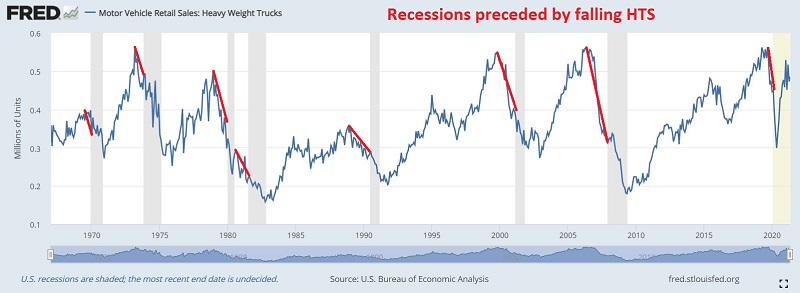
Things to note in the chart above:
- Economic recessions are highlighted in grey
- Note that NOT every decline in HTS precedes a recession, HOWEVER;
- Every recession has been preceded by weakness in HTS
So, our theory is this:
- If HTS is NOT declining, things should be good for the economy and, therefore, for stocks
- If HTS IS declining, it MAY be a problem for the economy and, therefore, for stocks
HOW TO QUANTIFY HEAVY TRUCK SALES AS RISING OR FALLING
HTS is a monthly data series that is typically reported during the last week of the month. The way I measure this indicator is described below.
At the end of each month:
- A = The latest available monthly reading for HTS
- B = The average reading for HTS over the latest 18 months
- C = A - B (i.e., current monthly value versus 18-month average of monthly readings)
- If C > 0, then this measure is deemed "favorable" for both the economy and the stock market
- If C <= 0, then this measure is deemed "unfavorable" for both the economy and the stock market
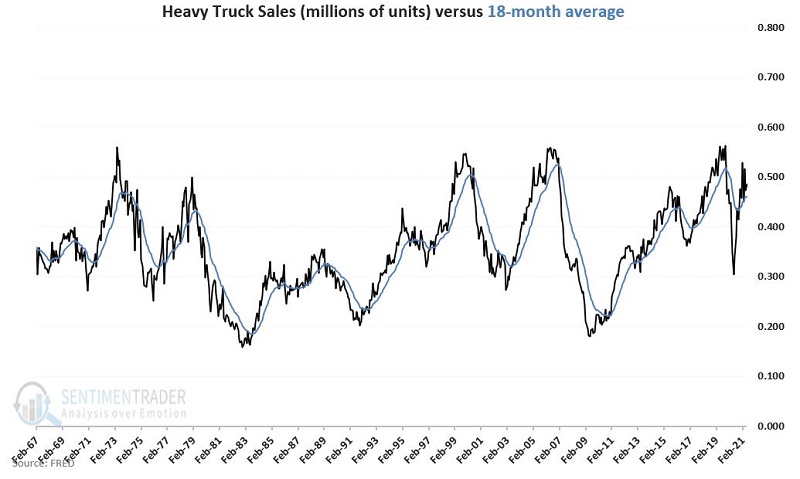
The chart below displays the monthly readings for HTS along with its 18-month moving average.
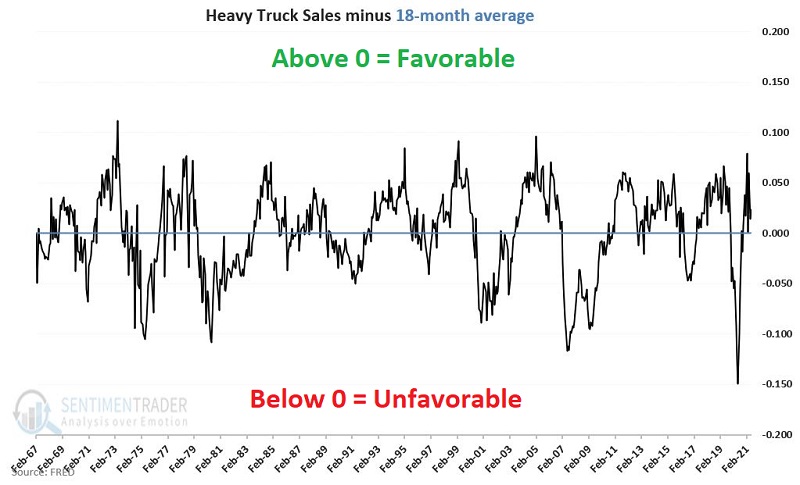
The chart below displays HTS minus its 18-month moving average (Value C from the calculations above).
- Readings above 0 mean HTS is ABOVE its 18-month average, i.e., "Favorable"
- Readings below 0 mean HTS is BELOW its 18-month average. i.e., "Unfavorable"
DO THE SIGNALS MATTER?
When Value C is above 0, we expect the economy and the stock market to perform well. When Value C is below 0, we expect that - at times - there will be trouble, and the results for the economy and the stock markets will not be as good. Does this theory hold up in reality?
To track the course of the economy, we will use the Coincident Economic Indicators (CEI) data series.
At the end of each month:
- We note the status of our HTS indicator
- We then note performance (% rise or fall) in CEI for the next month
The table below displays the monthly performance for CEI depending on whether our HTS indicator is above or below its 18-month average.
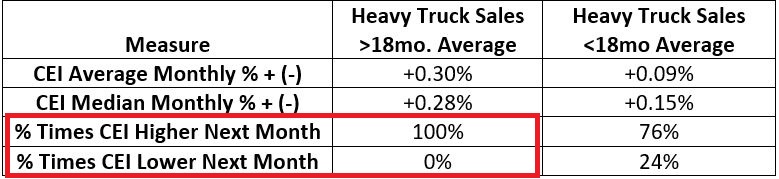
Key things to note in the table above:
- CEI performed significantly better when HTS > 18-month average (average +0.30% versus +0.09%)
- CEI has not experienced a monthly contraction when HTS > 18-month average
- A down-trending HTS indicator preceded all calendar months that witnessed a contraction in CEI
The implication: As long as Heavy Truck Sales are above their 18-month average, there has historically been almost no risk of a recession.
HEAVY TRUCK SALES VERSUS THE ECONOMY
The chart below displays the cumulative % +(-) for the Coincident Economic Indicators based on whether HTS is above or below its 18-month average at the end of the previous month,
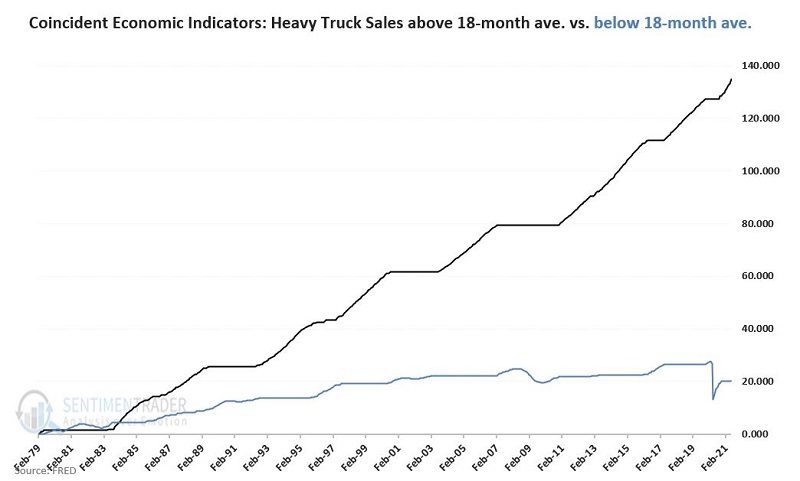
The key things to note:
- The black line displays no declines - i.e., when HTS is above its 18-month average, the economy continues to expand
- The overall economic gain when HTS is below its 18-month average (the blue line) is much more muted and contains economic downturns in 1982, 1990, 2002, 2008, and 2020
HEAVY TRUCK SALES VERSUS THE STOCK MARKET
Economic forecasts are all well and good, but the real issue for investors is being in the stock market at the right time.
The chart below displays the cumulative return for the S&P 500 Index when:
- HTS > 18-month average (black line)
- HTS < 18-month average (blue line)
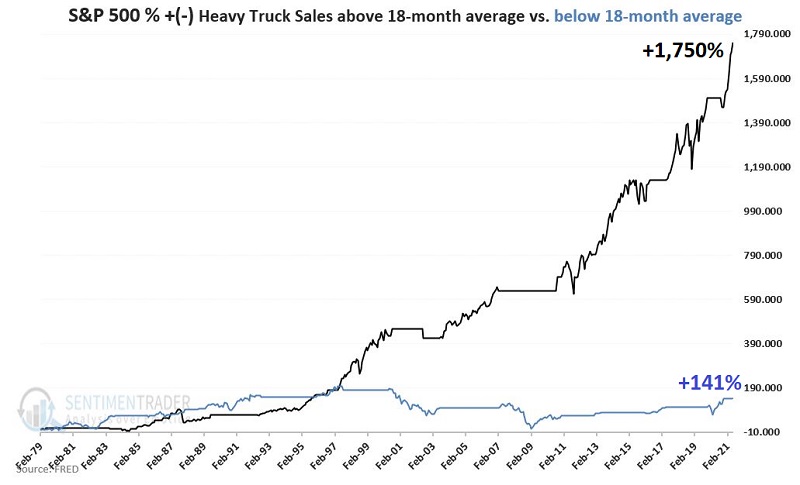
For the record:
- When HTS > 18-month average the S&P 500 Index gained +1,750%
- When HTS < 18-month average the S&P 500 Index gained +141%
SUMMARY
Here is what we discern from the information above.
When Heavy Truck Sales are above their 18-month average:
- The odds of a recession are exceedingly low
- The odds favor a rise in stocks prices
When Heavy Truck Sales are below their 18-month average:
- There is no guarantee that a recession will develop, however;
- The odds of a recession increase significantly
- There is no guarantee that a bear market in stocks will develop, however;
- The longer the downtrend in HTS persists - and the larger the decline - the greater the odds of a significant stock bear market
As of the end of June 2021:
- The current HTS value is 0.485
- The current 18-month average is 0.462
- This measure is currently rated as "Favorable"