
High Valuation Plus Inflation Typically Spells Trouble

Historically, periods of low price-to-earnings (P/E) ratios have been followed by generally higher stock prices and vice versa. Likewise, periods of moderate price inflation tend to be accompanied by rising stock prices, while periods of significant inflation or deflation tend to be accompanied by declining stock prices. See here.
What we have at the moment is the worst of both worlds - high P/E ratios AND high inflation. Let's take a closer look at what this may or may not mean for investors.
VALUATION AND INFLATION MEASURES
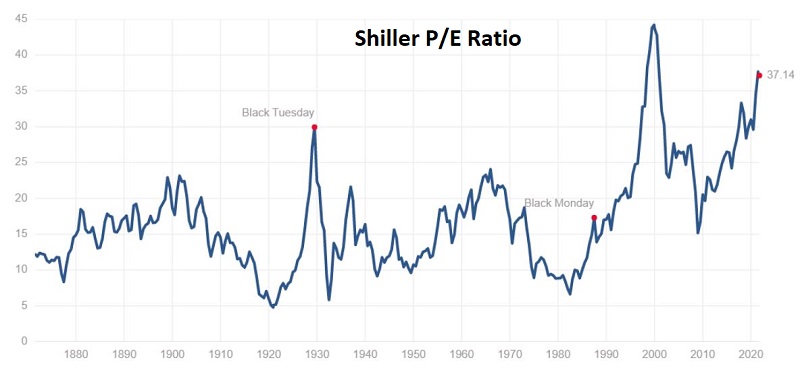
The chart below displays the Shiller P/E ratio as of 10/4/2021
The chart below displays the 12-month % change in the CPI at the end of September 2021.
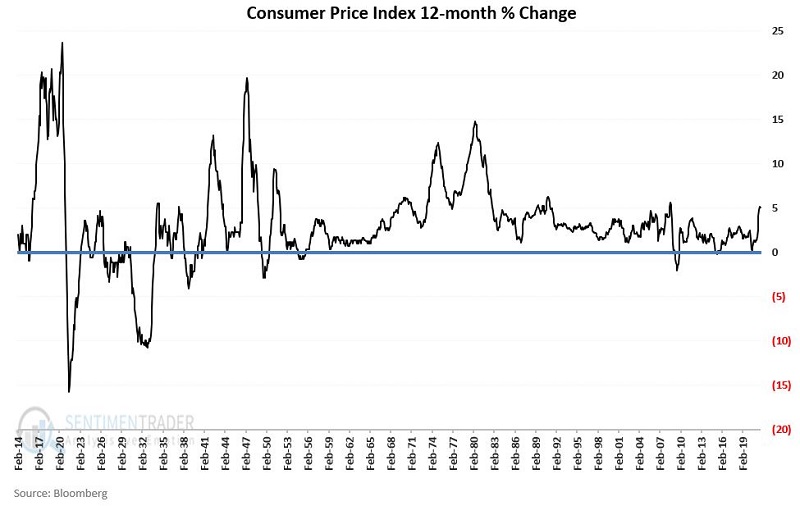
Note that the Shiller PE ratio recently reached its second-highest level ever and that CPI 12-month inflation is above 5%. Let's convert these indicators into a formula to identify "favorable" and "unfavorable" periods for stocks.
Variable "PE"
- Variable PE is simply the Shiller P/E ratio at the end of the current month
Variable "INF"
Variable INF is based on the premise that "moderate" inflation is "normal" and that anything else (high inflation or significant deflation) is "abnormal."
- CPI Inflation = 12-month % change in the Consumer Price Index raw value
So, I make the calculation below using the latest CPI data available at the end of each month.
If CPI Inflation is:
- Less than +4% AND greater than -4%
- THEN Variable INF = 1.00
If CPI Inflation is:
- Greater than or equal to +4% OR less than or equal to -4%
- THEN Variable INF = ABS (Variable B) + 1.00
NOTE: ABS stands for "absolute value," so whether Variable B is positive or negative, it is set to positive in the equation above.
Examples:
If CPI Inflation is +7.00% (i.e., if inflation over the past 12 months is up 7%), then:
- Variable INF = ABS (7.00) + 1.00 = 8.00
If CPI Inflation is -8.00% (i.e., if the CPI declined -8% in the past 12 months) then:
- Variable INF = ABS (-8.00) + 1.00 = 8.00 + 1.00 = 9.00
THE VALUATION:INFLATION (VI) INDICATOR
The VI is calculated at the end of each month by multiplying Variable PE by Variable INF using the following formula:
- VI = (Variable PE x Variable INF)
Note that anytime CPI inflation is between -4% and +4%:
- Variable INF will be equal to 1.00
- So, the VI will be equal to the Shiller PE Ratio (Variable PE)
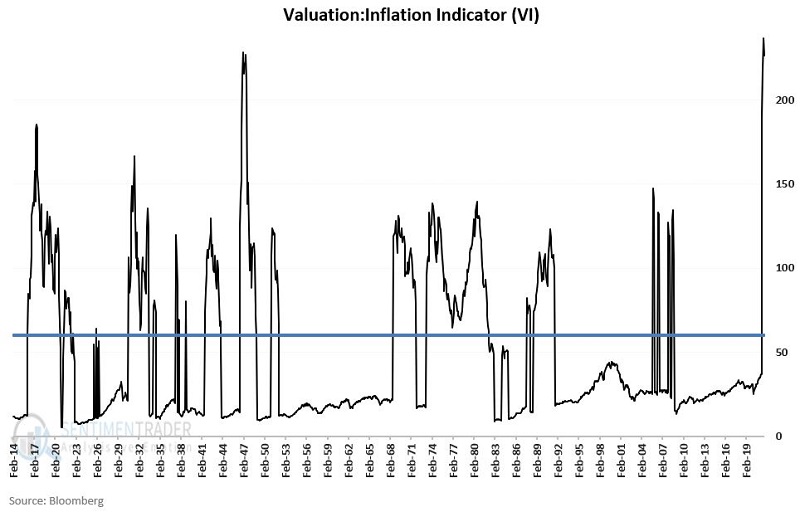
The chart below displays the historical values for the VI Indicator. The blue line is set at a value of 60, which we will use in a moment as an important point of demarcation.
 DOW PERFORMANCE WHEN VI < 60
Now let's look at the performance of the Dow Jones Industrial Average ONLY during those months when the VI ended the previous month BELOW 60.
The chart below displays:
- The growth of $1
- Invested in the Dow
- ONLY if the VI end the previous month BELOW 60
- Using a logarithmic scale
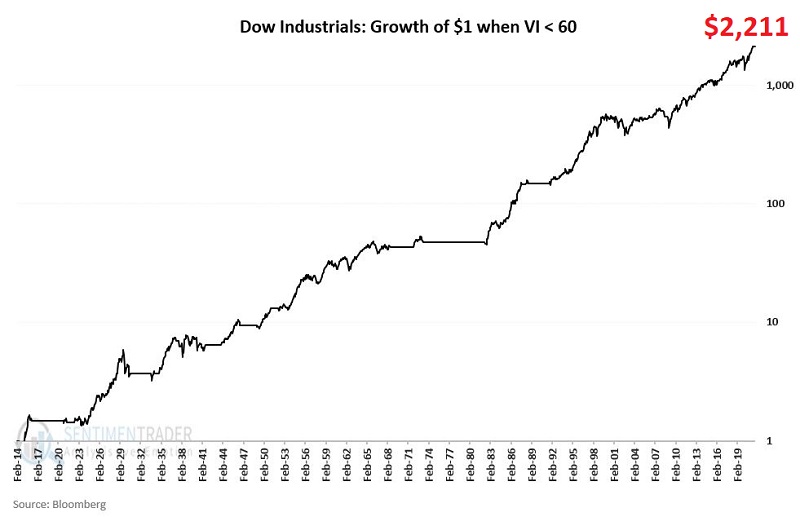
The total cumulative gain on a percentage basis is +210,982%.
DOW PERFORMANCE WHEN VI > 60
Now let's look at the performance of the Dow Jones Industrial Average ONLY during those months when the VI ended the previous month AT OR ABOVE 60.
The chart below displays:
- The growth of $1
- Invested in the Dow
- ONLY if the VI end the previous month AT OR ABOVE 60
- Using a logarithmic scale
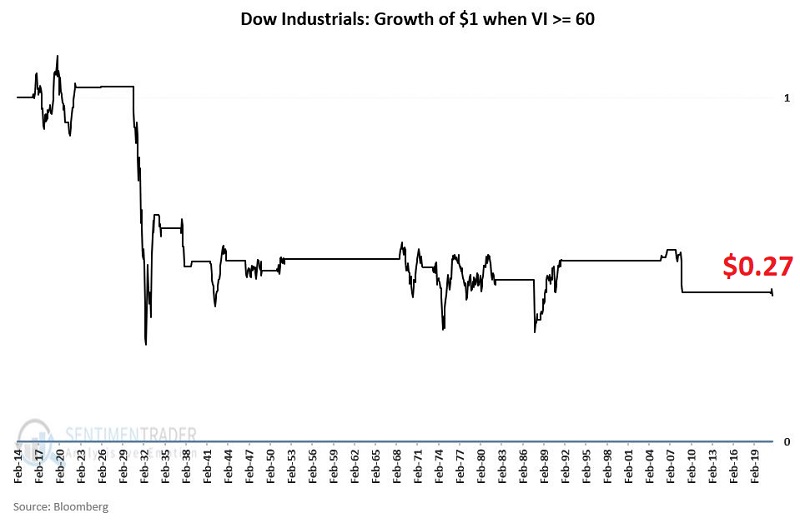
The total cumulative loss on a percentage basis is (-73.4%)
TRADING RESULTS
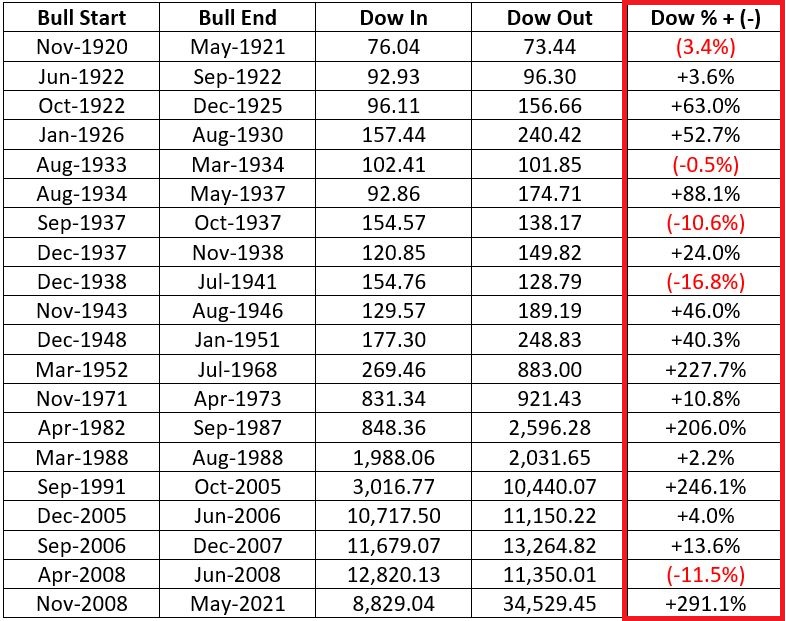
The table below displays the hypothetical gains and losses during the "Favorable" periods (i.e. when VI is < 60)
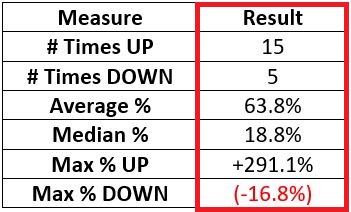
The table below shows the summary of results during Favorable periods.
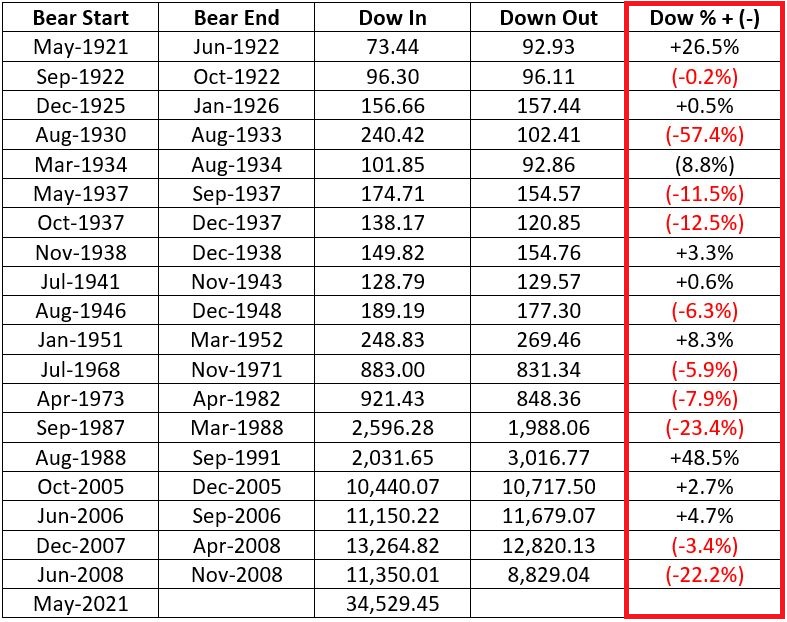
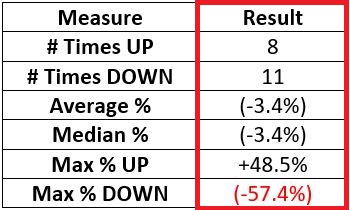
The table below shows the hypothetical gains and losses during the "Unfavorable" periods (i.e., when VI is >= 60)
The table below shows the summary of results during Favorable periods.
CURRENT STATUS
The VI Indicator:
- Popped above 60 at the end of May 2021
- Then soared to an all-time high reading of 236.6 at the end of August 2021
- Stood at 226.4 ending September 2021
Since these latest readings are well above our cutoff level of 60, does this mean that stocks are "doomed" to perform poorly from here? Not necessarily. Remember, stocks showed a gain during 42% of previous Unfavorable periods (8 out of 19 times). Nevertheless, overall market performance has been abysmal during Unfavorable periods, registering a net loss of -73.4%.
However, the bottom line is that the extremely high current reading for VI strongly suggests a great deal of potential downside risk in the stock market. Whether that risk is realized in the near term - or sometime in the years ahead from a higher level - is unknowable.
But the key takeaway is to remind yourself that the current bull market will not last forever and to make plans now to play defense when the time to do so arrives.
Which makes this an excellent time to invoke:
Jay's Trading Maxim #62: If you are walking down the street and you trip and fall, that's one thing. If you are standing on a mountain top and you trip and fall, that is something else altogether. But if you are not even aware that you are standing on a mountain top as you reach for the stars while standing on your toes and you trip and fall - the only appropriate phrase is "Look out below!"