High Yield vs. Intermediate Treasury Meets the Calendar

Very few investors are aware of the seasonal nature of the bond market. In actuality, some of it has to do with the stock market. It is widely known that the stock market has historically performed significantly better during November through April than during May through October.
Is there a way to take advantage of this in the bond market? Let's take a closer look.
DATA
We will take a look at the performance of:
- High-yield corporate bonds
- Intermediate-term (3-7 year) treasuries
We will measure performance separately during the following distinct 6-month periods:
- November through April
- May through October
For testing - and to generate as long of a backtest as possible - we will use monthly total return data for the following two mutual funds:
- Ticker VWEHX (Vanguard High-Yield Corporate Fund Investor Shares)
- Ticker FGOVX (Fidelity Government Income Fund)
Our test will extend from the end of April 1979 through the end of March 2021.
CORRELATIONS
A correlation of 1000 means two assets trade exactly the same. A correlation of -1000 means two assets trade exactly inversely.
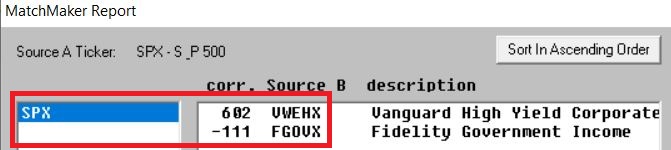
In the screenshot below (courtesy of AIQ TradingExpert), we see that:
- VWEHX has a fairly high correlation (602) to the S&P 500 Index (primarily because - like stocks - the performance of high yield corporate bonds is tied closely to the state of the overall economy).
- FGOVX has a slightly inverse correlation (-111) to the S&P 500 Index
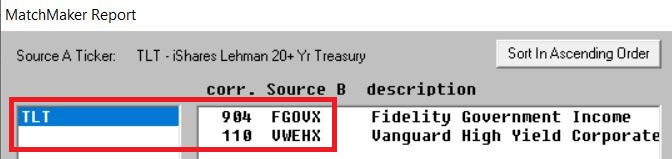
In the screenshot below (courtesy of AIQ TradingExpert), we see that:
- FGOVX has a very high correlation (904) to ticker TLT (a long-term treasury ETF that fluctuates based on interest rate movements)
- VWEHX has a very low correlation (110) to ticker TLT
So:
- If stocks perform better November through April, we can theorize that VWEHX should outperform FGOVX during this period
- If stocks perform worse from May through October, we can theorize that VWEHX should underperform FGOVX during this period
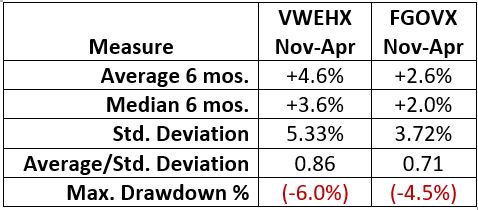
NOVEMBER THROUGH APRIL
The chart below displays the cumulative returns for VWEHX and FGOVX if held ONLY during November through April from 1979 into 2021.
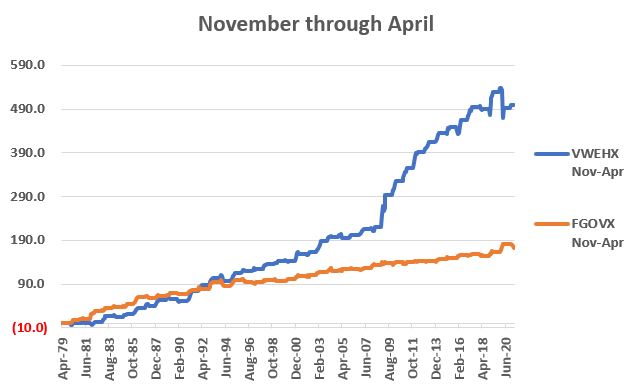
The table below puts some numbers to the results in the chart above
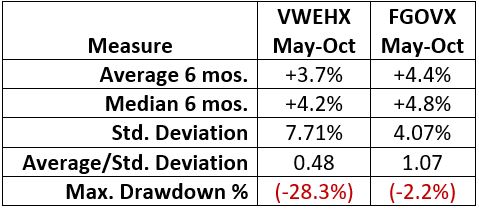
MAY THROUGH OCTOBER
The chart below displays the cumulative returns for VWEHX and FGOVX if held ONLY during May through October, from 1979 through 2020.
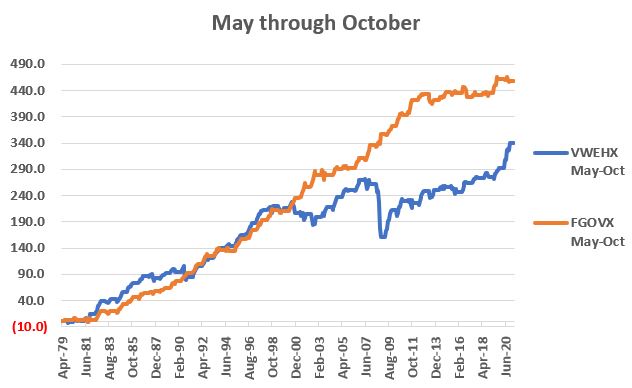
The table below puts some numbers to the results in the chart above.
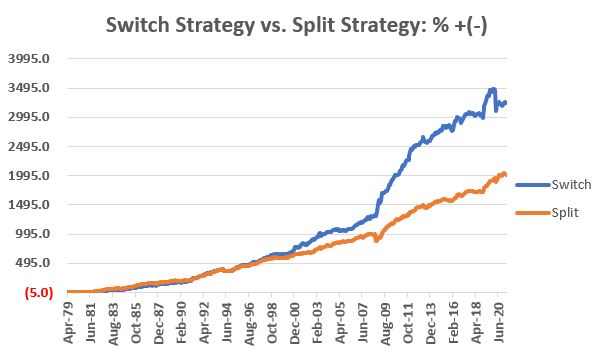
COMBINING THE TWO
So now let's test the following strategy:
- Hold VWEHX from November through April
- Hold FGOVX from May through October
As a benchmark, we will split a portfolio 50/50 between VWEHX and FGOVX and then rebalance to 50/50 at the beginning of every calendar year.
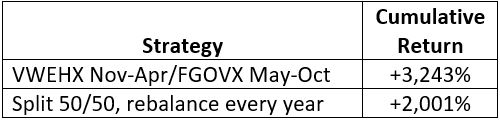
The chart below displays the performance of our Switch strategy versus the benchmark Split strategy.
The table below compares the results of the two strategies
RELATIVE PERFORMANCE
No strategy always works or outperforms at all times. This hypothetical seasonal bond switching strategy is no exception. The switching strategy took a hit in 2020 when VWEHX sold off hard during February and March. The chart below displays the growth of the Switching strategy divided by the growth of the Split strategy.
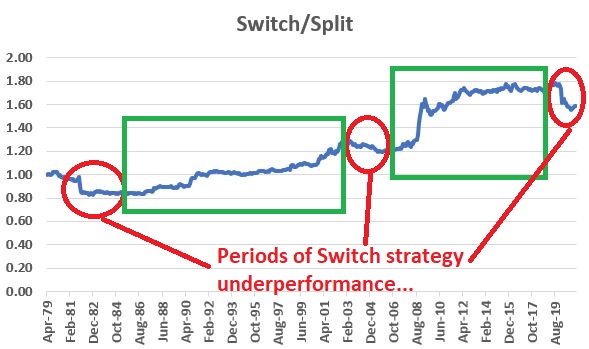
On the far right, you can note the drop-off in relative performance in recent years (signified by a declining blue relative performance line circled in red). However, you should also note that:
- This type of underperformance has happened twice before (see previous two red circles in chart above)
- In both previous cases, the Switching strategy significantly outperformed for a period of many years.
THE BOTTOM LINE
- With the calendar inching towards May, investors might look for the winds of change to blow a bit in the bond market (i.e., to favor intermediate-term treasuries) in the months ahead.
- Likewise, with the Switching Strategy having underperformed in recent years, investors might look for this simple strategy to reassert itself as a useful tool in playing the bond market in the years ahead.
ETF ALTERNATIVES
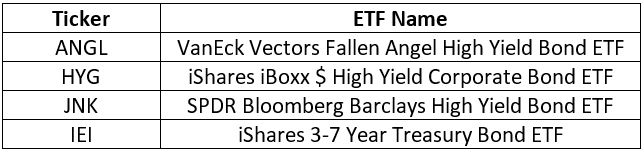
The table below displays some ETF alternatives to the funds used in the test above.
- The first three are potential alternatives to VWEHX
- The last one is a potential alternative to FGOVX