Products
SentimenTrader Trading Tools
‍
Backtest Engine
My Trading Toolkit
Correlation Analysis
Seasonality
Indicators & Data API
‍
Proprietary Indicators & Charts
Market Data API
Strategies & Scanner
‍
50+ Trading Strategies
Smart Stock Scanner
Research Reports
‍
Research Solutions
Reports Library
Free Resources
Simple Backtest Calculator
Simple Seasonality Calculator
The Kelly Criterion Calculator
Sentiment Geo Map
Public Research Reports
Pricing
Company
About
In the News
Testimonials
Client Success Stories
Contact
Log inLoginSign up
< BACK TO ALL REPORTS

Highly valued and with few consequences

Jason Goepfert
2021-04-20
The ratio of the S&P 500's forward price/earnings multiple to the VIX "fear gauge" has reached an extreme rarely seen over the past 30 years. Other extremes preceded a decline in valuation and a rise in volatility.

Investors are pushing the valuation of stocks to extreme heights, and not even having to suffer much volatility along the way. That started to change in a minor way over the last 2 sessions, so we'll have to see if it lasts.

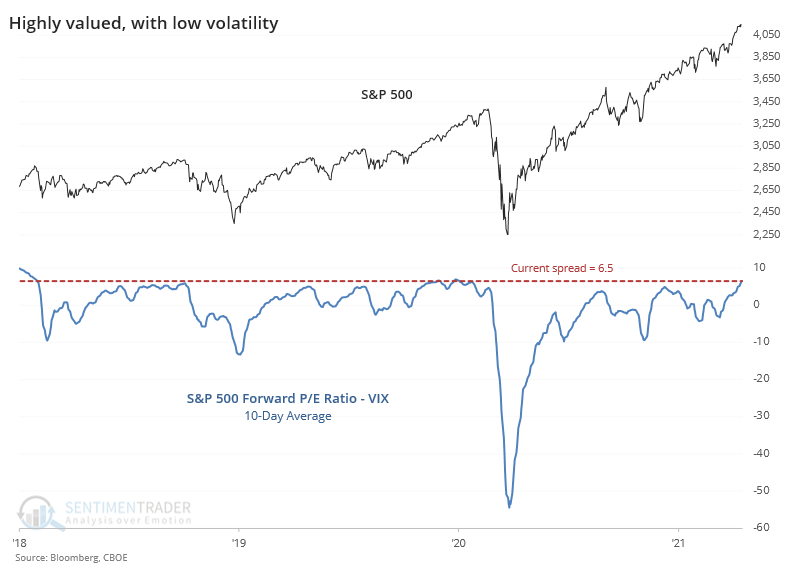
One of the ways we've looked at a shorthand for sentiment over the years is by comparing the S&P 500's forward price/earnings multiple to the VIX "fear gauge." The higher the ratio, the more investors are getting away with pushing valuations higher without much of a consequence.

A 10-day average of the spread between those two factors just reached its highest level in a year. This has now been added as a premium chart for daily updates and backtesting.

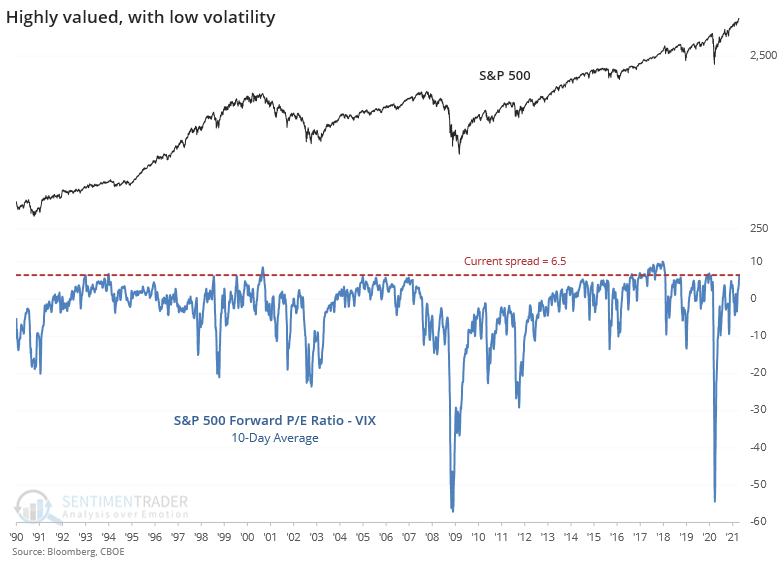
Zooming out over the past 30 years, the current spread is still among the highest readings.

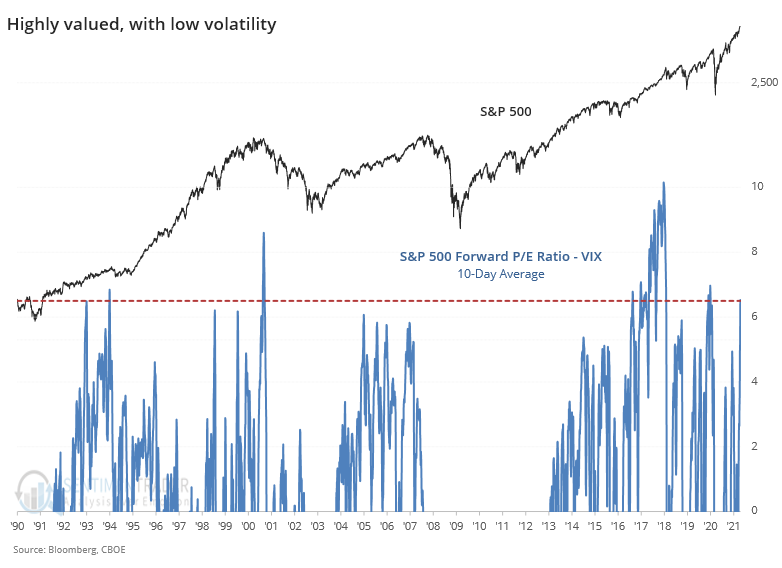
Some of the big selloffs really skewed the negative stretches for this spread, so if we only look at the positive ones, then the current extreme sticks out a bit more.

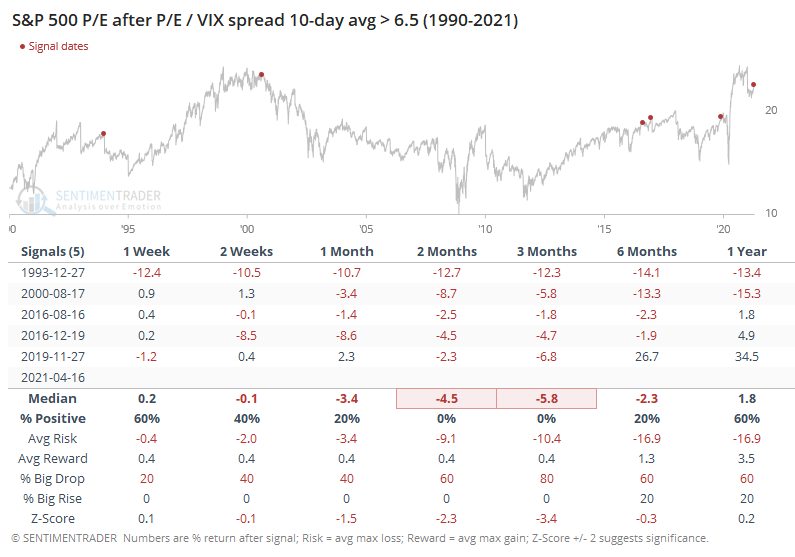
After other times the 10-day average of the spread reached its current level, the S&P struggled, except for the "nothing matters" market of 2017. Certainly, it's hard to rely on a small sample size, especially when one of the signals was a big outlier.

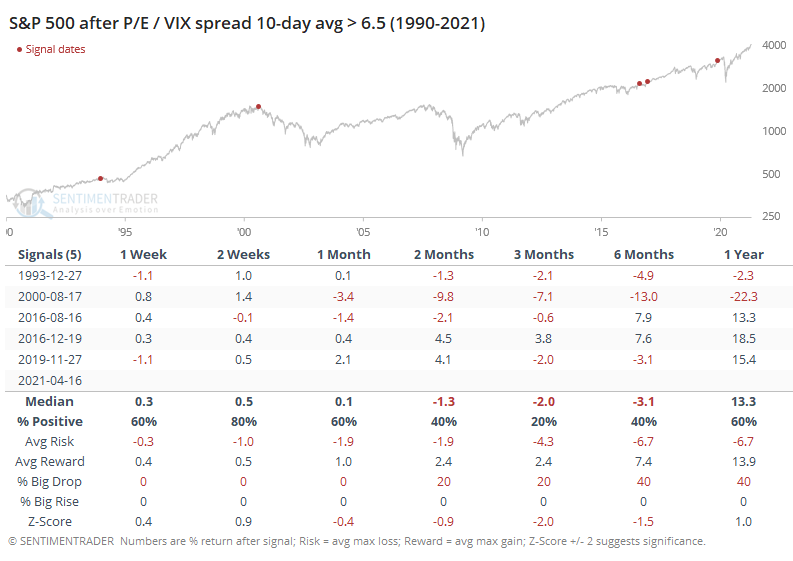
Notably, the S&P's price/earnings multiple declined every time, even after the 2017 signal. This was not a good setup if you want to believe that investors will be willing to keep pushing valuation multiples higher.

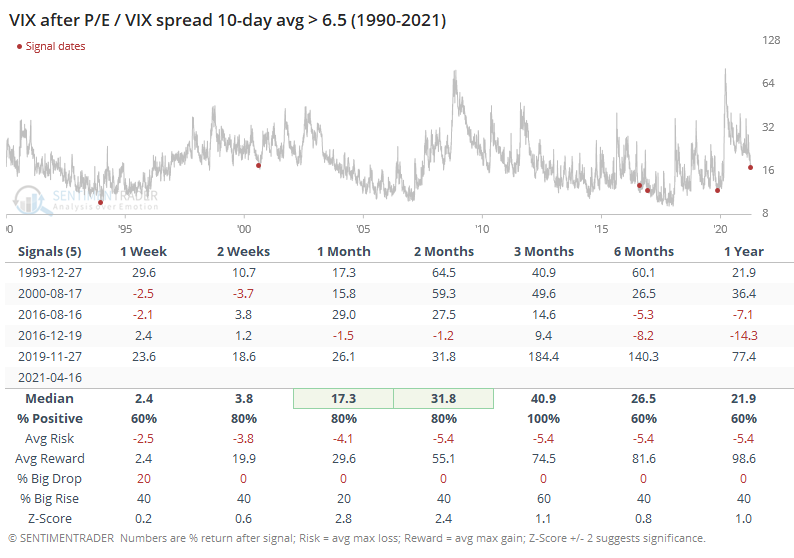
Also notable is that the VIX rose every time. Even during the 2017 mo-mo market, the VIX managed to rise over the next few months.

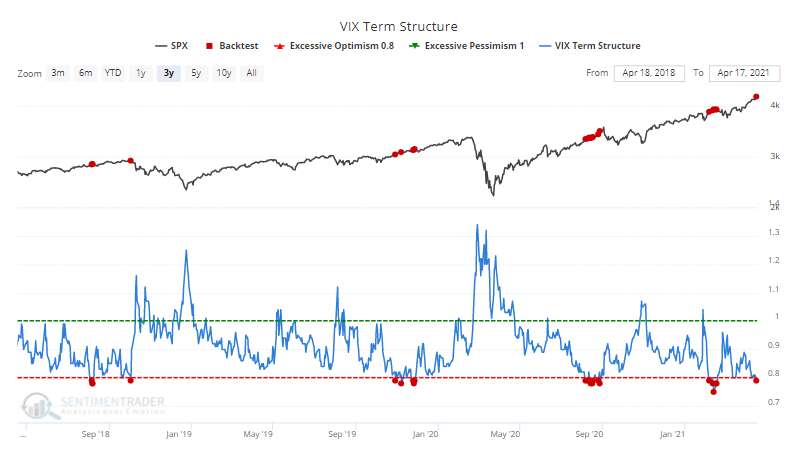
These calm conditions in the VIX are focused mostly on the nearer-term. Traders are pricing in a higher likelihood of bigger movements in the months ahead, so the VIX Term Structure is extreme. That didn't matter at all in 2017; other years typically saw any further gains given back.

We've seen before that valuations are exceptionally high and it has only gotten more extreme. One change since then is that investors have become much more complacent with those valuations, assuming they will just keep growing. That's when it becomes dangerous.

Sorry, you don't have access to this report

Upgrade your subscription plan to get access
Go to Dasboard
PRODUCTS
SentimenTrader
Trading Tools
Indicators & Data API
‍
Strategies & Scanner
‍
Research Reports
FREE
RESOUrCES
Simple Backtest
Calculator
Simple Seasonality
Calculator
The Kelly Criterion
Calculator
Sentiment Geo Map
‍
Public Research Reports
‍
Pricing
Bundle pricing
‍
Announcements
‍
FAQ
COMPANY
‍
About
‍
In the News
‍
Testimonials
‍
Client Success Stories
CONTACT
‍
General Inquiries
‍
Media Inquiries
‍
Financial Professionals Inquiries
‍
© 2025 Sundial Capital Research Inc. All rights reserved.
Setsail Marketing
TermsPrivacyAffiliate Program
Risk Disclosure: Futures and forex trading contains substantial risk and is not for every investor. An investor could potentially lose all or more than the initial investment. Risk capital is money that can be lost without jeopardizing ones’ financial security or life style. Only risk capital should be used for trading and only those with sufficient risk capital should consider trading. Past performance is not necessarily indicative of future results.

Hypothetical Performance Disclosure: Hypothetical performance results have many inherent limitations, some of which are described below. No representation is being made that any account will or is likely to achieve profits or losses similar to those shown; in fact, there are frequently sharp differences between hypothetical performance results and the actual results subsequently achieved by any particular trading program. One of the limitations of hypothetical performance results is that they are generally prepared with the benefit of hindsight. In addition, hypothetical trading does not involve financial risk, and no hypothetical trading record can completely account for the impact of financial risk of actual trading. for example, the ability to withstand losses or to adhere to a particular trading program in spite of trading losses are material points which can also adversely affect actual trading results. There are numerous other factors related to the markets in general or to the implementation of any specific trading program which cannot be fully accounted for in the preparation of hypothetical performance results and all which can adversely affect trading results.

Testimonial Disclosure: Testimonials appearing on this website may not be representative of other clients or customers and is not a guarantee of future performance or success.