
Historic thrust exceeds other post-crash rallies

When we look at rallies after a big decline, the daily ups and downs tend to generate the most attention. It's easy to lose track of how many "the biggest rallies happen in bear markets" comments there have been over the past few days.
Most investors are probably less entranced by big one-day jumps, and more so by how much of the decline has been erased. If stocks jump 5% and claw back half of the declines they suffered, then that will have more impact than a 5% gain that only claws back 10% of a decline.
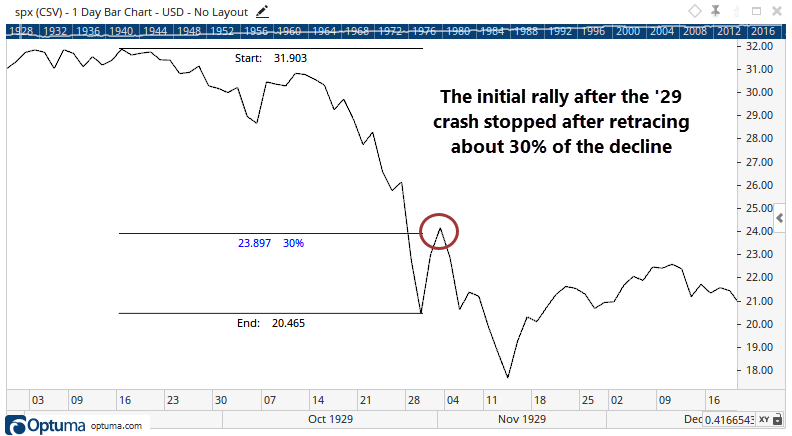
Once a market crashes, at some point those who were holding are going to see their moment to get out. In 1929, that happened after the S&P retraced a little over 30% of the decline.
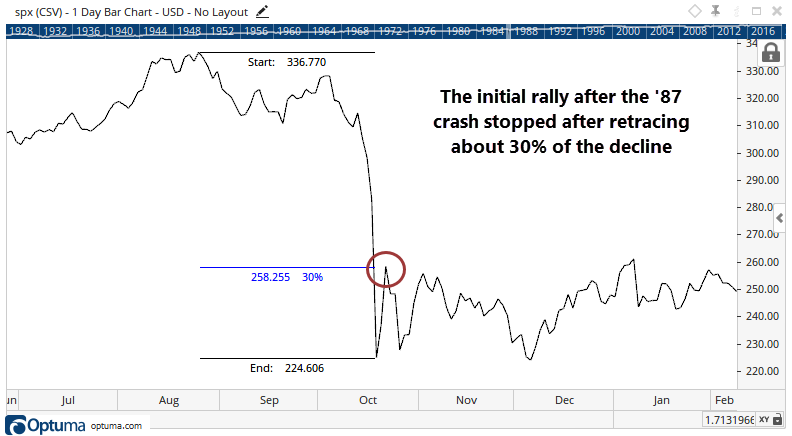
A very similar pattern occurred after the 1987 crash.
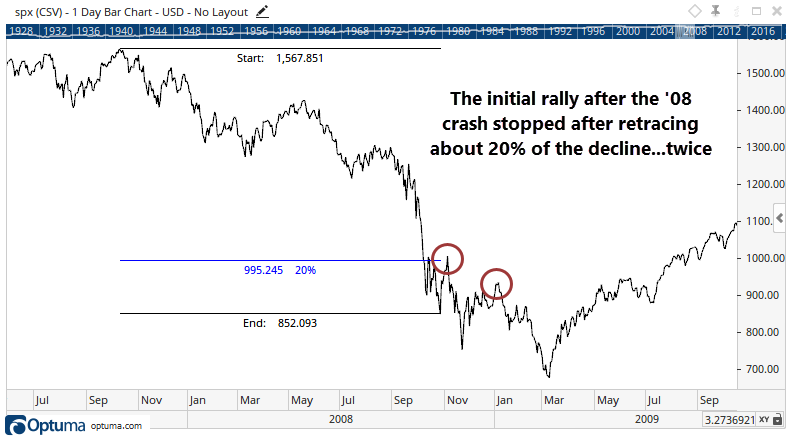
During the 2008 crash, the S&P only managed to retrace about 20% of the decline following the initial rebound from the panic in early October. The knee-jerk rally after the plunge into November also stopped at about the 20% retracement level.
This is interesting because we've just passed that post-crash threshold.
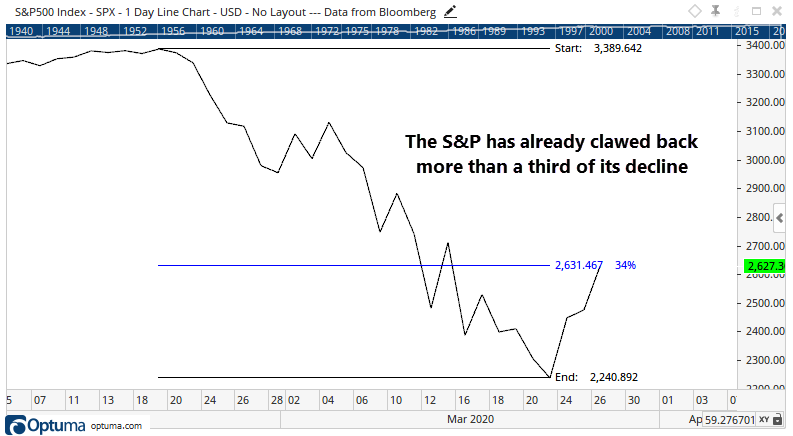
So far in this recovery, the S&P has clawed back more than a third of its decline, which surpasses the other post-crash scenarios. It suggests that this time is different, with more buying power behind the rebound.
And that buying power has been historic - potentially the best 3-day stretch since at least 1940. Each of the past three sessions has seen more than 80% of issues and volume skewed toward rising stocks.
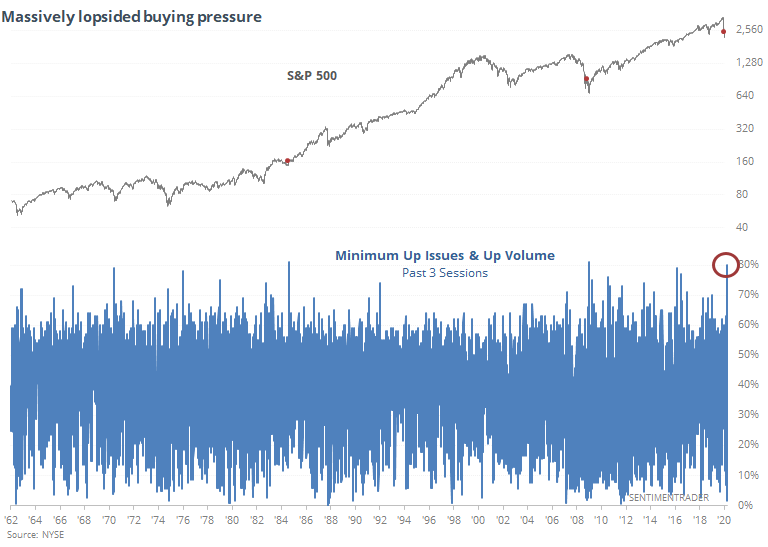
The only days that approached this were in August 1984 and January 2009, preceding the kick-off of massive bull markets (though it was early in 2009). If we relax the parameters to look for any 3-day stretch when the minimum Up Issues and Up Volume were at least 75%, then we get a few more signals.
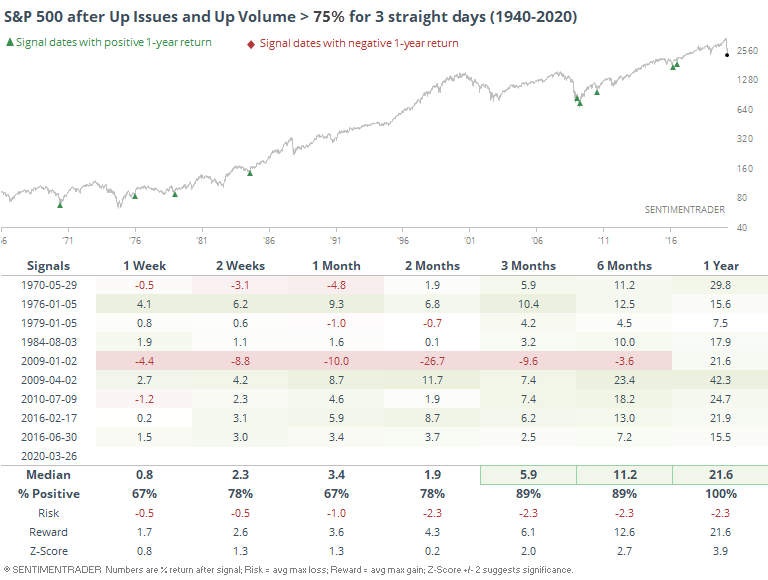
Like we've seen with the other buying thrust stats over the past couple of days, forward returns were impressive. That January 2009 signal certainly led to some shorter-term doubts, but the one-year return was still more than +20%.
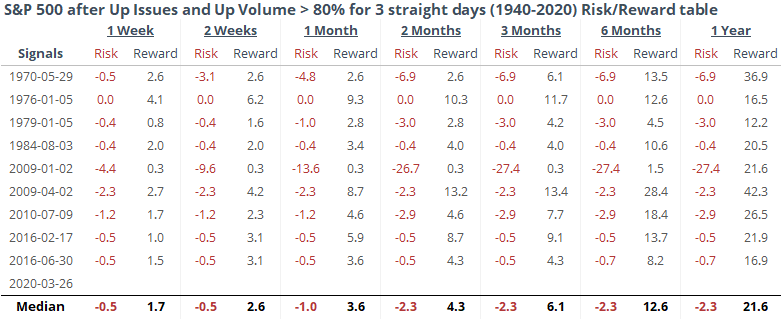
If we look at the risk/reward table, then we can see just how little downside the signals preceded (again, except for Jan 2009).
We already saw above why this signal is more impressive than January 2009 - that one couldn't make up any more than 20% of the decline, while this one has already exceeded 30%.
Buyers are doing what they need to do to change sentiment and increase the likelihood the worst has already been seen.