
Historical vs implied volatility

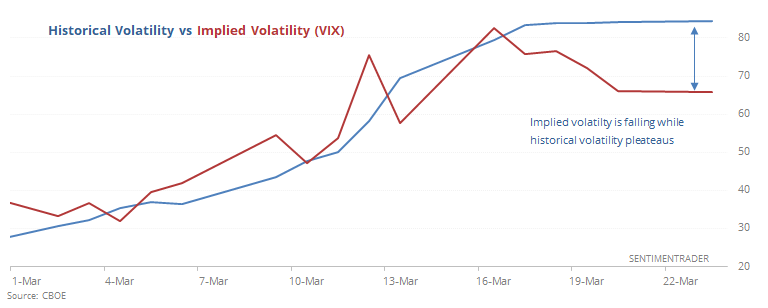
The VIX tends to get hyper-attention as a sentiment indicator. Which is why it's confusing that over the past week the VIX has been falling even while stocks remain extremely volatile, hitting new lows on Monday.
The historical volatility measure we calculate continues to climb and just reached 84.5. The VIX, meanwhile, peaked above 80 a week ago and has been dropping.
This has only happened twice before, which probably isn't much of a surprise.
After the height of the panic in 2008, stocks were swinging wildly in both directions, but options traders were starting to price in lower volatility going forward. We tend to see that when there is more two-sided volatility instead of just a constant decline.
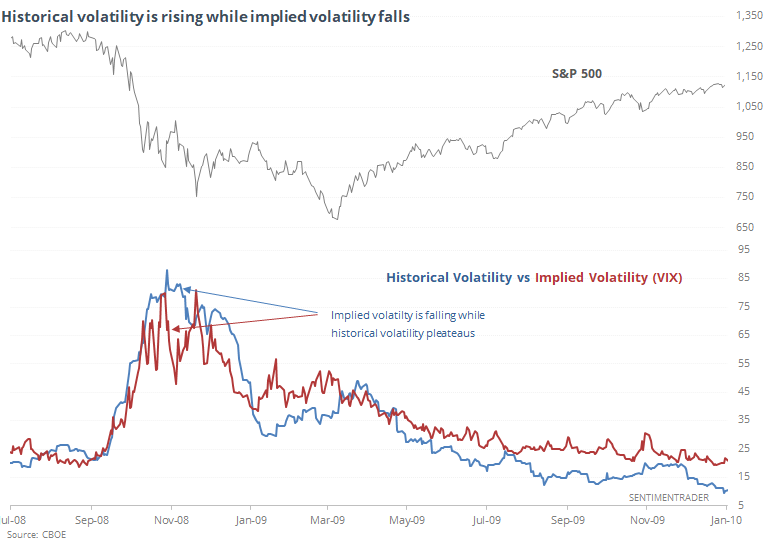
It was too early to call a bottom then, though. Even though stocks managed to string together a few up days, it wasn't the end of the decline - just the end of the worst of one-sided volatility.
In 1987, there was a more severe and immediate drop-off in the VIX, while historical volatility kept climbing.
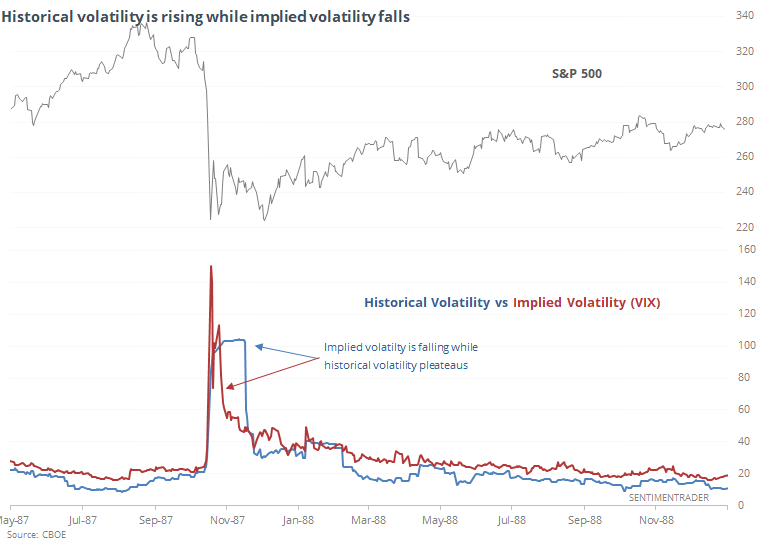
It's worth noting that both times, stocks suffered another leg (at least) lower after the worst of the panic subsided.
The best and most consistent gains didn't come until historical volatility dropped below the VIX and stayed there consistently. At the rate we're going now, that would take weeks - we'd need to see the daily price swings calm down substantially while options traders remain somewhat nervous.