How I use the Intermediate Term Optimism Index

One day in the future, the stock market will experience a correction, and investor sentiment will turn from optimism to pessimism. Luckily for us, Jason created the best toolbox of sentiment indicators on the planet.
Designing a good trading signal with sentiment indicators is similar to the methodologies I use for price-based alerts. The model should identify a sharp and sudden reversal from an extreme market condition.
Today's note aims to share a concept that identifies when the Intermediate-Term Optimism Index reverses from a pessimistic extreme.
COMPONENT
- SentimenTrader Intermediate-Term Optimism Index (Optix)
THE CONCEPT
The Intermediate-Term Optimism Index (Optix) signal identifies when the N-day net change in the Optix Index registers a sharp reversal upward from a pessimistic extreme. The model will issue an alert based upon the following conditions.
SIGNAL CRITERIA FOR THE S&P 500 ETF (SPY)
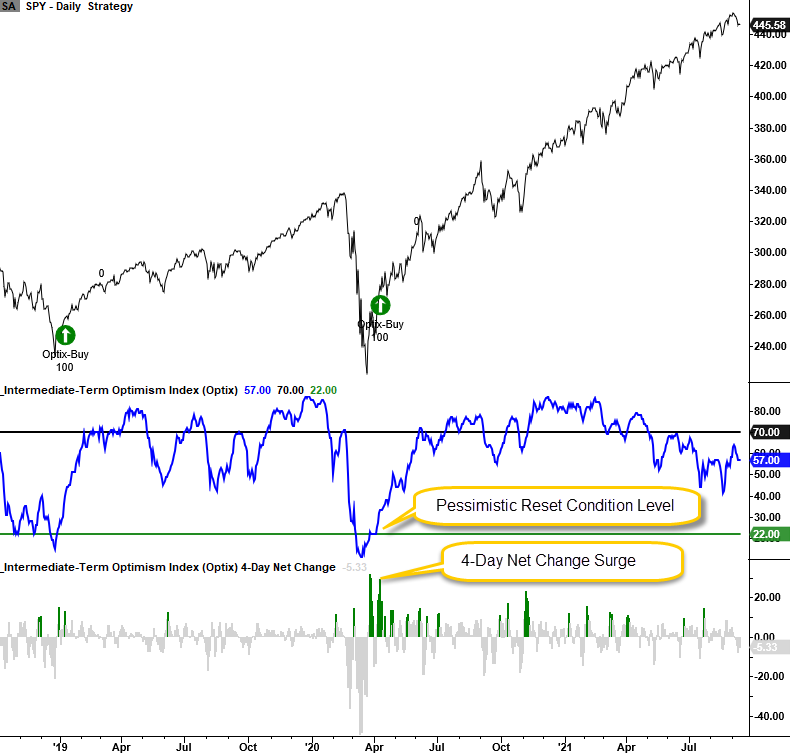
- If the intermediate-term optimism index crosses below 22%, then the pessimistic reset condition is active.
- If the reset condition is confirmed and the 4-day net change in the optimism index crosses above 10% and the 5-day rate of change for the SPY ETF > 0% within five days of the cross, then buy.
- If the intermediate-term optimism index crosses above 70%, then the optimistic reset condition is active. i.e., the optimistic reset condition screens out duplicate signals.
CURRENT DAY CHART
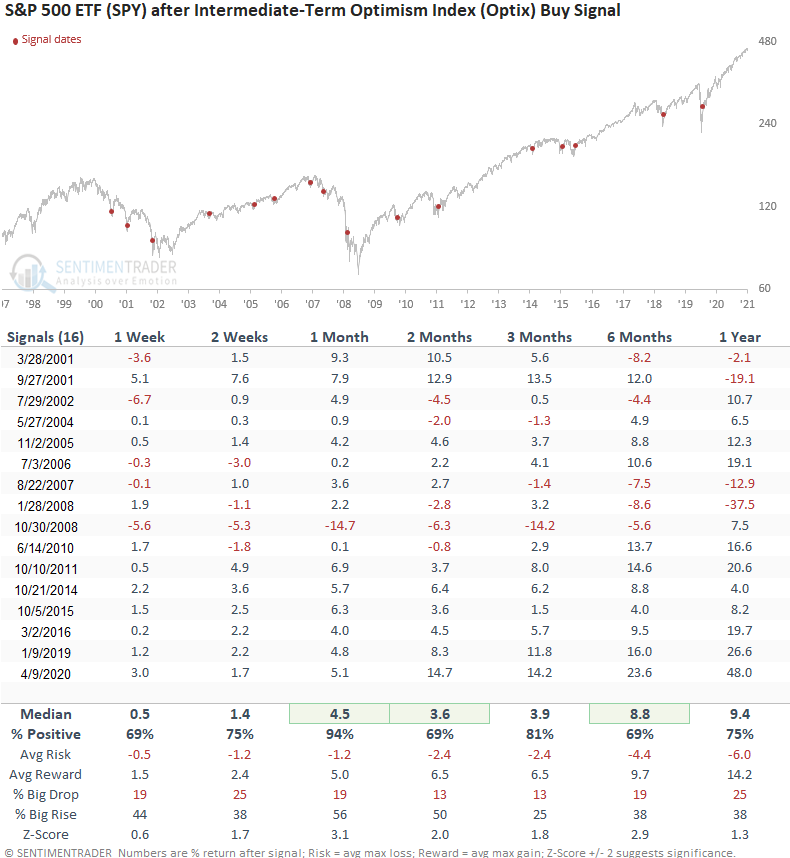
HOW THE SIGNAL PERFORMED
Results look good, especially the 1-month timeframe.
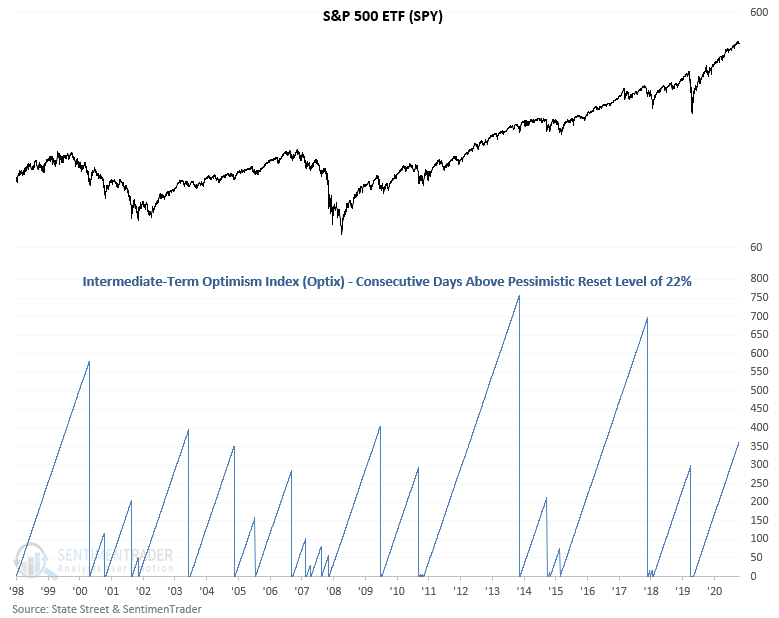
OPTIMISM COUNT
As the following chart shows, investors can remain in an optimistic mood for a long time.