
If You Just Have to Hold the S&P 500 Index...

As you might guess, I am not a huge fan of the world's most basic investment strategy - i.e., buying and holding the S&P 500 Index. But I have met a fair number of people who default to this approach. Their reasons for doing so typically fall into the, "you can't time the market" or "I don't have time to follow the market" or "in the long run the market goes up anyway" categories. And I sort of get it. But having studied the market, ahem, fairly heavily I am still not a fan.
I view buying and holding the S&P 500 Index as a "drifting with the tide" strategy. When the sun is shining and the wind is light there can be a whole lot of smooth sailing. But when the inevitable storms arise things can get pretty darned dicey. And as far as the "the market goes up in the long run argument" goes, what my own analysis has taught me is that "when" you happen to be buying-and-holding is a pretty big determinant of your success with the strategy.
For example, I have talked to people who amassed a fair amount of wealth and were all set to retire in 2008. Many of them had to delay their retirement for another 5 years or more after the "tide went out" at just the wrong time for them (or would be more accurate to say "the tsunami came in"?). The bottom line, they drifted with the tide and the tide changed at exactly the wrong time and instead of retiring at 65, they had to wait until they were 70 or whatever. Luckily for them the stock market bounced back steadily in the years following 2008. Of course, if they "panicked" in 2008 and dumped their stock in fear of "losing more", then the subsequent rebound may not have helped them. Just one more potential flaw in the "the market goes up in the long run" state of mind.
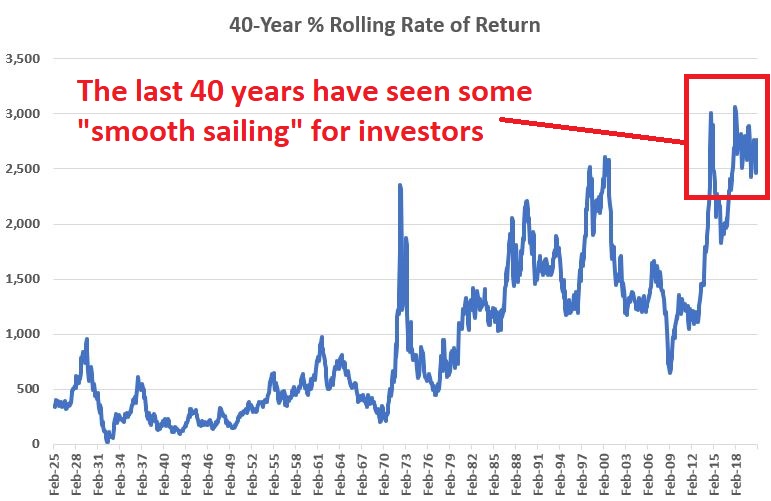
Assume you start investing when you are 25 years old and "cash out" when you are 65. That's a 40-year holding period. The chart below displays the rolling 40-year rate-of-return for stocks since 1885.
(Data Note: The chart uses the monthly closing price for the Dow Jones Industrial Average from 1885 through 1967, then the S&P 500 Index after that. The first 40-year period tested is Feb 1885 through Feb 1925 using the Dow. Each subsequent 40-year period is measured using the Dow through the period ending Nov 1967. From there the S&P 500 Index is used. The first 40-year period considered extends from Dec 1927 through Dec 1967.)
The key things to note from the chart above are:
- The good news is that if you buy-and-hold for 40 years you are almost certain (historically speaking) to make money
- As you can see at the far right-hand side of the chart, investors have had it pretty good (in fact, about the best it's ever been for stock investors) over the past 40 years
- But as you can also see, there can be a lot of variation over time. Depending on your own "40-year window" results can - to put it mildly "vary widely"
The bottom line: Recency bias may be lulling another generation of buy-and-hold investors into a false sense of security.
As you can see for yourself in the chart above, if one's own personal 40-year window sees a big advance in the stock market AND ends on a high note then "things are swell, things are great" . On the flipside, if one's own personal 40-year window sees moderate returns AND/OR ends while the stock market "tide is out", you can be forced to change your long-term retirement plans drastically.
And if you are strictly a buy-and-hold investor - always fully invested - then you have no control over any of this. Just saying.
Be all this as it may, what remains is:
- I am not a fan of buy-and-hold
- A lot of other people seem to be
So, I say "OK fine, have it your way." But at least let's try to find a way to improve things a bit.
The S&P 500 Equal Weighted Index
The standard S&P 500 Index is "capitalization-weighted", i.e., each stock is weighted based on "stock price times number of shares outstanding." There also exists an S&P 500 Equal Weighted Index which gives equal weight to all 500 stocks in the index. In this manner the index performance is not dominated by the largest companies. S&P 500 Equal Weight Index monthly total return data goes back to January 1990. So, we will start our test there.
S&P 500 Equal-Weighted Index versus S&P 500 Index: November through May
The chart below displays the cumulative total return for both the S&P 500 Equal Weight Index and the standard S&P 500 Index ONLY during the months of November through May starting in January 1990.
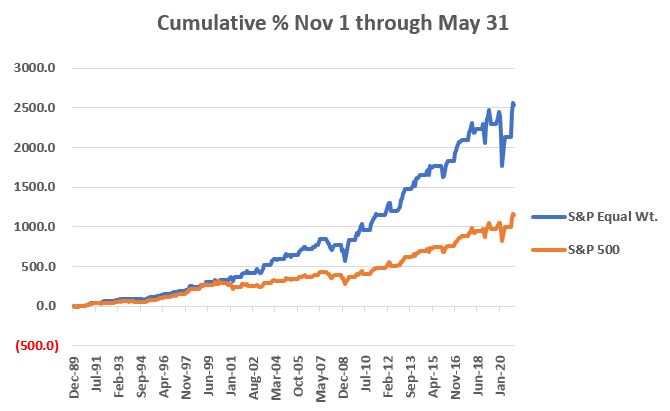
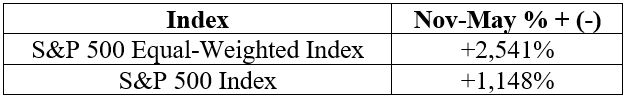
For the record, the cumulative gains for November through May from Jan 1, 1990 through Jan 31, 2021 were:
The equal weighted index outperformed the cap-weight index by a factor of 2.21-to-1 during November through May.
Now let's consider performance during the rest of the year.
S&P 500 Equal-Weighted Index versus S&P 500 Index: June through October
The chart below displays the cumulative total return for both the S&P 500 Equal Weight Index and the standard S&P 500 Index ONLY during the months of June through October starting in 1990.
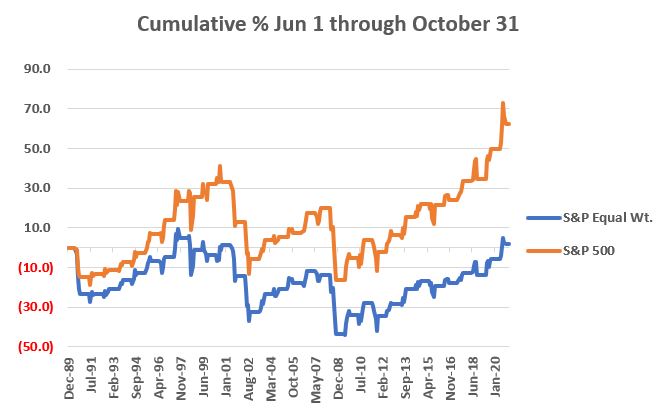
For the record, the cumulative gains for June through October were:
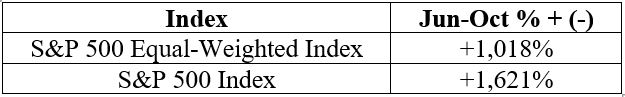
The cap-weighted index outperformed the equal weighted index by a factor of 1.59-to-1 during June through October.
Putting the Two Together
So now let's compare the performance of two strategies.
Strategy #1:
- Holds S&P 500 Equal Weight Index during November through May
- Hold S&P 500 Index June through October
Strategy #2:
- Holds BOTH indexes
- Rebalances to a 50/50 split at the end of each year
The chart below shows the cumulative total return for both the "Switch" and "Split" strategies.
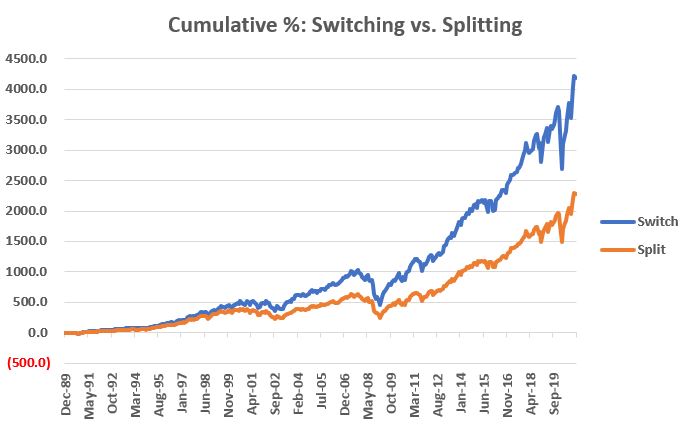
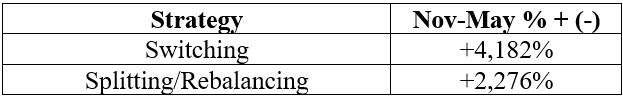
For the record, the cumulative returns for these two strategies were:
Summary
Do I love the "Switching" strategy? Not really. Do I prefer it to Splitting/Rebalancing or just buying-and-holding the S&P 500 Index? You bet.
A few asides:
- The switching strategy is best used in a non-taxable account (Because there are two trades every year there are no long-term capital gains, only short-term)
- The S&P 500 Equal-Weighted Index can be traded using the ETF ticker RSP
- The S&P 500 Index can be traded using a variety of ETFs including tickers SPY, IVV, VOO and SPLG