
Index Investing May Be Dead Money For Awhile

Key Points:
- Recent market action suggests the nature of the market is changing
- Index investors may experience low returns for the next 3-12 months
- Strategy and security selection is about to become much more important
The nature of the stock market is changing, and investors may need to move beyond index funds and pay closer attention to strategy and security selection to prosper. Index investors enjoyed a terrific - almost uninterrupted - 21-month run following the Covid-19 panic in early 2020. Unfortunately, this type of "easy money" is the exception to the rule in the stock market.
In the second half of 2021, we detected many signs of "churning" in the market - a particular type of internal market action that typically portends weakness for the major stock market averages. Churning does not necessarily portend a stock market crash, or even a long, drawn-out bear market, for that matter. But it does mean that the major market indexes could be "dead money" for a while.
Signs of "churning" everywhere
Churning is a word typically used to describe a period of market activity where the major market averages (Dow, S&P, Nasdaq, Russell 2000) continue to move mostly higher, while at the same time, a lot of individual stocks begin to experience weakness. While the market appears strong on the surface, there is significant weakness developing internally. Another phrase to describe this state of affairs is, "the Generals are leading, but the troops are not following." This is not a scenario likely to lead to a positive outcome.
What this means for investors
Given the extreme level of internal weakness in recent months, combined with the sharp market decline in recent weeks, it is vital to understand the likely implications for stock market investors as we advance.
The major indexes may move sideways to lower for anywhere from 6 to 12 months (or more if an actual bear market unfolds). As a result, strategy and security selection will likely become much more critical in the months ahead than they were following the post-Covid panic low in March 2020.
The NASDAQ HiLo Logic Index Indicator
Let's use the NASDAQ HiLo Logic Index to illustrate the potential for subpar index returns in the months ahead.
Norman Fosback created the original HiLo Logic Index in 1979 using NYSE data. Intended as a way to observe "split" market conditions, it looks for times when there are both a large number of 52-week highs AND 52-week lows among securities on the exchange.
- When there are many new highs AND new lows, the market is severely split between winners and losers, and it tends to be a negative for stocks going forward.
- When there is a very low number of one or the other, the market is heavily one-sided, which tends to be a positive for stocks.
- The indicator is traditionally interpreted over a longer time frame, so we suggest viewing it with a 10-day moving average.
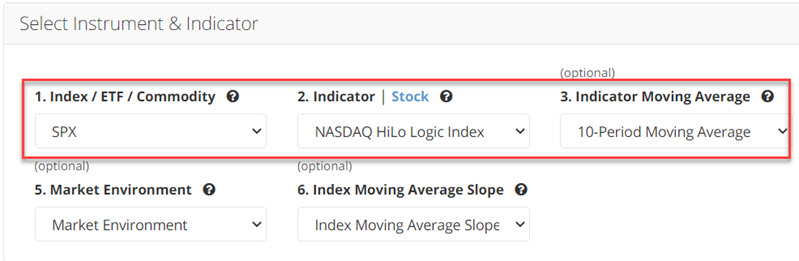
Let's identify times in the past 20 years when the 10-day average of the NASDAQ HiLo Logic Index has dropped below 2.60 for the first time in a month. The twist is that we will measure results by looking at the S&P 500 Index (essentially as a proxy for the "market").
The input screens from the Sentimentrader Backtest Engine appear below.

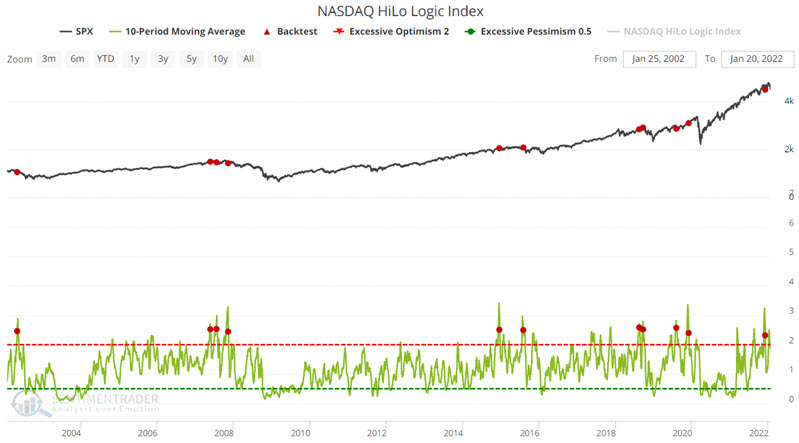
The output screen appears below. Note that a new signal occurred on 12/1/2021.
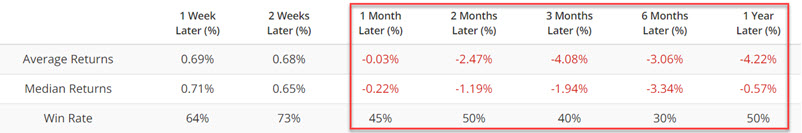
The table below displays the subpar nature of returns following previous signals.
A closer examination of post-signal market performance
Let's look at market action following the previous signals to understand better the potential implication of the most recent signal for index investors.
2002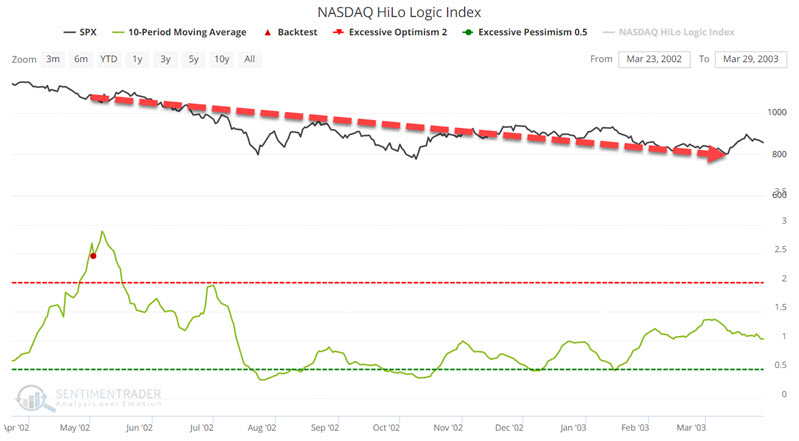
The May 2002 alert signaled a continuation of an ongoing bear market. The S&P declined another -27% over the next 5+ months and was still -13.7% lower 12 months after the alert.
2007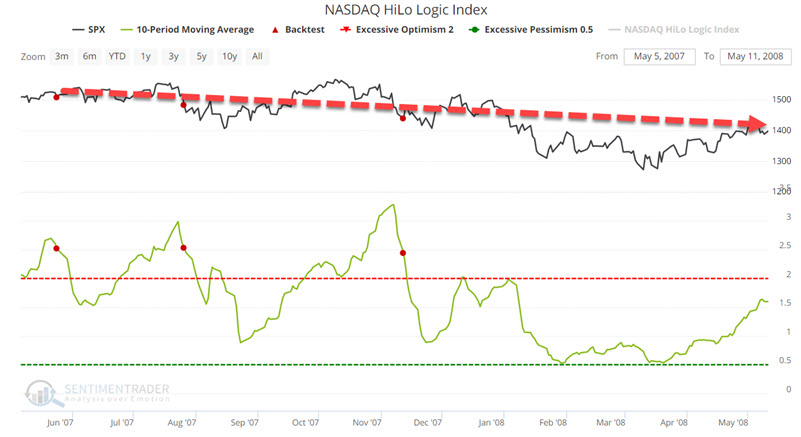
2007 witnessed three separate alerts. After the May 2007 alert, the S&P 500 mustered only a +3.8% advance over the next five months, at which point the Great Financial Crisis bear market of 2007-2009 began. Twelve months after the November 2007 alert, the S&P 500 stood over -40% lower.
2014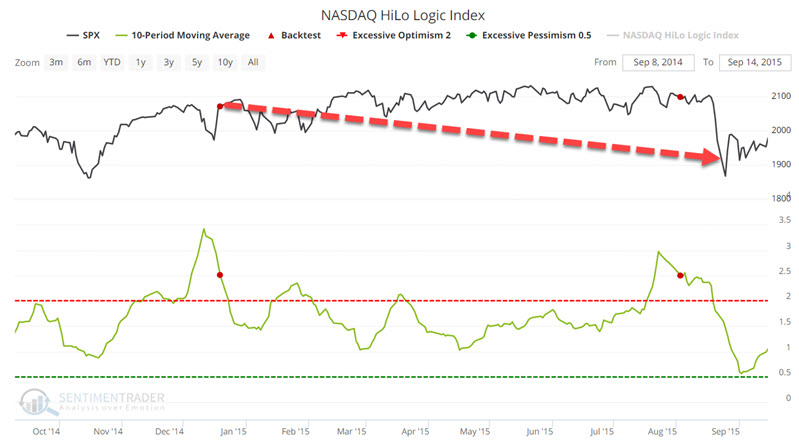
The December 2014 alert foreshadowed a long period of sideways to lower price action for the S&P 500 Index. Five months after the signal, the S&P 500 was a mere +2.9% higher. It peaked in May 2015 and stood at -2.4% lower twelve months after the December 2014 alert.
2015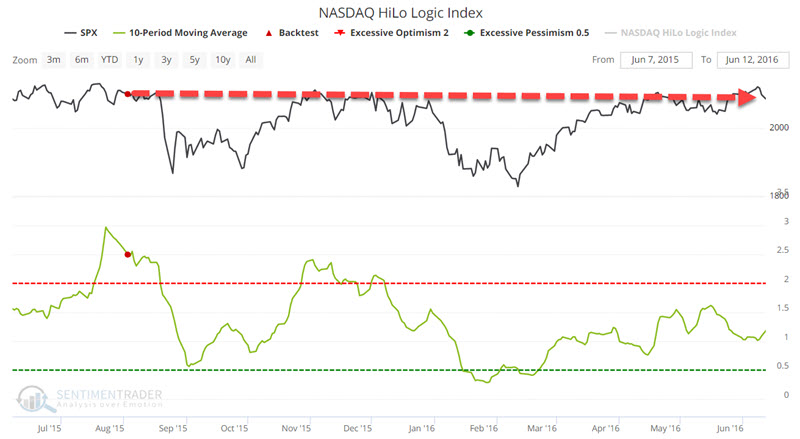
The August 2015 alert was followed by a pair of short, sharp declines, with a maximum drawdown of -12.8% between August 2015 and February 2016. Eleven months after the August 2015 alert, the S&P 500 remained unchanged, resulting in another "lost year" for index investors.
2018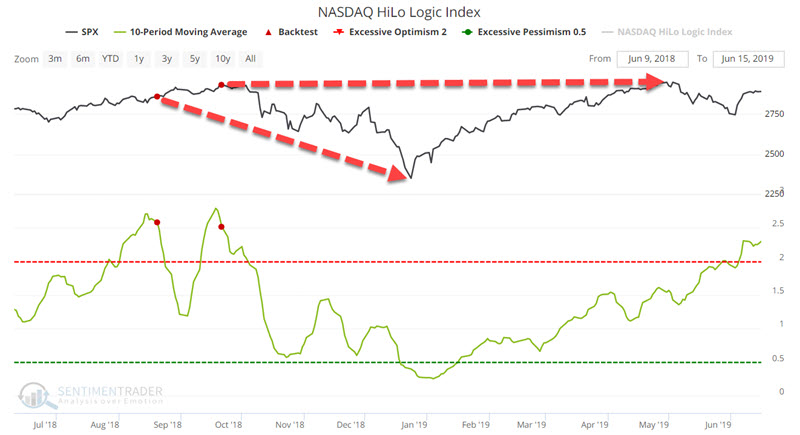
2018 witnessed two alerts back-to-back in August and September. Following the September 2018 alert, the S&P 500 plummeted almost -20% by late December 2018. Even after the strong rebound from the December 2018 low, the S&P was unchanged nearly a year after the September 2018 alert.
2019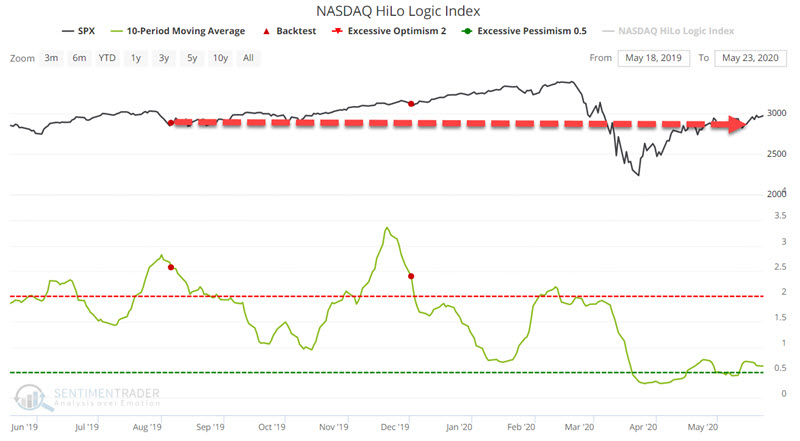
The 2019 alerts in August and December are interesting. Despite these two warnings, the S&P 500 continued to rally strongly into February 2020. Likewise, the 12-month return for the August alert was +15.48%, and the 12-month return for the December alert was +17.62%. So not valuable signals, right?
Well, maybe. However, these two alerts preceded the Covid-induced panic in February and March 2020, which saw the S&P 500 plummet -34% in a matter of weeks.
2021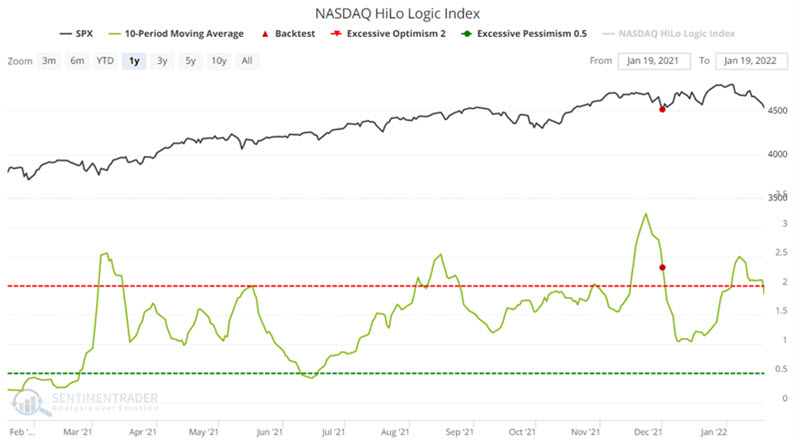
A new NASDAQ HiLo Logic alert occurred on Wednesday, December 1st. Based on the information above, it is not difficult to envision a challenging 6-12 months ahead for investors who park their money in index funds and "let it ride."
What the research tells us...
Churning in the stock market - i.e., when weak internals are hidden beneath reasonably performing indexes - should always be viewed as a warning sign that the nature of the market will likely be changing soon. Churning typically portends future trouble for the major indexes themselves over the next 6-12 months. When you identify a period of churning, it may be wise to review your investment methods to ensure you are not relying solely on index performance to make money.