
Inflation, interest rates and sectors Part I

Key Points
- Specific sectors tend to outperform or underperform depending on the current trends in inflation and interest rates
- Our goal is to create a simple model to objectively deem the current trend of inflation and interest rates as "rising" or "falling"
- Inflation is presently in a long-term uptrend
- Interest rates are presently in an intermediate-term uptrend
Measuring the trend of inflation
We will assess the inflation trend by comparing the 12-month rate-of-change in the Consumer Price Index to its 120-month exponential moving average.
- If CPI is above its long-term average, inflation is "rising"
- If CPI is below its long-term average, inflation is "falling"
The chart below displays the 12-month % change in the Consumer Price Index along with its 120-month exponential moving average.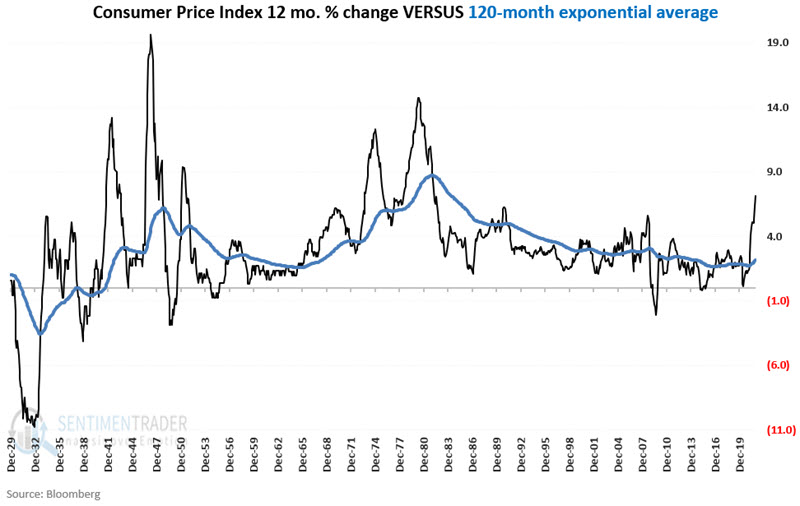
The chart below displays the difference between the 12-month % change in the Consumer Price Index minus its 120-month exponential moving average.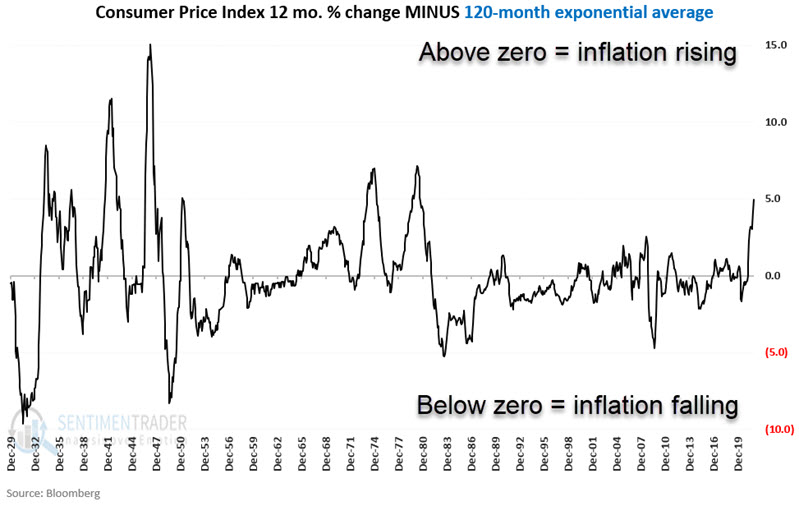
Combined Model Calculations
A = CPI 12-month % change
B = 120-month exponential moving average of A
C = A - B
If C < 0 then D = +2 else D = 0
Variable D has been at "0" since May 1st, 2021 when inflation spiked back above its long-term average.
Measuring the trend of interest rates
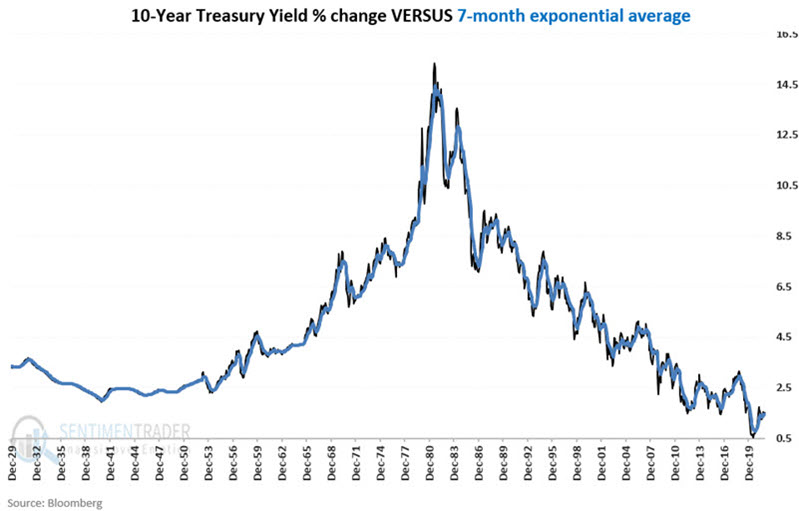
We will assess the interest rate trend by comparing the month-end yield on 10-year treasuries (TNX) to its 7-month exponential moving average.
- If TNX is above its intermediate-term average, interest rates are "rising"
- If TNX is below its intermediate-term average, interest rates are "falling"
The chart below displays the month-end yield for the 10-year treasury note along with its 7-month exponential moving average.
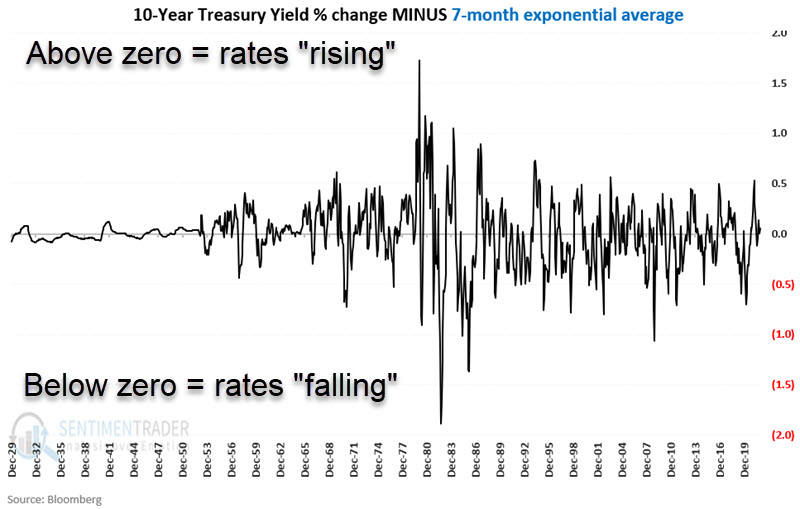
The chart below displays the difference between the month-end yield for the 10-year treasury minus its 7-month exponential moving average.
Combined Model Calculations
E = 10-year treasury month-end yield
F = 7-month exponential moving average of E
G = E - F
If G < 0 then H = +1 else H = 0
Variable H has been at "0" since October 1st, 2021.
The Combined Model
The Combined Model is calculated at the end of each month by adding Variables D and H above. The model will read:
+3 = If both inflation and interest rates are falling
+2 = If inflation is falling and interest rates are rising
+1 = If inflation is rising and interest rates are falling
0 = If both inflation and interest rates are rising
The chart below displays the month-end status of the Combined Model starting in 1930 through the end of 2021.
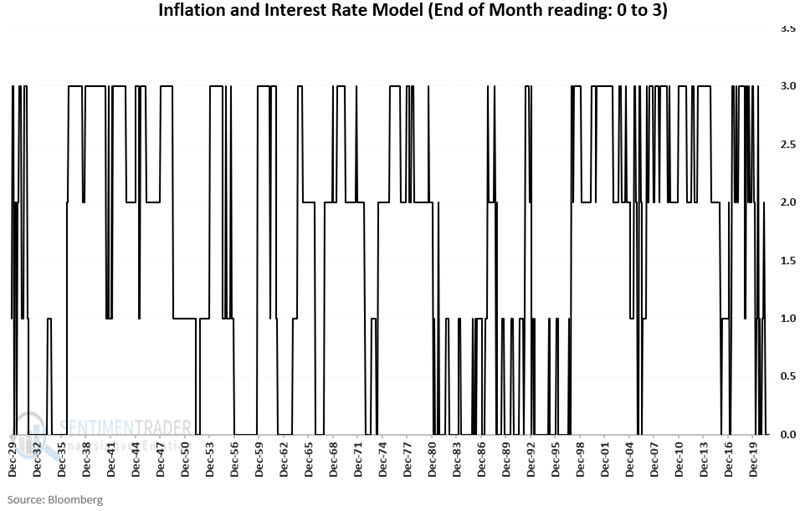
The Combined Model has been at "0" since 9/30/2021 as both inflation and interest rates are deemed to be rising using the objective calculations detailed above.
Sector performance based on Combined Model status
For testing purposes, we will use the Fama French Index database from 1930 to 1990 and then the S&P 500 Sector Index data from 1990 through 2021.
The table below displays the total return for each sector if held only during different Combined Model readings. In other words, the column titled "+3" shows the cumulative return for each sector ONLY during those months when the Combined Model ended the previous month with a reading of +3, and so on.
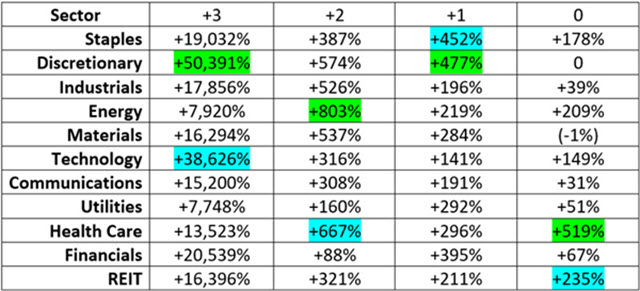
For each Combined Model reading level, the top-performing sector is highlighted in green. The second top-performer is highlighted in blue.
With the Combined Model presently at "0". Historically, the Health Care and REIT sectors have been the top performers for this reading. There are, however, a few key things to note:
#1. Results can vary widely from episode to episode
The performance results displayed in the table above are cumulative results across all periods showing a particular reading (+3, +2, +1, or 0). It should not be assumed the sectors highlighted in the table above will always be outperforming every time the Combined Model shows a particular reading. Results can and will vary widely from episode to episode. We will cover this topic in more detail in subsequent articles.
#2. These sectors can be traded using ETFs
The table below displays the SPDR Select Sector ETF that tracks each S&P 500 index and its performance since the Combined Model fell to "0" on 9/30/2021.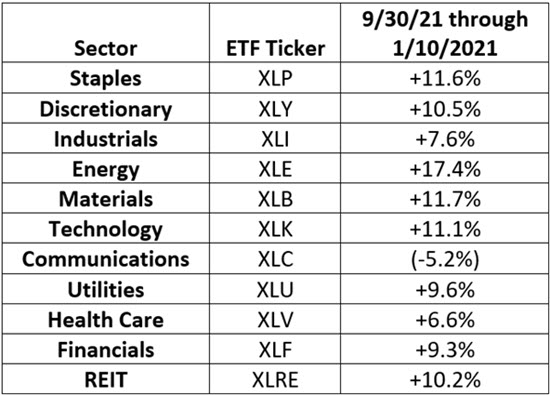
The table above shows that Health Care has been a laggard, and REITs have been a roughly middle-of-the-road performer since 9/30/21.
What the research tells us…
Inflation and interest rate trends do exert an influence on stocks. Likewise, different sectors appear to be affected differently by various rate and inflation trends combinations. Future articles will address the persistence of these trends and analyze results in greater depth.