Products
SentimenTrader Trading Tools
‍
Backtest Engine
My Trading Toolkit
Correlation Analysis
Seasonality
Indicators & Data API
‍
Proprietary Indicators & Charts
Market Data API
Strategies & Scanner
‍
50+ Trading Strategies
Smart Stock Scanner
Research Reports
‍
Research Solutions
Reports Library
Free Resources
Simple Backtest Calculator
Simple Seasonality Calculator
The Kelly Criterion Calculator
Sentiment Geo Map
Public Research Reports
Pricing
Company
About
In the News
Testimonials
Client Success Stories
Contact
Log inLoginSign up
< BACK TO ALL REPORTS

Internal momentum shows good gains

Jason Goepfert
2020-12-03
In recent days, internal momentum as measured by the McClellan Summation Index has improved for small-caps and energy, as well as non-U.S. markets in Brazil and Mexico. Some shorter-term weakness wasn't unusual following these signals, but longer-term gains were more common.

During October and November, we looked multiple times at the broadening of the rally, including historic thrusts of overwhelming buying interest. Those are the kinds of readings that can overwhelm sentiment extremes like we've recorded in recent weeks.

The improvement in some of these figures was due in large part to a renewal of interest in smaller stocks. The Cumulative Advance/Decline Line for the Russell 2000 is near a decade-long high thanks to the recent surge that also pushed its McClellan Summation Index above +500 for the first time since the beginning of the year.

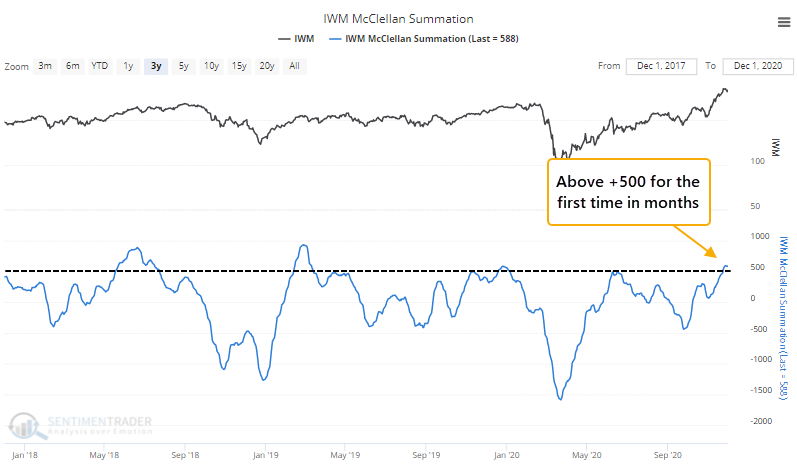
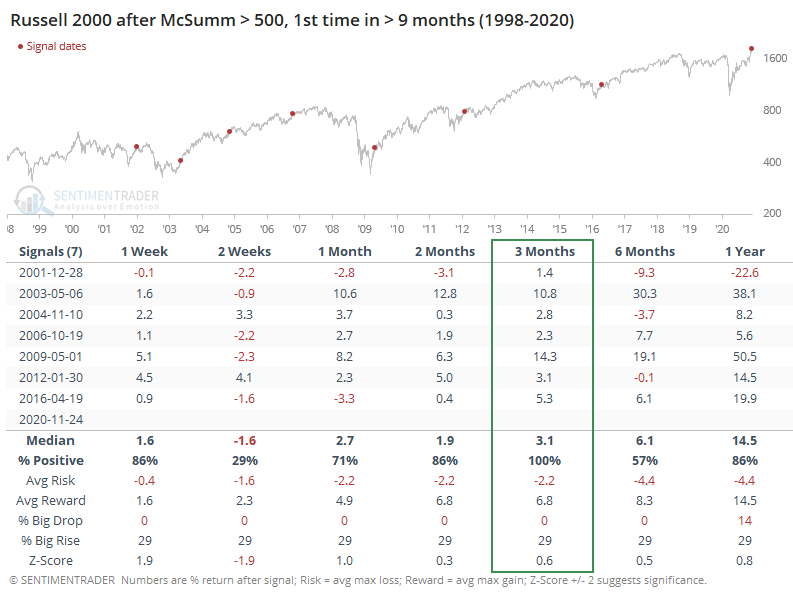
When its Summation Index moved above this threshold for the first time in more than 9 months, the Russell continued to gain every time over the ensuing 3 months, even after accounting for frequent shorter-term weakness.

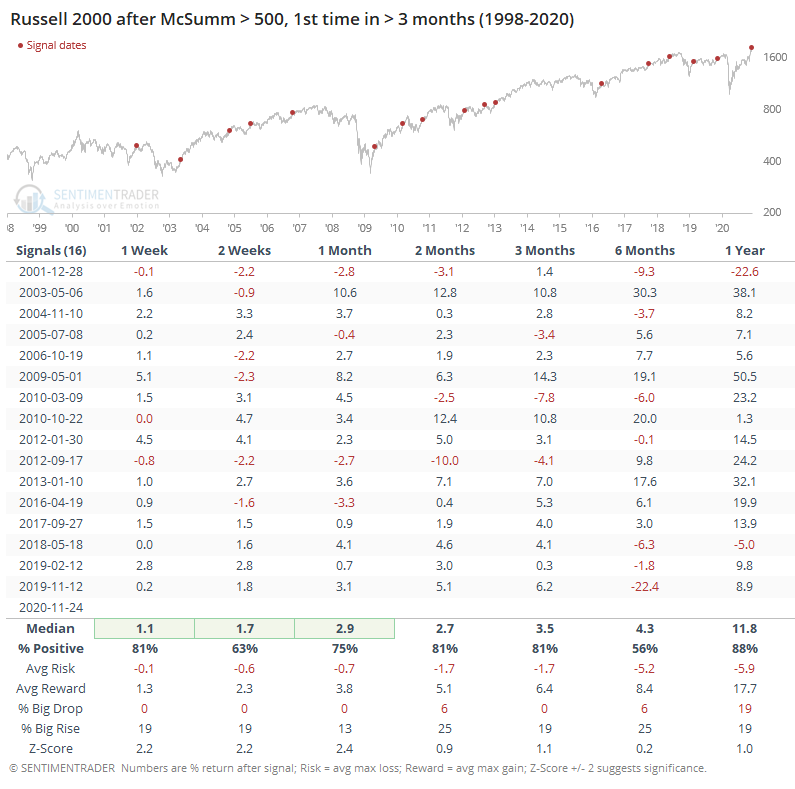
If we look at lesser extremes in order to generate a larger sample size, it was still quite positive.

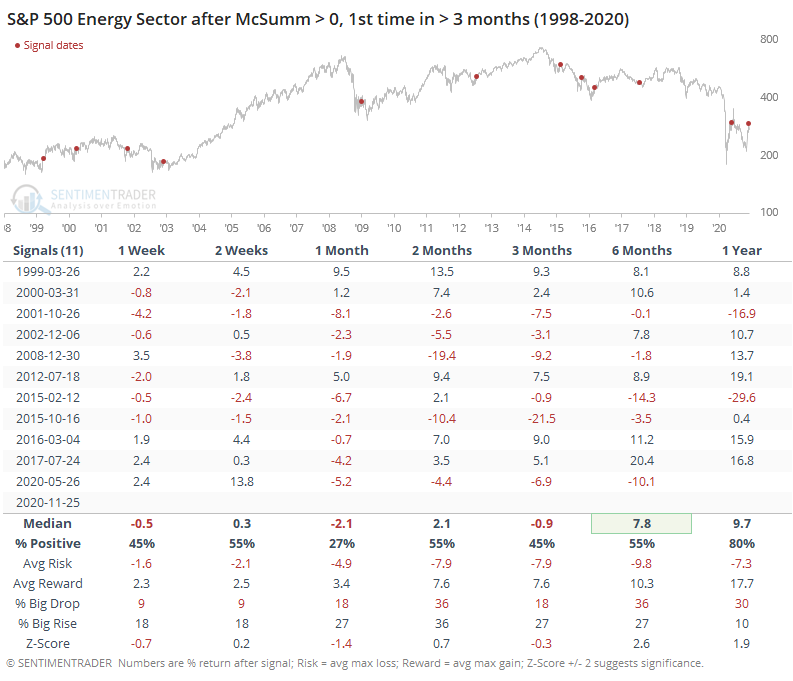
The snapback in smaller stocks happened along with rebounds in many beaten-down sectors like energy. The Summation Index for that sector finally managed to poke above the zero line.

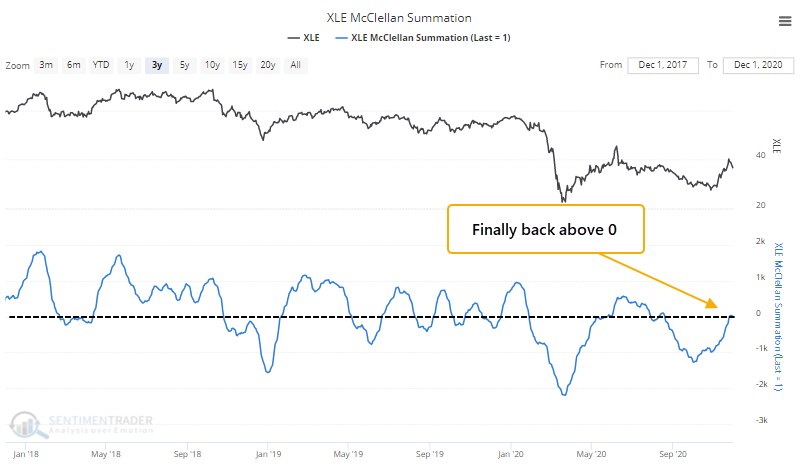
It has not been easy for energy shares to maintain any positive momentum in recent decades. When internal momentum finally recovered after months of negativity, selling pressure has usually followed, but with better-than-random results over the next 6-12 months.

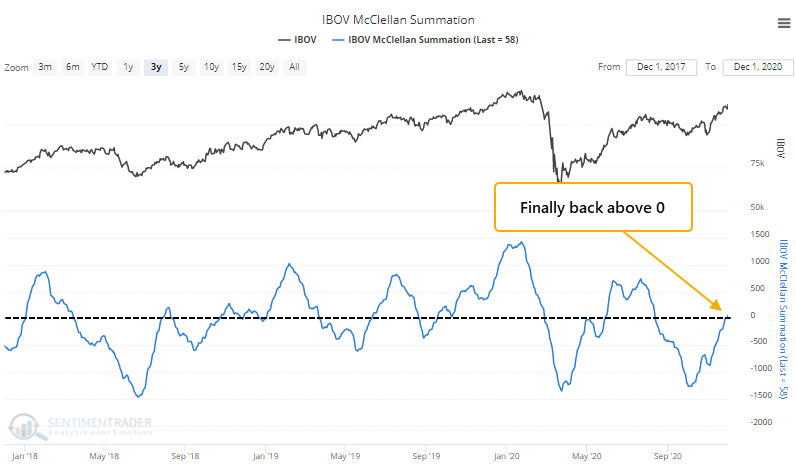
Some non-U.S. markets are closely tied to commodity markets and have a relatively high correlation to sectors like energy. As that sector has tried a recovery, so has Brazil's Ibovespa index, whose Summation Index also just climbed above zero.

These stocks have had great difficulty holding onto this momentum in the short-term, but it was a good medium- to long-term sign.

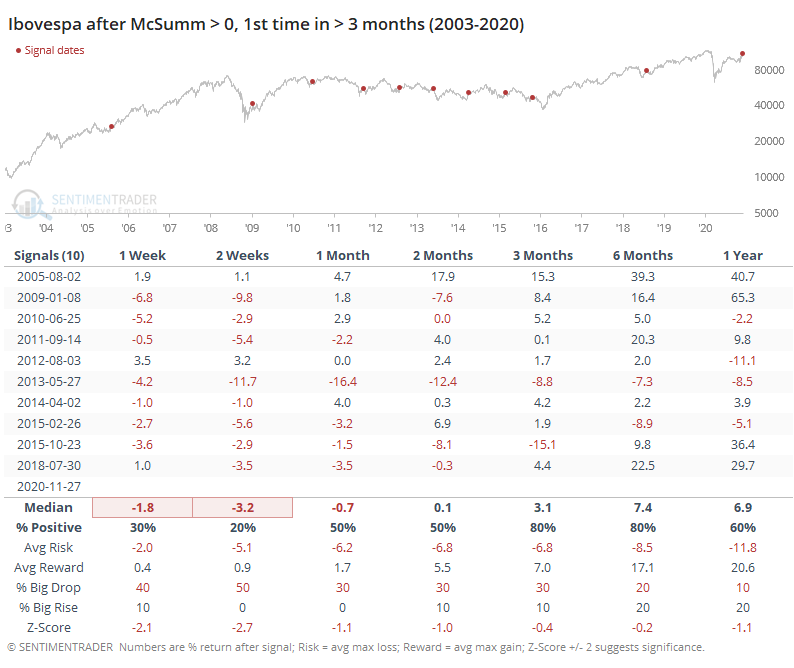
All but 2 of the signals showed losses during the next 2 weeks, but also all but 2 of them showed gains over the next 3-6 months.

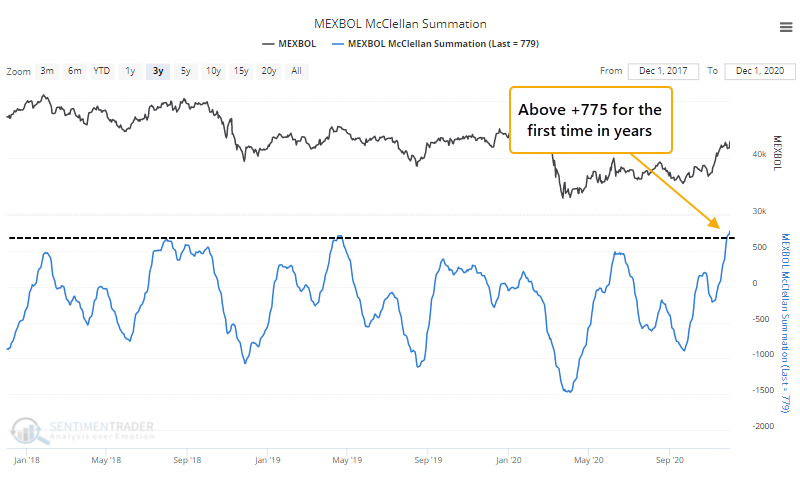
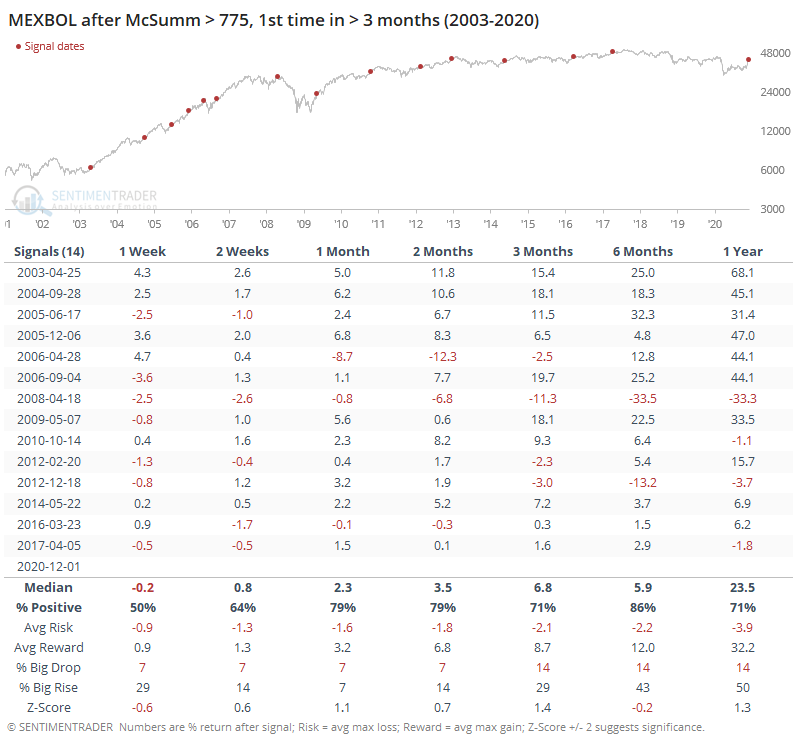
Some of the strongest internal momentum is in the Mexican MEXBOL index, where the Summation Index has moved above +775, its highest level in years.

Here, too, we saw some short-term weakness but it was a good medium- to long-term sign.

The recovery in some of these markets is the most impressive in months, or even years. While some weakness was common, it was generally confined to the first month or so after the recovery reached its current level. On a medium- to long-term basis, most of these showed strong results.

Sorry, you don't have access to this report

Upgrade your subscription plan to get access
Go to Dasboard
PRODUCTS
SentimenTrader
Trading Tools
Indicators & Data API
‍
Strategies & Scanner
‍
Research Reports
FREE
RESOUrCES
Simple Backtest
Calculator
Simple Seasonality
Calculator
The Kelly Criterion
Calculator
Sentiment Geo Map
‍
Public Research Reports
‍
Pricing
Bundle pricing
‍
Announcements
‍
FAQ
COMPANY
‍
About
‍
In the News
‍
Testimonials
‍
Client Success Stories
CONTACT
‍
General Inquiries
‍
Media Inquiries
‍
Financial Professionals Inquiries
‍
© 2025 Sundial Capital Research Inc. All rights reserved.
Setsail Marketing
TermsPrivacyAffiliate Program
Risk Disclosure: Futures and forex trading contains substantial risk and is not for every investor. An investor could potentially lose all or more than the initial investment. Risk capital is money that can be lost without jeopardizing ones’ financial security or life style. Only risk capital should be used for trading and only those with sufficient risk capital should consider trading. Past performance is not necessarily indicative of future results.

Hypothetical Performance Disclosure: Hypothetical performance results have many inherent limitations, some of which are described below. No representation is being made that any account will or is likely to achieve profits or losses similar to those shown; in fact, there are frequently sharp differences between hypothetical performance results and the actual results subsequently achieved by any particular trading program. One of the limitations of hypothetical performance results is that they are generally prepared with the benefit of hindsight. In addition, hypothetical trading does not involve financial risk, and no hypothetical trading record can completely account for the impact of financial risk of actual trading. for example, the ability to withstand losses or to adhere to a particular trading program in spite of trading losses are material points which can also adversely affect actual trading results. There are numerous other factors related to the markets in general or to the implementation of any specific trading program which cannot be fully accounted for in the preparation of hypothetical performance results and all which can adversely affect trading results.

Testimonial Disclosure: Testimonials appearing on this website may not be representative of other clients or customers and is not a guarantee of future performance or success.