
Internal turmoil

It's always sketchy to make a big deal about a single trading session, especially in relation to drawing conclusions about future returns. Markets are too noisy, and sometimes there is a market event that throws things out of whack for a day or two.
At the risk of that, let's make a big deal about Monday.
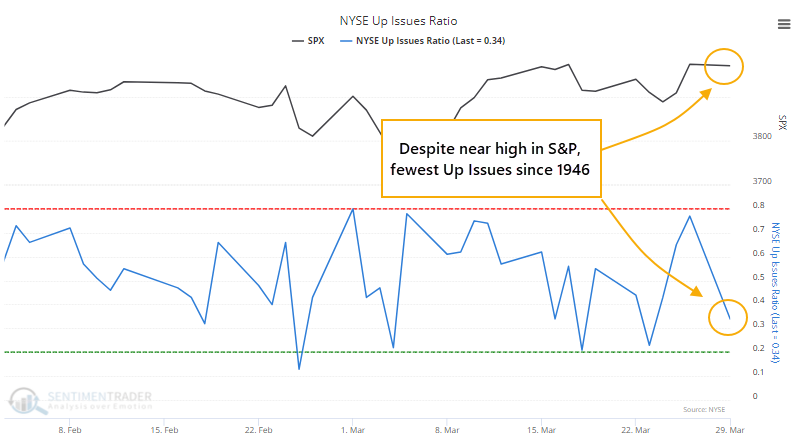
In the Daily Report, we saw that despite the S&P 500 closing within 0.1% of a record high on Monday, fewer than 35% of securities on the NYSE managed to close above their closing price from Friday. That was the weakest Up Issues Ratio since at least 1960 for a day the S&P was so near a high. Going back further, we hadn't seen behavior like this since 1946.
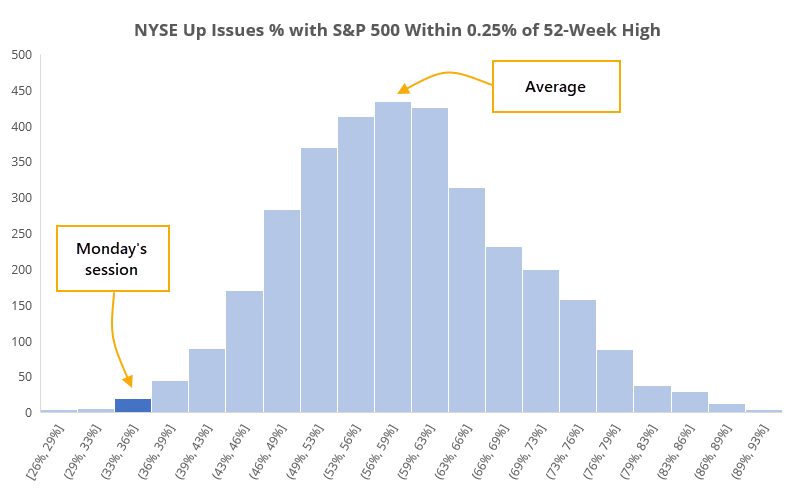
Since 1928, when the S&P 500 was within 0.25% of a 52-week high, an average of 58% of securities on the NYSE advanced for the day. There have been 3,331 days when the S&P was that close to a high, and the histogram below shows just how unusual Monday's session was.
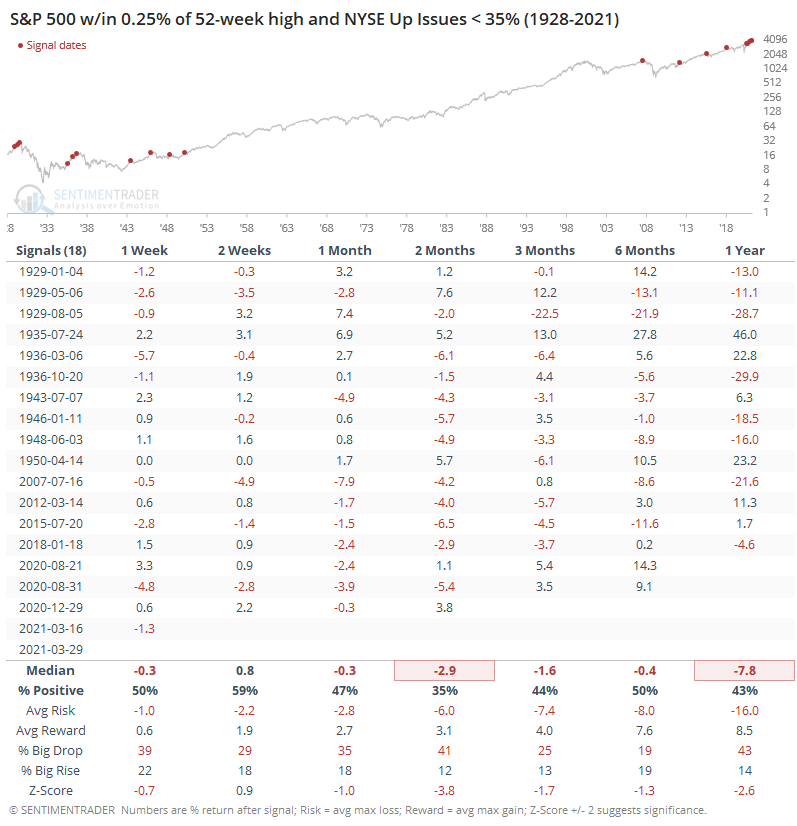
In terms of what those weak days meant for forward returns, the table below shows us that the S&P had some trouble holding near its highs when so many stocks had been declining under the surface. Every signal in the past 30 years showed a negative 1-month return.
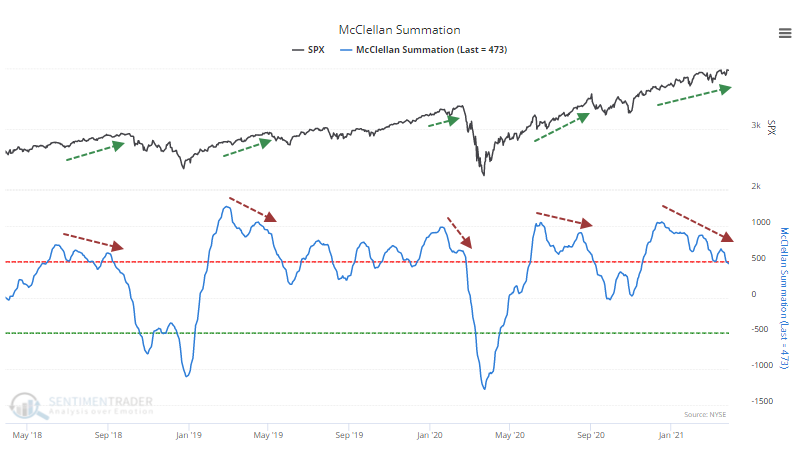
It's not just Monday, though. Over the past week, even with the S&P ticking a new high on Friday, the McClellan Oscillator has been deeply negative.
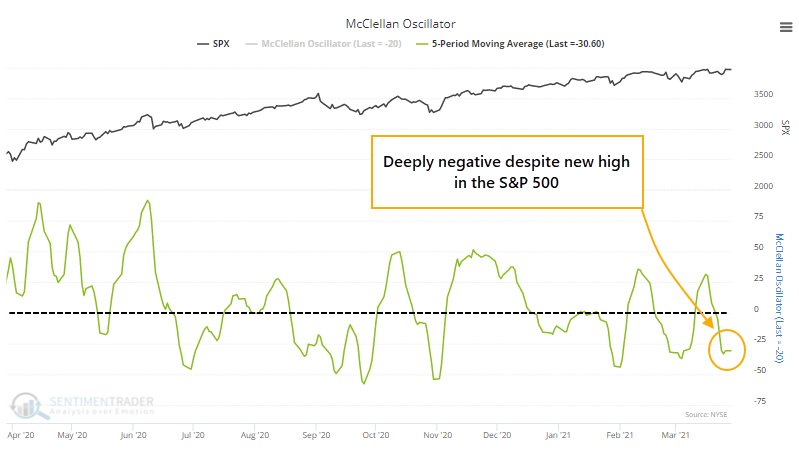
This means that the longer-term McClellan Summation Index has been dropping and diverging from price.
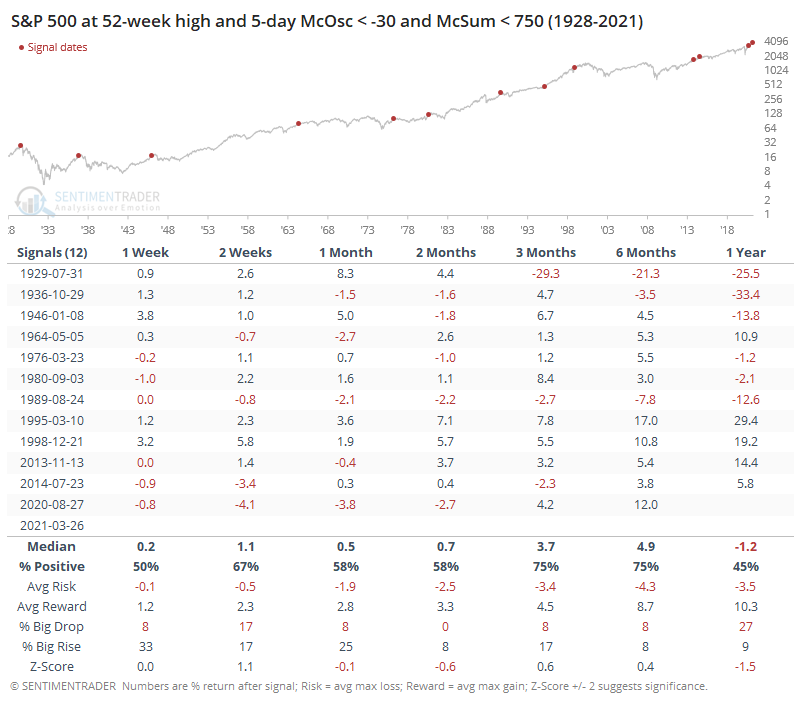
While not as consistent, again the S&P had some trouble consistently maintaining upside momentum under similar conditions. The two biggest exceptions were in 1995 and 1998. Really, those were the only exceptions.
Ever since we started to generate optimistic extremes months ago, we've been on the lookout for oddities like this, signs of internal weakness and deterioration that wouldn't necessarily be visible if we were just watching the price action of major indexes. There were some spotty examples in January, but those ended up getting resolved with more strength.
We're still not seeing broad-based internal weakness, at least enough to generate major warning signs. But the more we see activity like Monday, and continued weakness in measures like the Oscillator and Summation Index, the higher we'll end up generating more of those warnings.