Products
SentimenTrader Trading Tools
‍
Backtest Engine
My Trading Toolkit
Correlation Analysis
Seasonality
Indicators & Data API
‍
Proprietary Indicators & Charts
Market Data API
Strategies & Scanner
‍
50+ Trading Strategies
Smart Stock Scanner
Research Reports
‍
Research Solutions
Reports Library
Free Resources
Simple Backtest Calculator
Simple Seasonality Calculator
The Kelly Criterion Calculator
Sentiment Geo Map
Public Research Reports
Education
Sentiment Indicators
Technical Indicators
Pricing
Company
About
In the News
Testimonials
Client Success Stories
Contact
Log inLoginSign up
< BACK TO ALL REPORTS

Investors Are Shoveling Money Into Stocks at a Record Pace

Jason Goepfert
2021-07-08
Through June, equity mutual funds and ETFs are showing the largest inflow in 20 years.

Stocks keep hitting records, there hasn't been even a pullback for six months, and investors are feeling good. And what do investors do when they're feeling good? Why, they add to their bets, of course.

Through June, equity mutual funds and ETFs have taken in more than $122 billion in assets, according to Lipper. That's the best first half for flows in almost 20 years. The only first half that exceeds this flow, in or out, was the pandemic-inspired outflow last year.

Equity fund flow through June

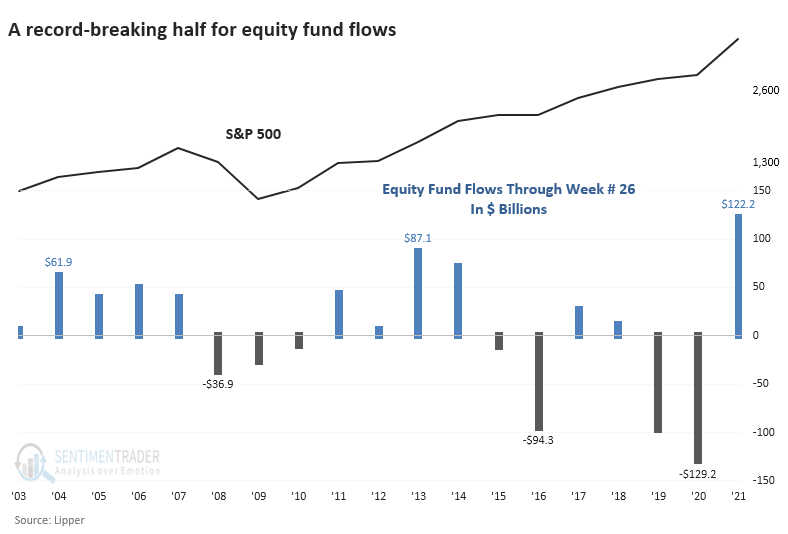
This is a bit restrictive since it's only looking at flows through the first half of each year, but it's still more extreme than any other 6-month stretch in 20 years. 

If we remove the calendar and just look at every rolling 6-month period, we're still seeing a record flow. While it exceeds the prior record from 2013, it only reverses some of the outflows from 2019 - 2020. 

This is also a bit misleading because it ignores the fact that the overall size of the market has grown.

When we adjust fund flows for the total market capitalization of the U.S. stock market, then the past six months don't seem to be as much of a driver as other periods. It's less than half the extremes reached in 2003, 2011, and 2013.


What else we're looking at

  • A look at fund flows relative to total market capitalization, and what it suggests for future returns
  • The EEM emerging markets ETF has declined for 6 straight days - what happened after similar streaks
  • What it means when Heavy Truck Sales are holding above trend
  • Almost no countries are outperforming the U.S., and that hasn't been a good sign

Stat box

The Nasdaq Composite closed at a new high on Wednesday while fewer than 35% of stocks in the index advanced. That's the 2nd day in a row this has happened, marking the first time since at least 1984 that the index has hit consecutive highs with such low participation.

Etcetera

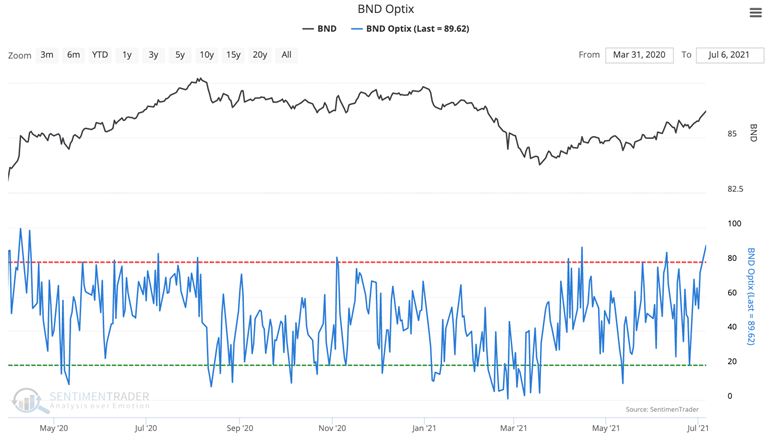
Bond crazy. The Vanguard Total Bond Market fund, BND, has hit its highest Optimism Index since April 2020, rising to 89.6. Our Backtest Engine shows a negative average return up to two weeks later after other readings above 89.5.

bnd bond market etf optimism index sentiment

Enigmatic espresso. Commercial hedgers in coffee reached their largest short exposure in history at the beginning June. They have covered some of those positions in the last few weeks but remain heavily short.coffee commercial hedgers position

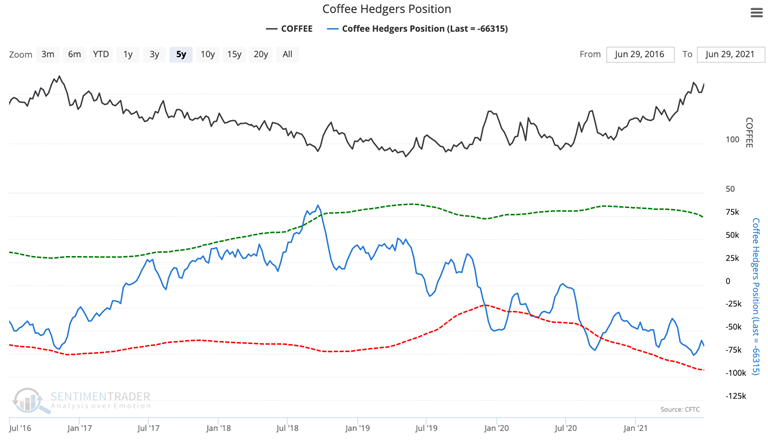
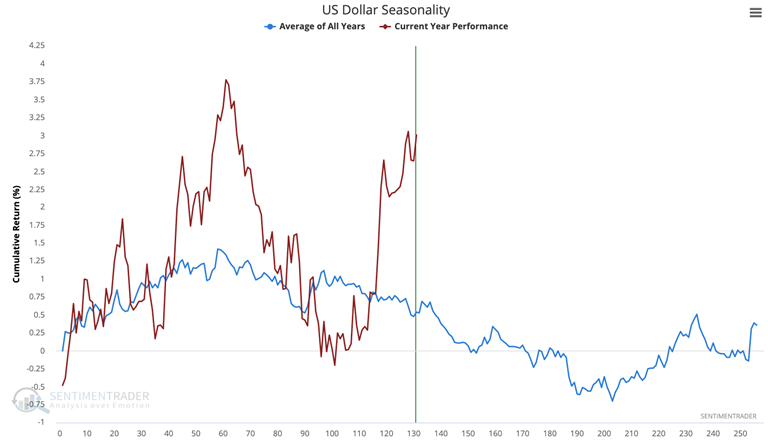
Cash out. U.S. Dollar Seasonality is showing a downtrend until the fall. This year has been particularly volatile, even though it has adhered roughly to the general seasonal pattern.

us dollar seasonality

PRODUCTS
SentimenTrader
Trading Tools
Indicators & Data API
‍
Strategies & Scanner
‍
Research Reports
FREE
RESOUrCES
Simple Backtest
Calculator
Simple Seasonality
Calculator
The Kelly Criterion
Calculator
Sentiment Geo Map
‍
Public Research Reports
‍
Education
Sentiment Indicators
‍
Technical Indicators
‍
Pricing
Bundle pricing
‍
FAQ
‍
Announcements
‍
COMPANY
‍
About
‍
In the News
‍
Testimonials
‍
Client Success Stories
CONTACT
‍
General Inquiries
‍
Media Inquiries
‍
Financial Professionals Inquiries
‍
© 2025 Sundial Capital Research Inc. All rights reserved.
Setsail Marketing
TermsPrivacyAffiliate Program
Risk Disclosure: Futures and forex trading contains substantial risk and is not for every investor. An investor could potentially lose all or more than the initial investment. Risk capital is money that can be lost without jeopardizing ones’ financial security or life style. Only risk capital should be used for trading and only those with sufficient risk capital should consider trading. Past performance is not necessarily indicative of future results.

Hypothetical Performance Disclosure: Hypothetical performance results have many inherent limitations, some of which are described below. No representation is being made that any account will or is likely to achieve profits or losses similar to those shown; in fact, there are frequently sharp differences between hypothetical performance results and the actual results subsequently achieved by any particular trading program. One of the limitations of hypothetical performance results is that they are generally prepared with the benefit of hindsight. In addition, hypothetical trading does not involve financial risk, and no hypothetical trading record can completely account for the impact of financial risk of actual trading. for example, the ability to withstand losses or to adhere to a particular trading program in spite of trading losses are material points which can also adversely affect actual trading results. There are numerous other factors related to the markets in general or to the implementation of any specific trading program which cannot be fully accounted for in the preparation of hypothetical performance results and all which can adversely affect trading results.

Testimonial Disclosure: Testimonials appearing on this website may not be representative of other clients or customers and is not a guarantee of future performance or success.