Investors' Cash Balances Struggling to Swallow Smart Money Supply

There are near-record amounts of cash ready to be deployed into markets...and corporations are doing their best to drain it.
Investors have a near-record amount of cash ready to invest in stocks (or whatever else), a bullish indication of "cash on the sidelines" as deceptive as that clichè is. According to the Investment Company Institute, investors hold more than $4.5 trillion (with a "t") in money market funds.
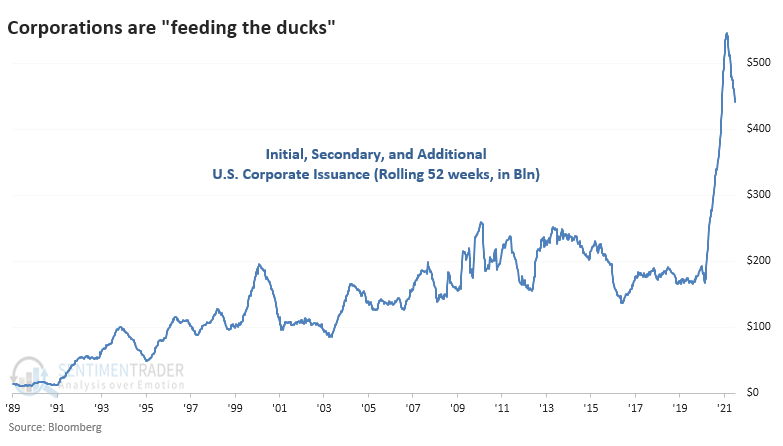
And yet corporations are issuing a record amount of stock, a bearish indication of supply and smart-money selling pressure. Bloomberg data shows that U.S. corporations have issued more than $450 billion in stock via IPOs, secondary, and additional offerings over the past 52 weeks.
Bullish investors will give more credence to the former; bearish investors the latter. There is little question that both are factual, and it's a relatively unusual situation. Usually, when corporations are issuing boatloads of stock, investors have small cash reserves and vice-versa; when corporations can't issue shares due to lack of demand, investors are usually hoarding cash at the time.
It's rare to see such high levels at the same time. If we look at a ratio of the two, then things become a bit clearer.
During the pandemic panic, the ratio neared 30 and was the highest in 30 years. In other words, there was 28 times more cash available than shares offered in supply. There are ways to quibble with the technicals, but it's simply meant as a reflection of sentiment.
Over the past year, the ratio has declined steadily as supply ramped up. Corporations are "feeding the ducks," as the saying goes. Even though money market assets haven't been drained much, the skyrocketing supply has caused the ratio to drop below 10 for the first time since the year 2000.

What else we're looking at
- A deeper look at money market assets and the ratio to corporate stock issuance
- What it means when individual investors become bearish with stocks near their highs
- A detailed look at the surge in natural gas prices and the futures curve
- Small-cap stocks are entering a seasonal soft spot
| Stat box Natural gas futures prices have skyrocketed by 110% over the past 6 months. That's the most since 2004 and ranks as the 5th-largest 6-month return in 30 years. |
Etcetera
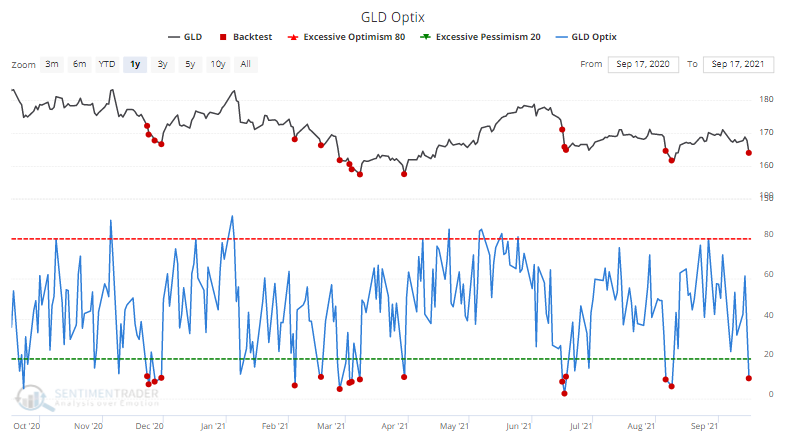
Less shiny. The Optimism Index on the GLD gold fund plunged below 11.5% on Thursday, one of its lowest levels in a year. Our Backtest Engine shows that GLD rallied over the next week after 13 out of 16 prior signals.
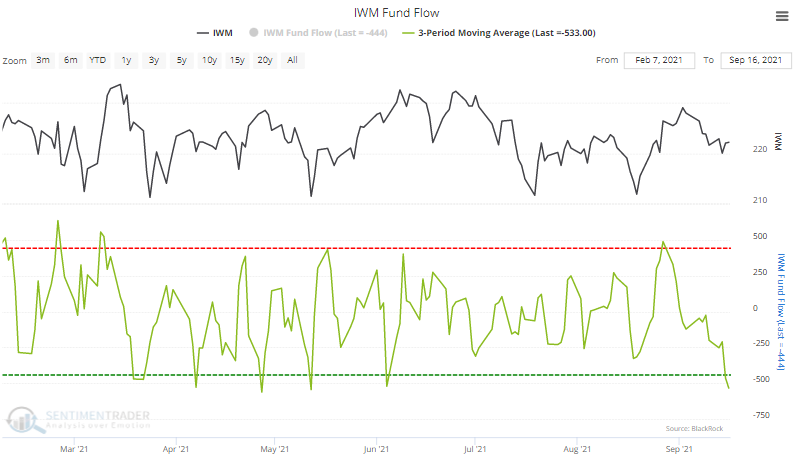
Go big or go home. Over the past 3 sessions, the IWM small-cap ETF has lost an average of more than $500 million in assets per day. That's the 2nd-largest amount since small-caps entered their trading range in February.
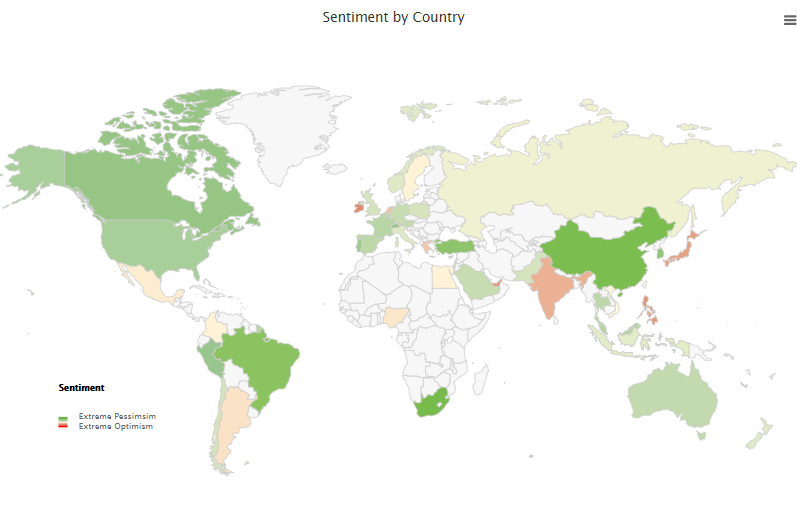
A mostly pessimistic world. Our Optimism Index Geo-Map shows that investors in most parts of the world are showing pessimism (the deeper the green color, the more pessimism). Pockets of optimism are seen in Asia, including India and Japan.