
Island Of Misfit Bears

Island of misfit bears
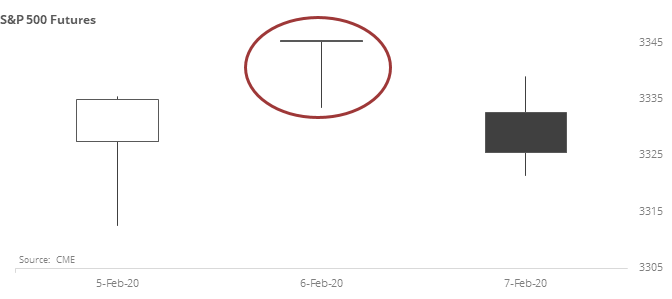
S&P 500 futures carved out an island formation over the past 3 sessions. This is when prices gap up above the prior day’s high, have a good day, then gap down below the high day’s close. It leaves the high day kind of sitting on an island by itself.
It looks ugly on a chart and would be a clear bearish pattern among technicians. It also formed a "hanging man" for those familiar with candlestick formations.
Historically, its record has been mixed. It looks ugly on a chart, and it did pinpoint several important peaks. Very short-term returns were below random, but beyond the first few weeks, there was no negative edge in the risk/reward ratio.
The rise of passive fund flows, along with high-frequency and algorithmic trading, have made price patterns less reliable than in years past and this doesn't look like a consistent reason to become negative beyond maybe a few days.
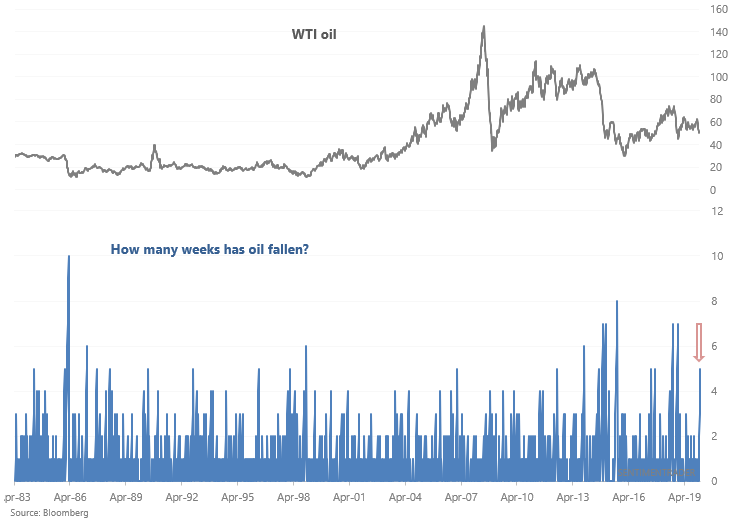
Commodity plunge
Commodities have tanked on global health fears. Among these falling commodities is oil, which is down 5 weeks in a row.
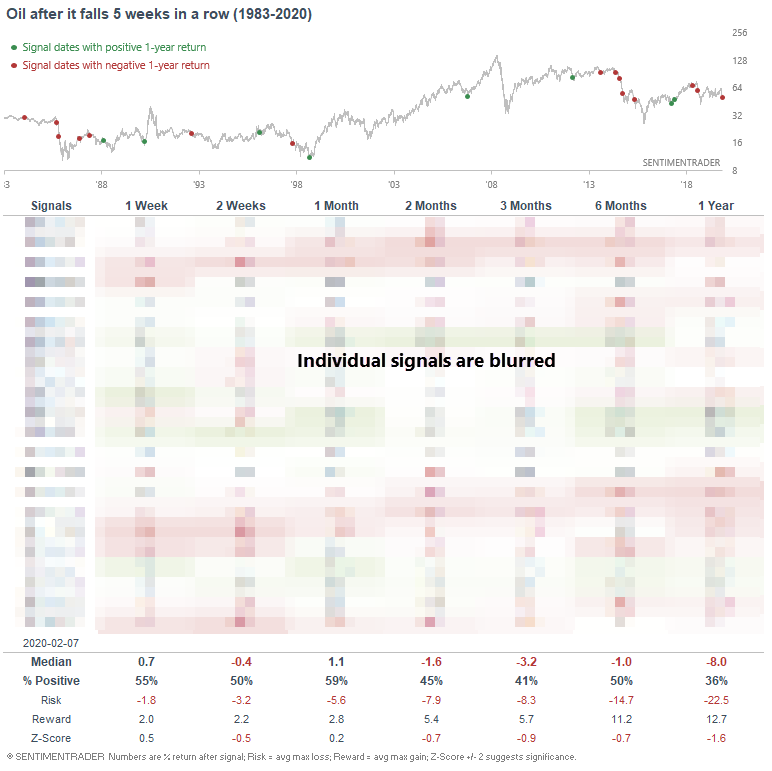
When oil fell 5 weeks in a row, it usually experienced weakness over the next year since many of these historical cases occurred within the context of an oil bear market.
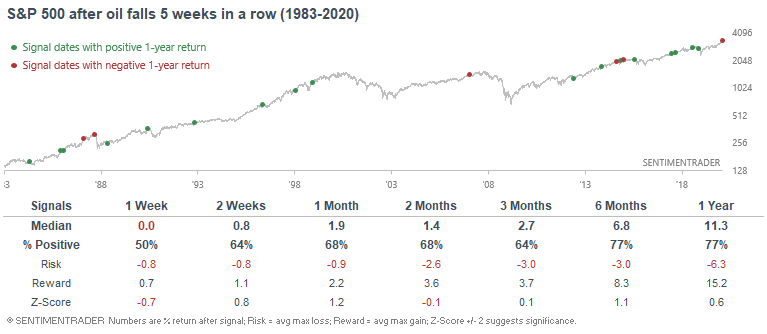
Does this mean that U.S. equities will fall as well, since "coronavirus fears can spill over into the global economy"?
Historically, long DOWN streaks weren't consistently bullish or bearish for the S&P 500:
This is an abridged version of our recent reports and notes. For immediate access with no obligation, sign up for a 30-day free trial now.
We also looked at:
- Energy sector breadth enjoyed a short-term rebound with within longer-term depression
- S&P 500 operating earnings are on track for the best growth in 4 quarters - what it means
- A lot of Nasdaq 100 stocks have been overbought for a long time
- Sentiment has been high for one of the longest streaks in 20 years
- The Nasdaq's 50-day high/low ratio is the highest in years
- An overview of our core fundamental indicators