
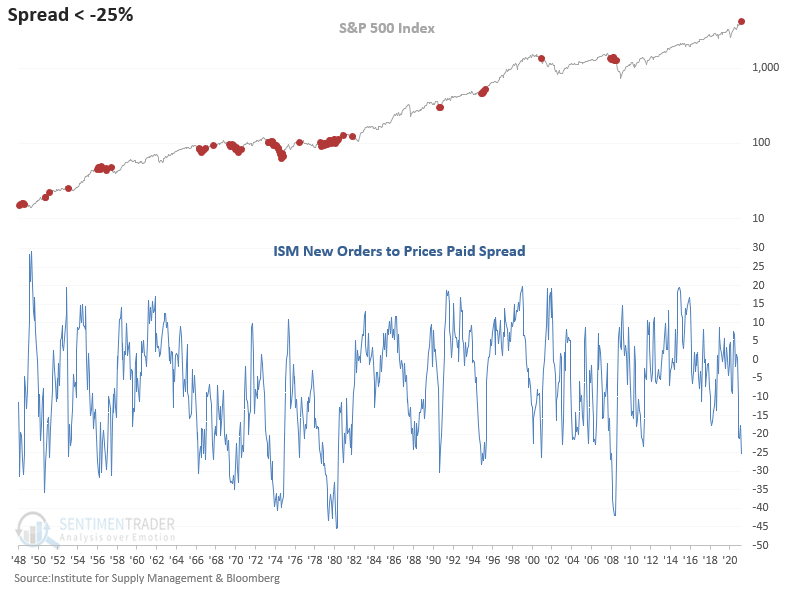
ISM New Orders to Prices Paid Spread

The Institute for Supply Management releases its monthly survey on manufacturing on the first business day of each month. I will be monitoring the upcoming release closely as the April data was significant, especially the prices paid data. While the manufacturing composite index gets the headlines, I like to examine the relationship between two individual components. The spread between new orders and prices paid is an excellent measure for identifying a bullish or bearish macroeconomic backdrop for stock prices.
In anticipation of the upcoming data to be released in early June, let's examine the April data to see what the spread has to say about the current environment for stocks.
HISTORICAL CHART
The April ISM new orders to prices paid spread registered the lowest reading since August 2008.
ANNUALIZED RETURNS FOR S&P 500 (PRICE ONLY)
The S&P 500 index annualizes at a significantly higher rate when the new orders' versus prices paid spread is above zero. If we look at instances when the spread is below -25%, as is the case now, the S&P exhibits negative returns.
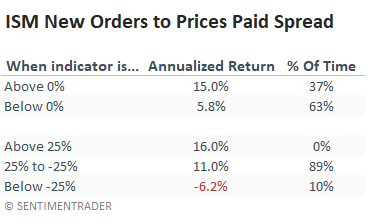
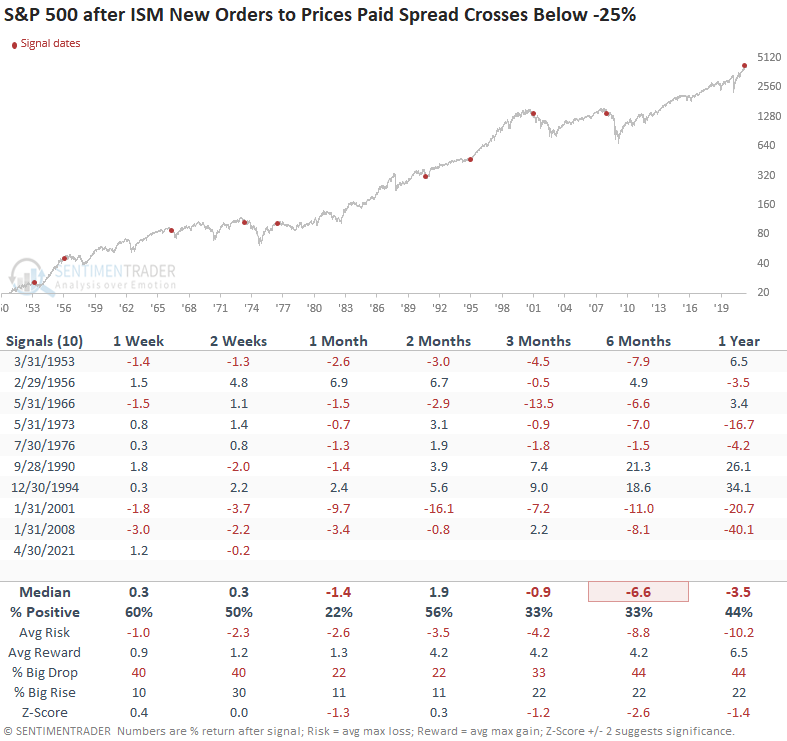
Let's take a look at performance when the spread crosses below -25% for the first time with a signal reset when it crosses back above zero.
HOW THE SIGNALS PERFORMED
While the sample size is small, performance is weak across several timeframes.
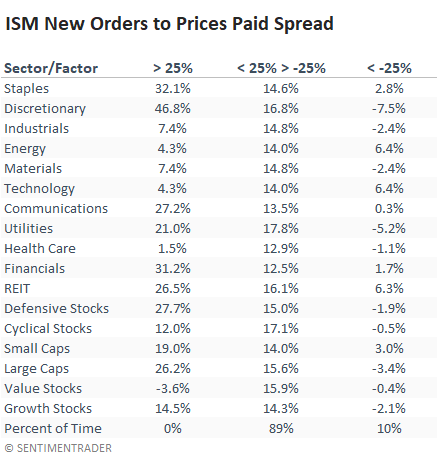
ANNUALIZED RETURNS - SECTORS & FACTORS (TOTAL RETURN)
As was the case with the S&P 500, sectors and factors perform better when the spread is above zero.
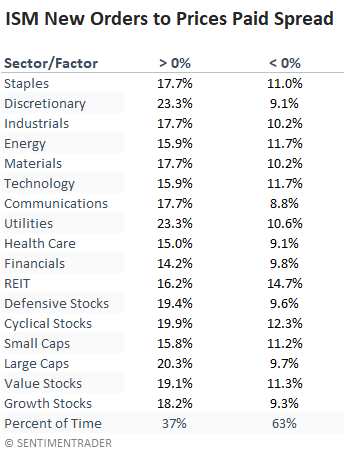
When the spread falls to the current level of -25.3%, annualized returns are challenging across all sectors and factors.
The ISM new orders to prices paid spread suggest that one should expect lower annual returns given the current backdrop. However, we need to be mindful that historical relationships like this may or may not work, given the current federal reserve QE policy.