Products
SentimenTrader Trading Tools
‍
Backtest Engine
My Trading Toolkit
Correlation Analysis
Seasonality
Indicators & Data API
‍
Proprietary Indicators & Charts
Market Data API
Strategies & Scanner
‍
50+ Trading Strategies
Smart Stock Scanner
Research Reports
‍
Research Solutions
Reports Library
Free Resources
Simple Backtest Calculator
Simple Seasonality Calculator
The Kelly Criterion Calculator
Sentiment Geo Map
Public Research Reports
Pricing
Company
About
In the News
Testimonials
Client Success Stories
Contact
Log inLoginSign up
< BACK TO ALL REPORTS

Its Getting Late for Real Estate

Jay Kaeppel
2021-09-01
The real estate sector just completed an impressive run of 10 consecutive "Up" months. Within inflation on the rise, many investors are focused on a continuation of this rally. That said, it should be noted that come mid-September real estate will run into it least favorable time of year. We take a closer look at what this might mean for investors in the real estate sector.

"All good things have to come to an end."

                                    Wise Philosopher ("Unknown")

"Don't stay too late, or you'll get in trouble."

                                    Wiser Philosopher ("My Mom")

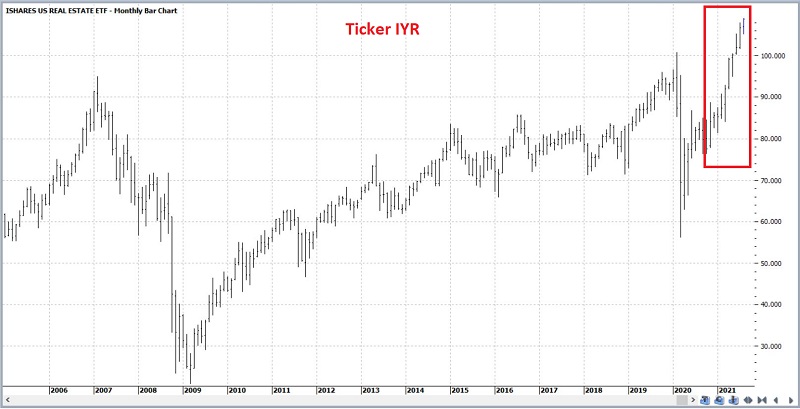
The real estate sector has just done something fairly rare. The chart below (courtesy of ProfitSource) displays the monthly price action for ticker IYR (iShares U.S. Real Estate ETF ) as a proxy for the real estate sector. As you can see in the red box at the far right, IYR just closed higher for the 10th consecutive month.

Is it possible that the real estate sector will "keep on rolling" higher? Of course (it's 2021, for crying out loud). And as an avowed trend follower, I am not one to "sell everything" just because something has supposedly "gone up too much." 

Still, my mom was pretty smart. So, there's also that in the back of my head. But perhaps we should take a slightly more quantitative look.

SEASONALITY

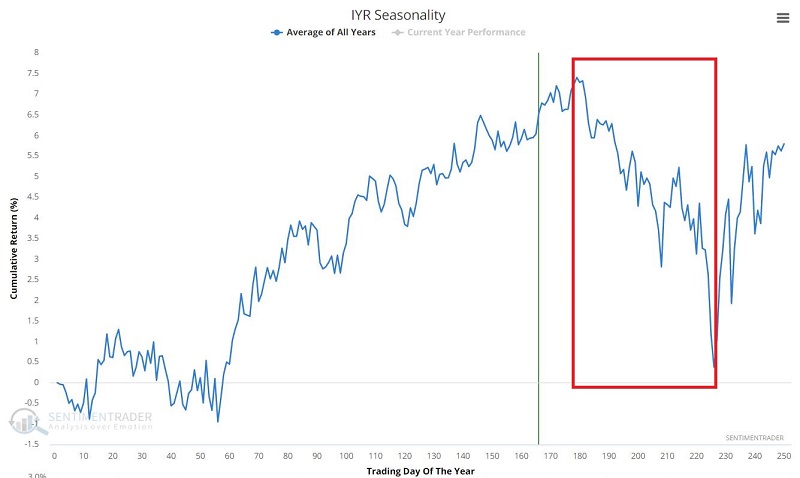
The chart below displays the Annual Seasonal Trend for ticker IYR. While the short-term seasonal trend is still slightly favorable for a few more weeks, there is, um, slight potential for trouble in the months ahead.

The chart below displays:

  • The cumulative % +(-) for the S&P 500 Real Estate sector 
  • Since 1953 
  • If held ONLY from the close on Trading Day of Year #179
  • Through the close on Trading Day of the Year #208

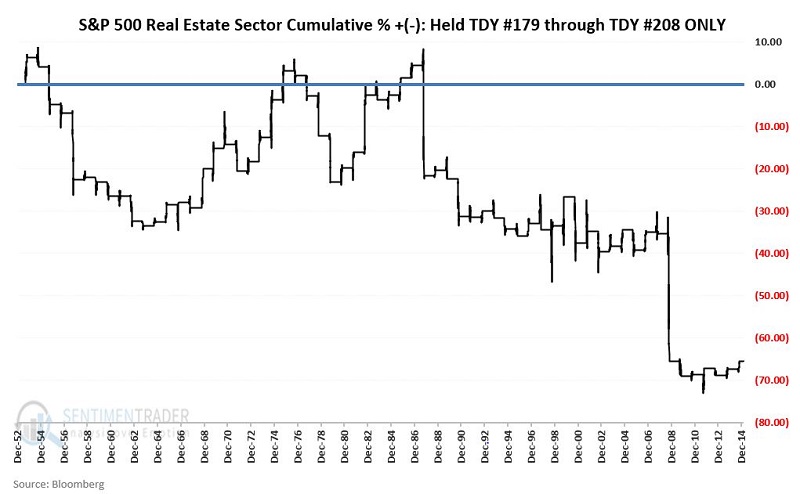
  • Since 1953, the real estate sector has declined -69.3% if held long ONLY from the close on TDY #179 through the close on TDY #208
  • Before "running for the hills," it should be noted that "wins" and "losses" on an annual basis are something of a "coin flip"

The chart below displays the year-by-year percent return for the S&P 500 Real Estate sector from TDY #179 through TDY #208.
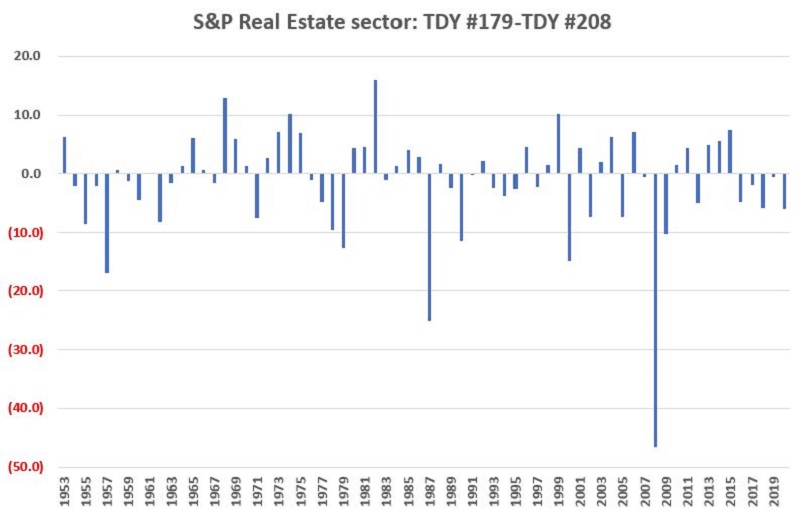
The key points:

  • Real estate DOES NOT decline every year during this time period
  • The problem is that when this sector is bad, it tends to be very bad

For the record, during the TDY #179 through TDY #208 period, the S&P 500 Real Estate sector:

  • UP 33 times
  • DOWN 35 times
  • Average UP = +4.8%
  • Average DOWN = (-7.9%)

REGARDING 2021

So, will real estate swoop or soar - or do something in between - during this seasonally unfavorable period in 2021? There is no way to predict. But from a real-world trading perspective, there are a few things to consider.

It is interesting to note that despite the impressive nature of the relentless advance over the last 10 months for real estate, it just barely outperformed the S&P 500 Index (+40.4% for IYR versus +38.3% for SPX). 

The chart below (courtesy of Stockcharts) displays the relative performance for IYR versus ticker SPY over the past 5 years, along with a 104-week exponential moving average. 

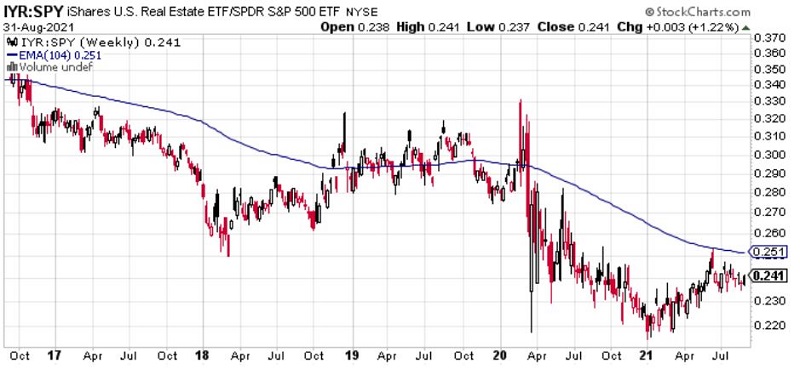
Real estate relative performance has clearly picked up since January 1st, but the overall long-term trend still favors the broader market (SPY). The point: 

  • Despite the terrific performance since October, real estate has not been a massive outperformer

The "seasonally unfavorable" period this year extends from the close on 9/17/2021 through the close on 10/28/2021.

Sorry, you don't have access to this report

Upgrade your subscription plan to get access
Go to Dasboard
PRODUCTS
SentimenTrader
Trading Tools
Indicators & Data API
‍
Strategies & Scanner
‍
Research Reports
FREE
RESOUrCES
Simple Backtest
Calculator
Simple Seasonality
Calculator
The Kelly Criterion
Calculator
Sentiment Geo Map
‍
Public Research Reports
‍
Pricing
Bundle pricing
‍
Announcements
‍
FAQ
COMPANY
‍
About
‍
In the News
‍
Testimonials
‍
Client Success Stories
CONTACT
‍
General Inquiries
‍
Media Inquiries
‍
Financial Professionals Inquiries
‍
© 2025 Sundial Capital Research Inc. All rights reserved.
Setsail Marketing
TermsPrivacyAffiliate Program
Risk Disclosure: Futures and forex trading contains substantial risk and is not for every investor. An investor could potentially lose all or more than the initial investment. Risk capital is money that can be lost without jeopardizing ones’ financial security or life style. Only risk capital should be used for trading and only those with sufficient risk capital should consider trading. Past performance is not necessarily indicative of future results.

Hypothetical Performance Disclosure: Hypothetical performance results have many inherent limitations, some of which are described below. No representation is being made that any account will or is likely to achieve profits or losses similar to those shown; in fact, there are frequently sharp differences between hypothetical performance results and the actual results subsequently achieved by any particular trading program. One of the limitations of hypothetical performance results is that they are generally prepared with the benefit of hindsight. In addition, hypothetical trading does not involve financial risk, and no hypothetical trading record can completely account for the impact of financial risk of actual trading. for example, the ability to withstand losses or to adhere to a particular trading program in spite of trading losses are material points which can also adversely affect actual trading results. There are numerous other factors related to the markets in general or to the implementation of any specific trading program which cannot be fully accounted for in the preparation of hypothetical performance results and all which can adversely affect trading results.

Testimonial Disclosure: Testimonials appearing on this website may not be representative of other clients or customers and is not a guarantee of future performance or success.