
Just about everything is underperforming the S&P 500

Key points:
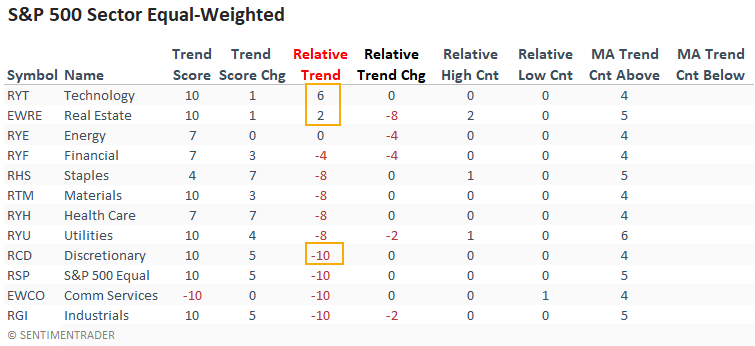
- Large-cap technology maintains the best trends on an equal and cap-weighted basis
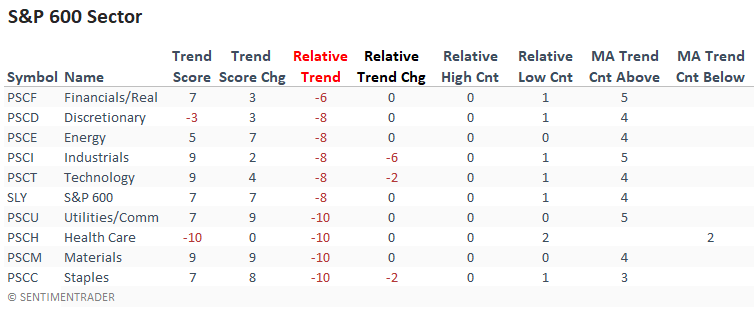
- Relative trends suggest one should favor large-cap over small-cap
- Global index trends remain unfavorable relative to the U.S.
Technology, discretionary, and real estate lead with an asterisk by discretionary
The technology and consumer discretionary sectors maintain perfect absolute and relative trend scores. And, technology is the only sector with an offensive tilt to register a new relative high last week. Real estate showed a modest decline on a relative basis. However, the sector continues to exhibit healthy trends.
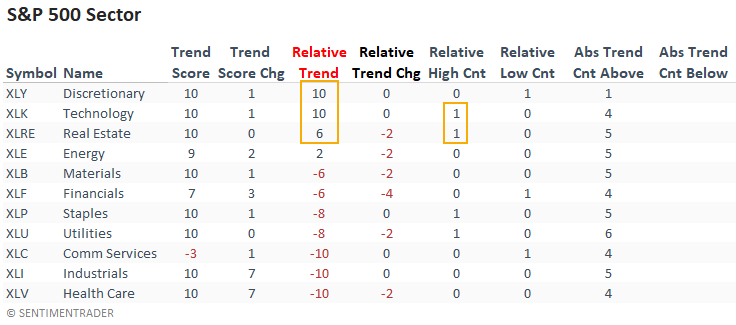
While the equal-weighted technology sector shows a relative trend score more in line with the cap-weighted data, the discretionary group significantly differs between the two methodologies for weighting index members. If you were wondering, the 20 point spread between the relative trend scores for discretionary stocks has only occurred 6 other times since 1960.
Relative trends for small-cap sectors look abysmal, with not a single positive score. If we compare relative highs to relative lows, we see lows outnumber highs.
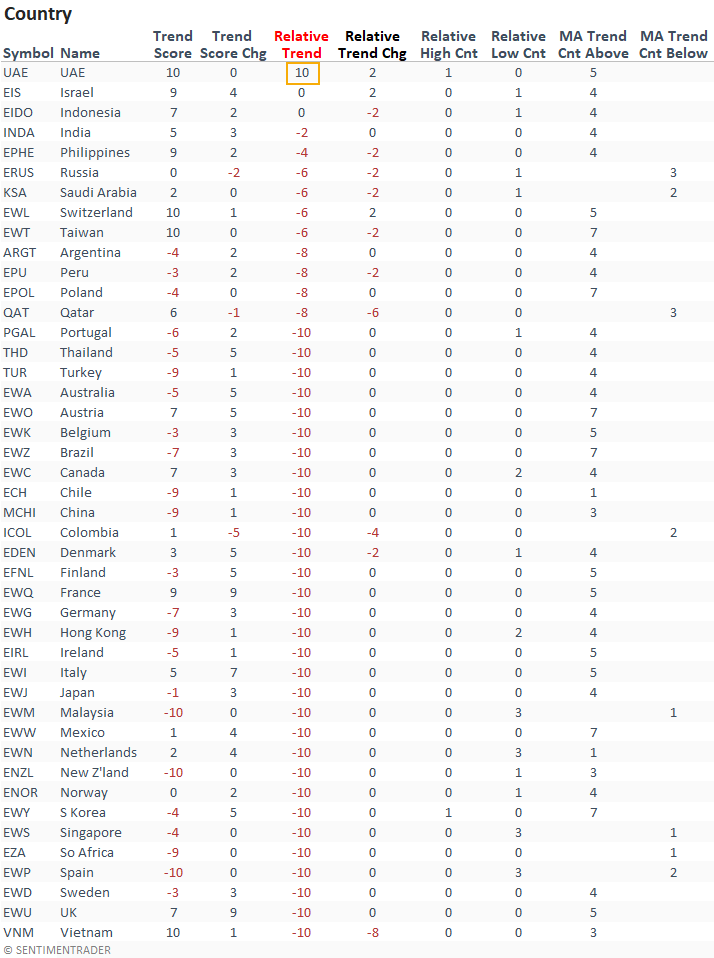
Overseas indexes continue to show poor relative trends
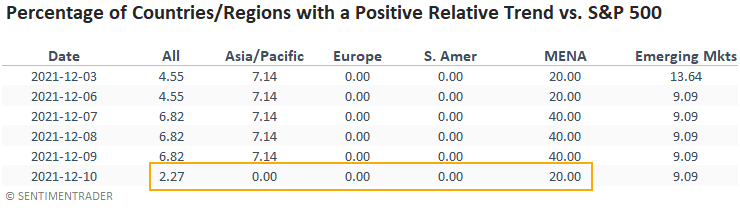
The United Arab Emirates ETF (UAE) is the only country with a positive relative trend score out of the 44 countries I monitor. And, the number of countries with a relative trend score of -10 continues to expand to an alarming level.
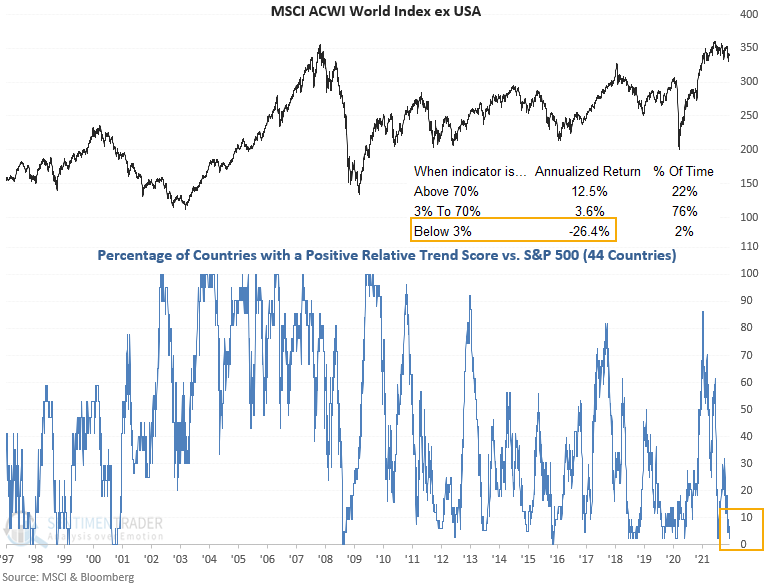
The percentage of countries with a positive relative trend score versus the S&P 500 declined to the lowest level since July. When country ETFs underperform to this extent, annualized returns for a broad-based global equity allocation are unfavorable.
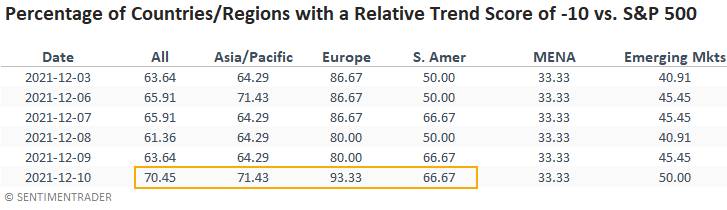
The percentage of countries with a relative trend score of -10 increased to the highest level since May 2020. Foward returns look extremely unfavorable when so many have such negative trends.
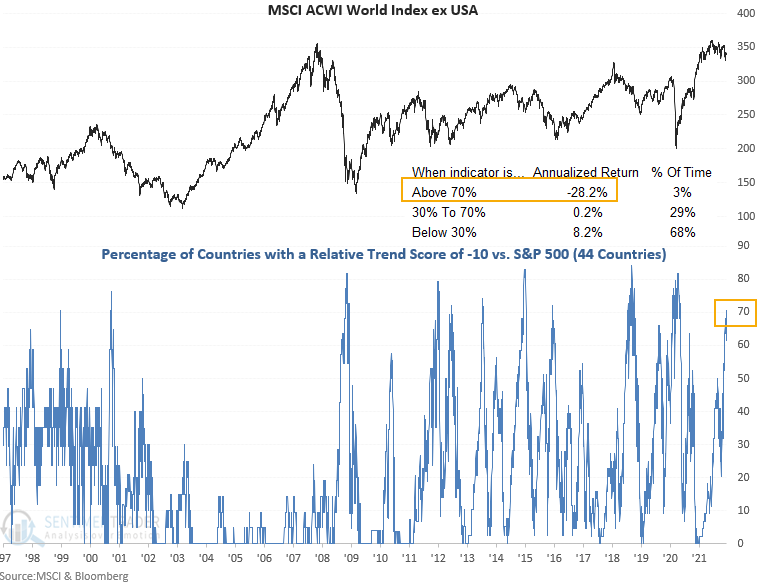
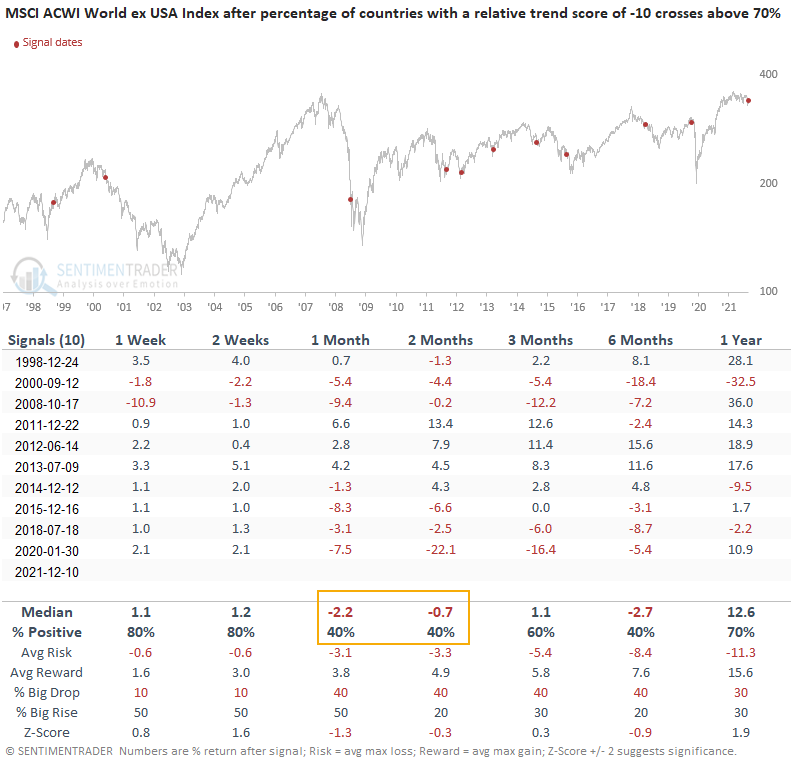
Let's conduct a study to assess the outlook for the MSCI ACWI World ex USA Index when the percentage of countries with a relative trend score crosses above 70%. I used a cross below 25% to screen out repeats and identify the first instance after a reset.
Similar signals preceded weak returns on a medium-term basis
This signal triggered 10 other times over the past 24 years. After the others, future returns and win rates were weak in the 4-8 week time frame. However, the 1-2 week window suggests there is potential for a mean reversion bounce. If we look out 6 months, 8 out of 10 instances showed negative returns at some point. Besides 1998, this type of relative underperformance is most often associated with risk-off periods for the market.
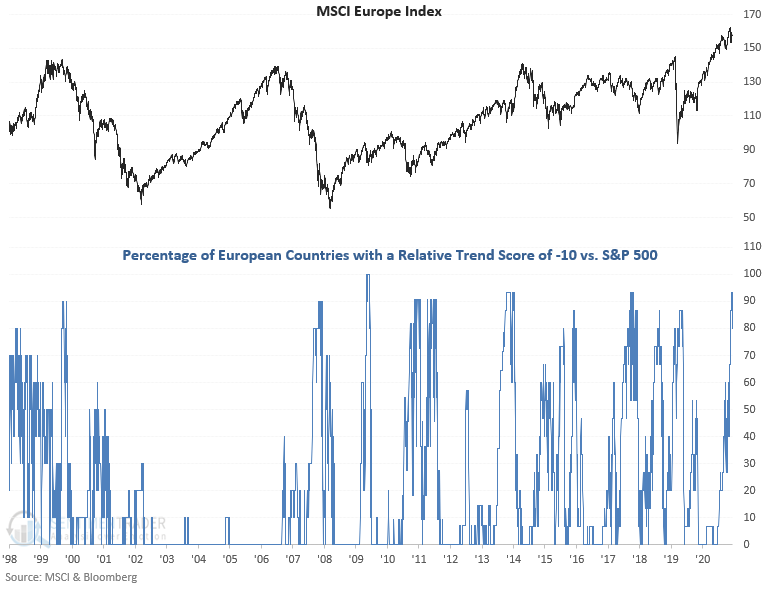
The percentage of Eurozone country ETFs with a relative trend score of -10 surged to the highest level since October 2018.
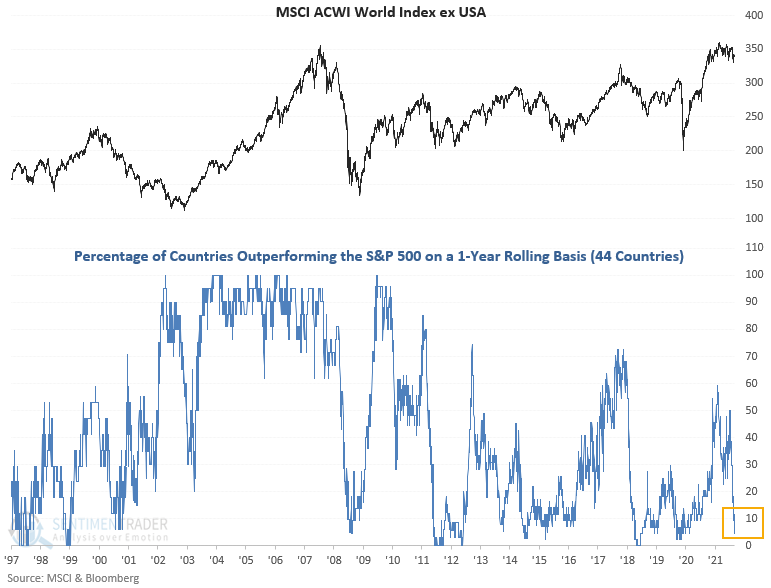
Just about everything is underperforming the S&P 500
The percentage of country ETFs outperforming the S&P 500 on a rolling 1-year basis has fallen to the lowest level since May 2020.
What the research tells us...
An in-depth look at where investors are focusing in sectors shows a handful of groups are driving S&P 500 performance with technology providing the most significant attribution.
Strength is primarily evident in the U.S., with overseas indexes showing an alarming level of relative underperformance. When trends were lagging like this in the past, annualized returns in the MSCI indexes have been poor.