Products
SentimenTrader Trading Tools
‍
Backtest Engine
My Trading Toolkit
Correlation Analysis
Seasonality
Indicators & Data API
‍
Proprietary Indicators & Charts
Market Data API
Strategies & Scanner
‍
50+ Trading Strategies
Smart Stock Scanner
Research Reports
‍
Research Solutions
Reports Library
Free Resources
Simple Backtest Calculator
Simple Seasonality Calculator
The Kelly Criterion Calculator
Sentiment Geo Map
Public Research Reports
Pricing
Company
About
In the News
Testimonials
Client Success Stories
Contact
Log inLoginSign up
< BACK TO ALL REPORTS

Keeping an eye on natural gas

Dean Christians
2021-05-20
Let's assess the future outlook for natural gas when the market is in backwardation and approaching the seasonally weak summer months.

The natural gas one-year futures spread as a percent of the first contract price has increased to a pay attention level, especially given the upcoming seasonal outlook. According to my calculation, the spread currently resides at 11.82% as of the close on 5/19/21. When the current spot price is higher than prices maturing in the coming months, the market reflects backwardation. Backwardation means that the current spot price is too high and is likely to fall in the future.  

FUTURES CONTRACTS

  • Generic 1st Natural Gas (NG1)
  • Generic 13th Natural Gas (NG13)

SPREAD CALCULATION

Spread = (NG1-NG13)/(NG1)*100

Let's assess the future outlook for natural gas when the market is in backwardation and approaching the seasonally weak summer months.

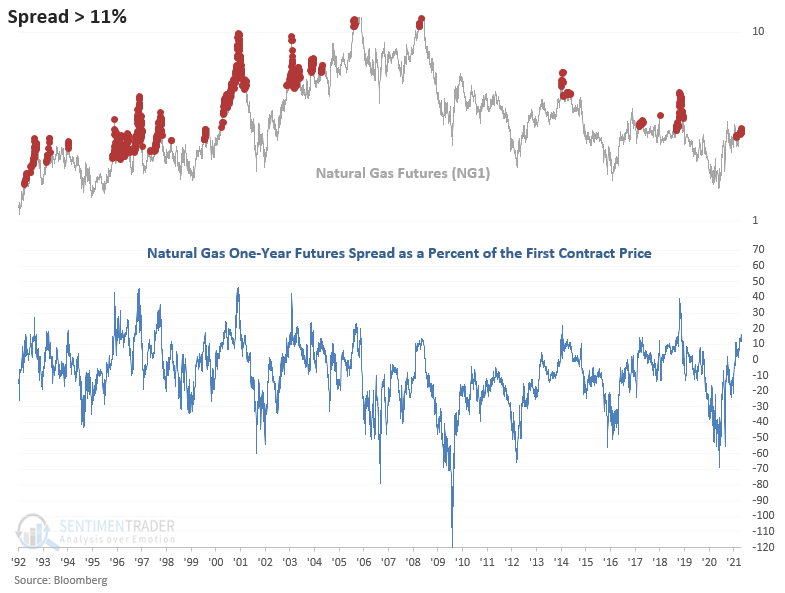
HISTORICAL SPREAD CHART

As shown in the chart below, the natural gas spread has reached one of the highest levels in the last decade. I would also like to highlight the character change in the data since the advent of fracking. Spread levels above 11% percent have been less frequent since 2004.

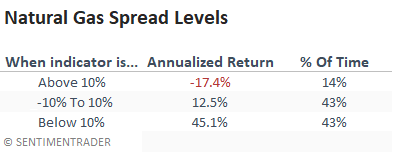
HISTORICAL ANNUALIZED RETURN SPREAD LEVELS 

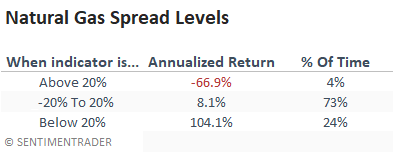
As shown in the table below, spread readings above 10% suggest poor annualized returns. If the indicator increases above 20%, watch out below.

NATURAL GAS SEASONALITY

Natural gas has had a seasonal tendency toward weakness into June/July.

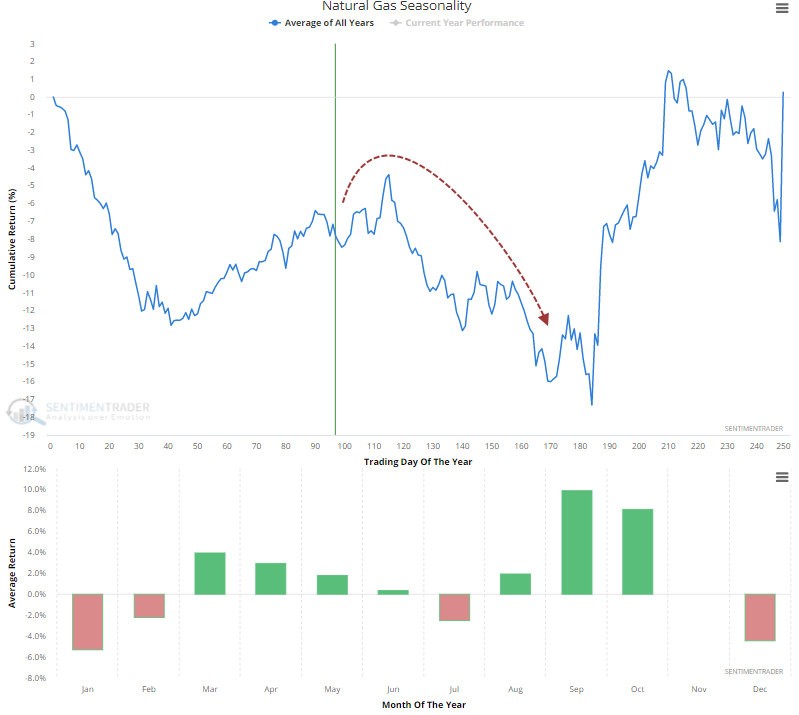
The table below highlights the seasonality trend for natural gas. July is one of the weaker months of the year, especially in the last eight years.

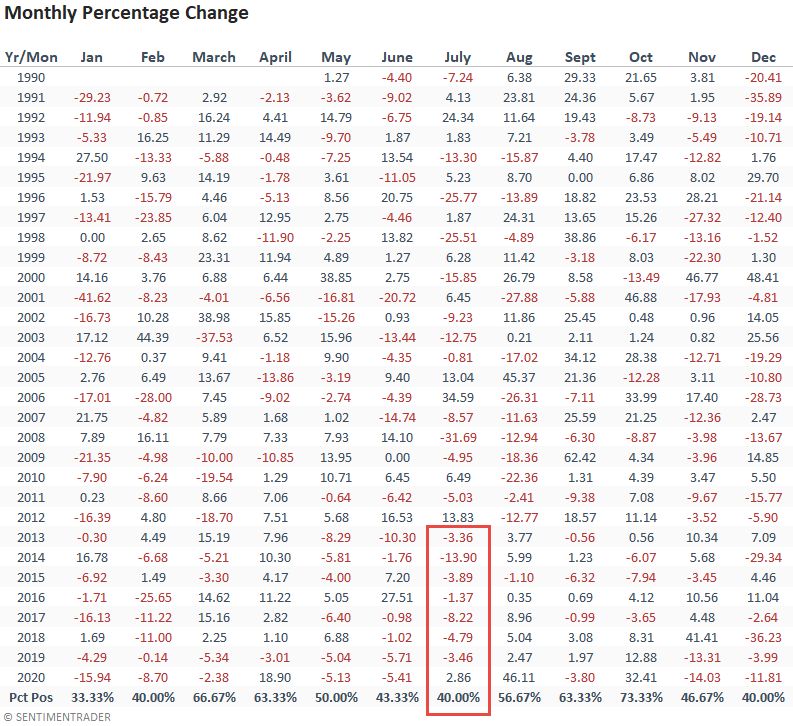
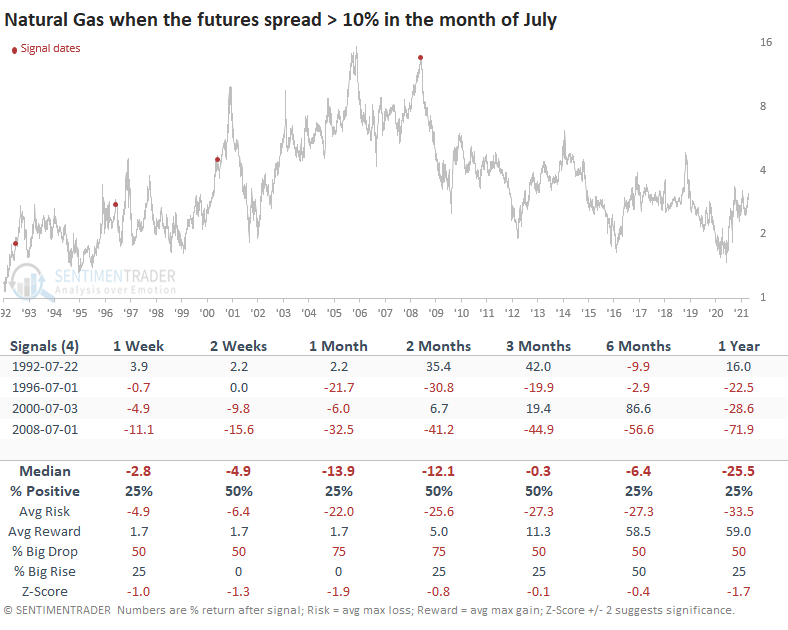
Let's combine the high spread level with seasonality to create a study that buys natural gas when the spread is greater than 10% in July.

I use a 1-month holding period to avoid repeats.

HOW THE SIGNALS PERFORMED - JULY

While the sample size is small, the returns are weak.

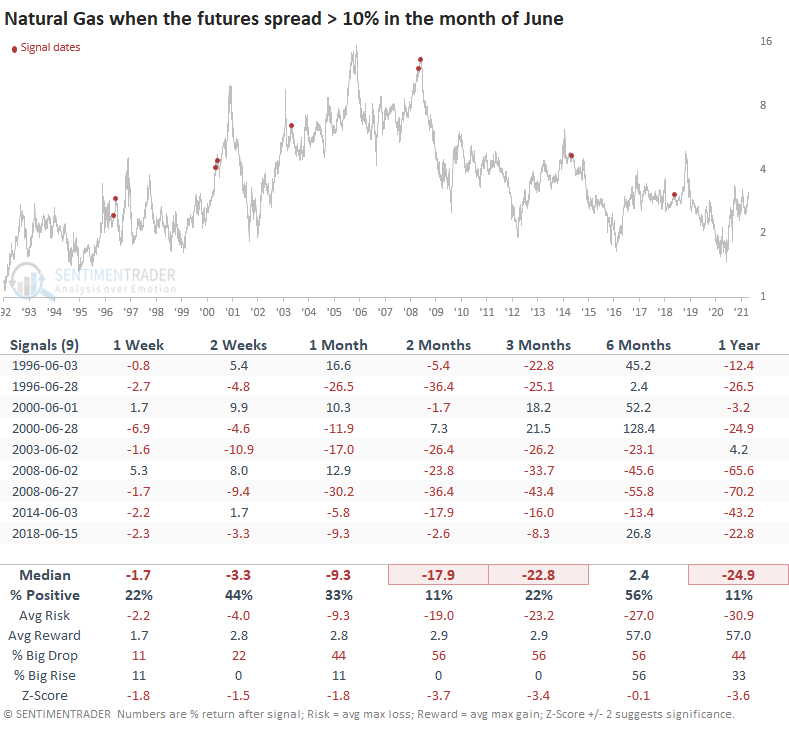
Let's conduct the same study, but modify the month to June.

HOW THE SIGNALS PERFORMED - JUNE

Except for the 6-month window, performance looks weak across all timeframes.

Please remember this study is not a trading recommendation. My note intends to highlight historical conditions that may or may not come to fruition in the future.

Sorry, you don't have access to this report

Upgrade your subscription plan to get access
Go to Dasboard
PRODUCTS
SentimenTrader
Trading Tools
Indicators & Data API
‍
Strategies & Scanner
‍
Research Reports
FREE
RESOUrCES
Simple Backtest
Calculator
Simple Seasonality
Calculator
The Kelly Criterion
Calculator
Sentiment Geo Map
‍
Public Research Reports
‍
Pricing
Bundle pricing
‍
Announcements
‍
FAQ
COMPANY
‍
About
‍
In the News
‍
Testimonials
‍
Client Success Stories
CONTACT
‍
General Inquiries
‍
Media Inquiries
‍
Financial Professionals Inquiries
‍
© 2025 Sundial Capital Research Inc. All rights reserved.
Setsail Marketing
TermsPrivacyAffiliate Program
Risk Disclosure: Futures and forex trading contains substantial risk and is not for every investor. An investor could potentially lose all or more than the initial investment. Risk capital is money that can be lost without jeopardizing ones’ financial security or life style. Only risk capital should be used for trading and only those with sufficient risk capital should consider trading. Past performance is not necessarily indicative of future results.

Hypothetical Performance Disclosure: Hypothetical performance results have many inherent limitations, some of which are described below. No representation is being made that any account will or is likely to achieve profits or losses similar to those shown; in fact, there are frequently sharp differences between hypothetical performance results and the actual results subsequently achieved by any particular trading program. One of the limitations of hypothetical performance results is that they are generally prepared with the benefit of hindsight. In addition, hypothetical trading does not involve financial risk, and no hypothetical trading record can completely account for the impact of financial risk of actual trading. for example, the ability to withstand losses or to adhere to a particular trading program in spite of trading losses are material points which can also adversely affect actual trading results. There are numerous other factors related to the markets in general or to the implementation of any specific trading program which cannot be fully accounted for in the preparation of hypothetical performance results and all which can adversely affect trading results.

Testimonial Disclosure: Testimonials appearing on this website may not be representative of other clients or customers and is not a guarantee of future performance or success.