
Late-day selling drives the Smart Money Flow Index to a lower low

Stocks are wildly overvalued, risk is the highest it's ever been, and some of the best investors in history see no reason to deploy cash. That's been the tone of repeated articles in the past week, suggesting that now is no time to buy.
While there isn't always a direct correlation between what respected investors say publicly and what they do privately, some indicators attempt to monitor their activity by looking at how stocks do during various times of the day. The most popular, by far, is some version of the Smart Money Flow Index (SMFI), which looks at trading activity before the close relative to the rest of the day.
The idea is that the most informed investors watch activity during the day, absorb as much information as possible, then transact before the close of regular trading hours. Whether that's actually true or not is debatable. Especially lately, since ETFs have become such a large part of the market and they drive an increasing amount of the volume in the last half hour.
If the smart money really does wait until the waning minutes, then perhaps we have an issue. As Bloomberg notes:
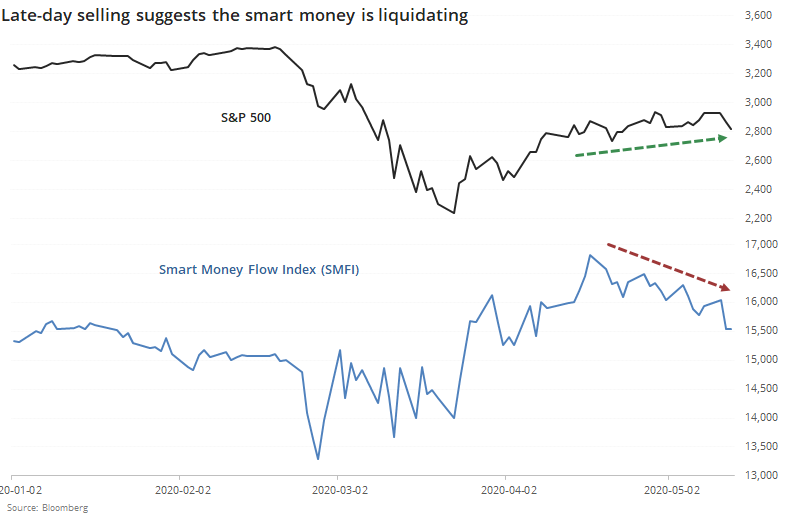
"U.S. stocks have been dropping toward the end of their regular session in the past couple of weeks....the Smart Money Flow Index, which measures the Dow Jones Industrial Average 30 minutes into a session versus the end of the day, has been decreasing in the past few weeks..."
Indeed it has. Over the past month, the S&P 500 has been rising steadily while the SMFI has been declining. Even though it uses the Dow instead of S&P, our version which focuses on the S&P during more narrow windows is also declining quickly.
The question is whether it matters. If we go back to 1970 and look for times when the S&P 500 was below its 200-day moving average and had rallied at least a couple of percent over the past month while the SMFI declined, then we get the following.
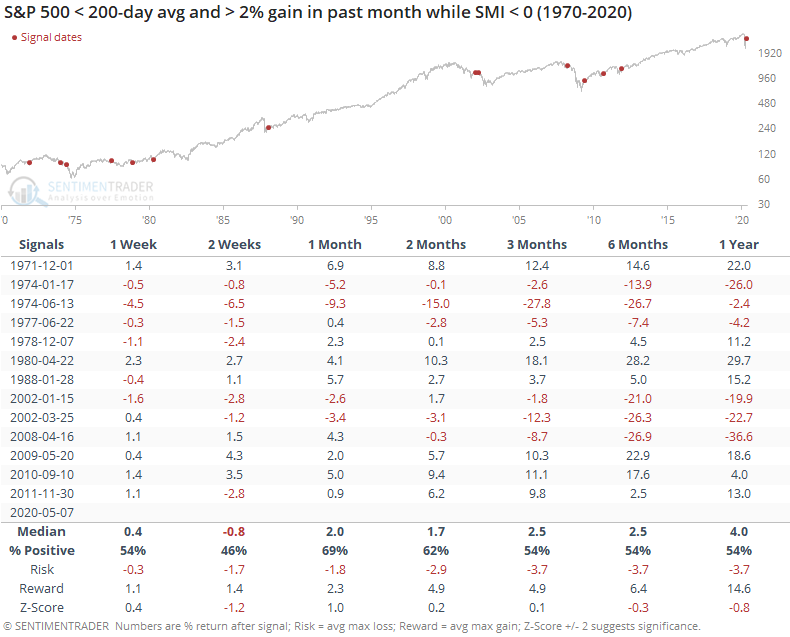
If the S&P rallied during downtrends and the smart money was selling, it dragged on returns over the next couple of weeks. Across the other time frames, its returns were about in line with random. The risk/reward was mostly positive, but unimpressive. There were some very large losses, but also some large gains. This was an inconsistent predictor.
Looked at another way, the table below shows downtrends when the S&P 500 was within 1% of its highest level over the past month, while the SMFI was within 1% of its lowest level.
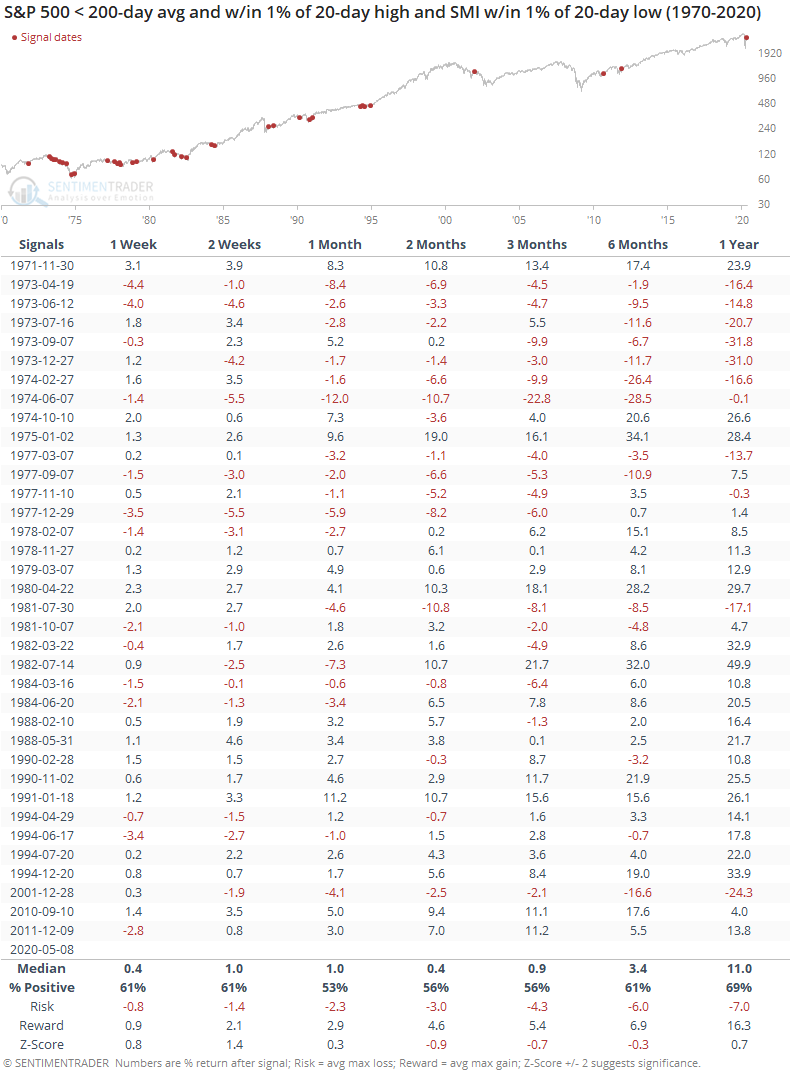
This was quite negative during the 1970s but considerably less so in recent decades.
The idea that we can monitor smart investors by price action alone is an iffy one. It can work when there are very wide divergences or rapid changes, but it has become less of an accurate guide in recent years, most likely due to the influence of passive fund flows and the influence they have over late-day trading activity.
The recent drop in the Smart Money Flow Index might be a worry, but it should be only a minor one at worst.