
Leading Indicators Lag As S&P Suffers Key Reversal

Lagging leading indicators
The Conference Board’s Leading Economic Indicator model is showing its worst growth in years. After the month-over-month reading in the Conference Board’s Leading Economic Index turned barely positive in November, it dropped again in December, with the worst reading in years.
This ends one of the longest streaks of “not bad” readings since 1959.
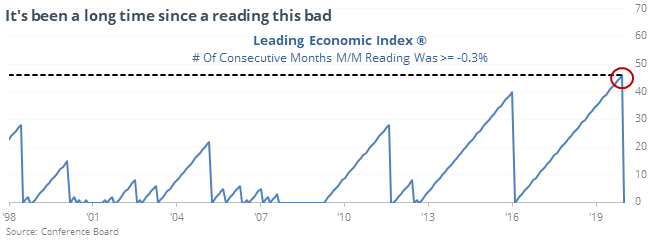
When a long streak of readings higher than this finally ends, and when the LEI m/m is so negative despite stocks being at record highs, both indicate a low probability for further sustained gains over the shorter-term at least for the S&P 500.
Key reversal?
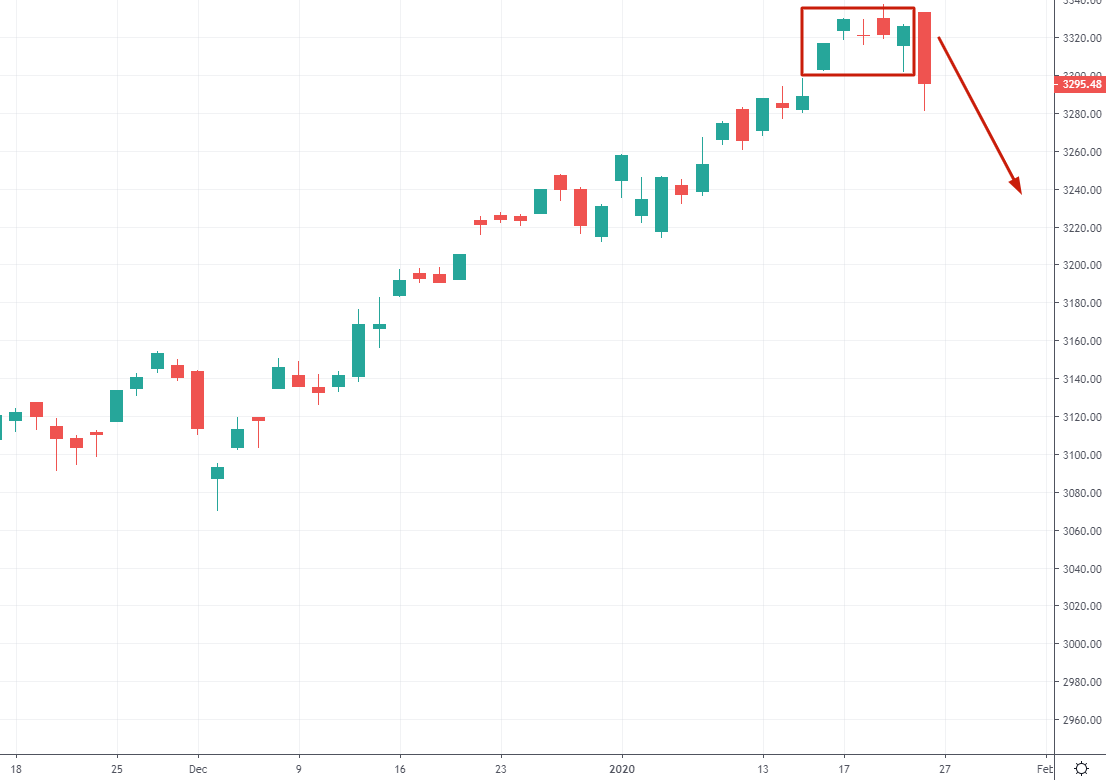
The S&P gapped up on Friday morning then fell throughout the day. As a result, the S&P's OPEN on Friday was above its highest close over the past 5 days, and its CLOSE on Friday was below its lowest close over the past 5 days, triggering what many technicians would consider a key reversal day.
 This reversal pattern often led to short term weakness over the next week.
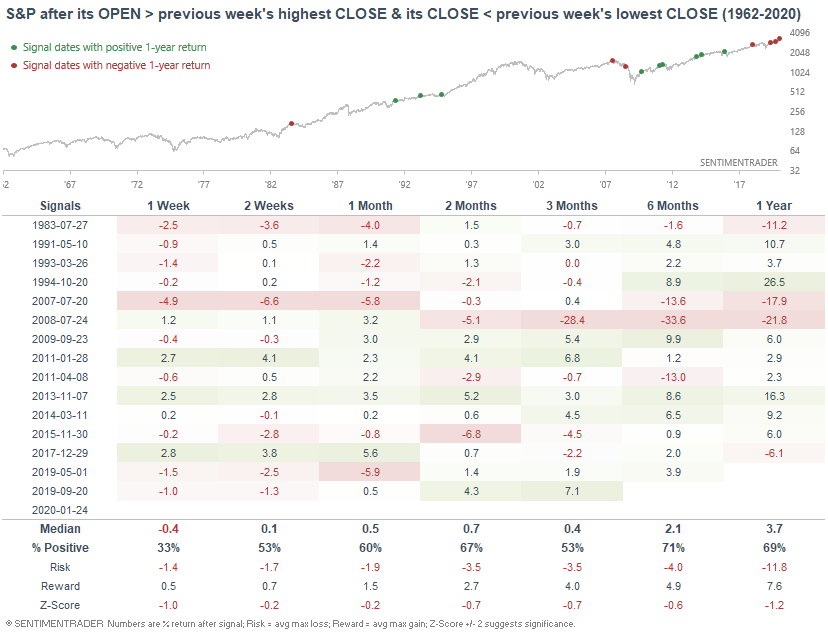
Almost all of the signals preceded a negative return at some point over the next 2-8 weeks.
This is an abridged version of our recent reports and notes. For immediate access with no obligation, sign up for a 30-day free trial now.
We also looked at:
- What happens when the S&P ends a long calm streak
- For only the 2nd time in history, the Russell 2000 and Dow Transports are really lagging
- A lot of Hang Seng stocks in Hong Kong are giving sell signals
- Almost all of the Fidelity Select fund managers are beating cash
- The tech sector has been up most of the past 17 weeks
- The S&P fell more than 1% during a week for the first time in months
- An update to the core fundamental indicators we watch