
Leverage Drops as Stocks Surge

People have been worried about the growth in margin debt for at least the last 6 years. There was no empirical reason to be worried until maybe this spring when the year-over-year change skyrocketed. And that worry was unfounded anyway, as the S&P 500 is sitting at all-time highs.
Curiously, even as the S&P has moved to new high after new high, investors have pulled back on the amount they're borrowing against their stock holdings. The latest figures, aggregating customer data through July, shows that Margin Debt dropped from record levels.
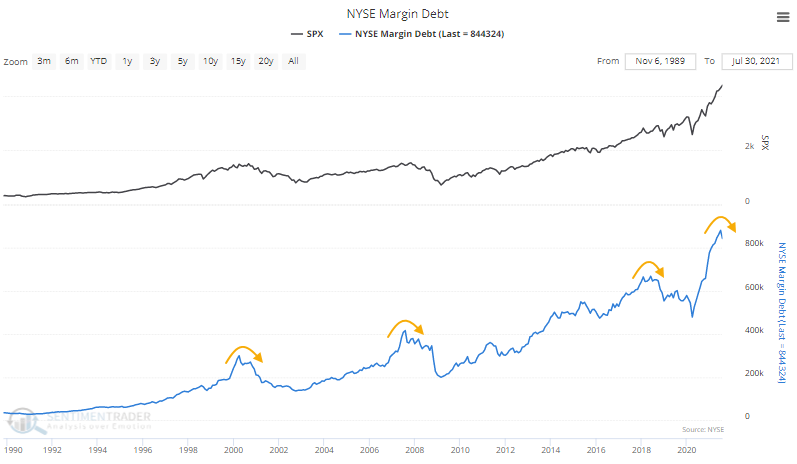
Margin debt more or less ebbs and flows with stock prices. So it's fairly unusual to see margin debt drop as stocks march to continual record highs. The table below shows that this is one of the largest-ever drops in debt during a month when the S&P hit a new high (dates in the table are advanced one month to account for reporting lags).
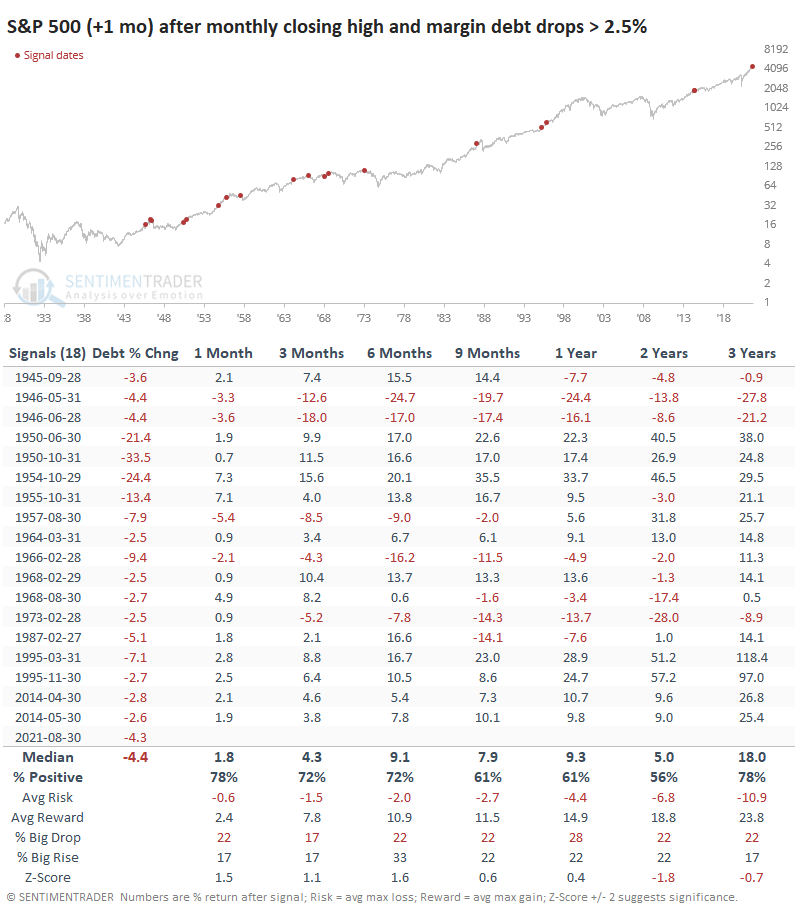
It didn't seem to have a huge impact on forward returns. The S&P did a bit better than random over the short- to medium-term, with gains moderating longer-term.
CASH HOLDINGS DROPPED, TOO
Investors pulled back on debt, but their cash cushion dropped even more. The total dollar value of Free Credits - cash available to brokerage account holders to withdraw - plunged by one of the largest degrees in 70 years in July.
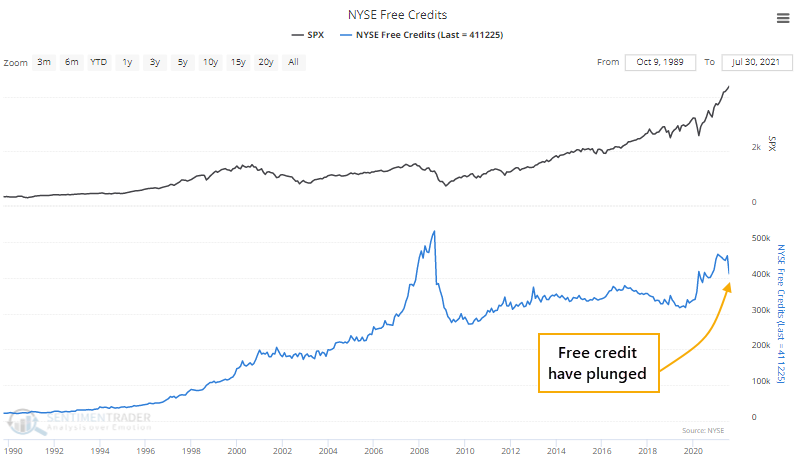
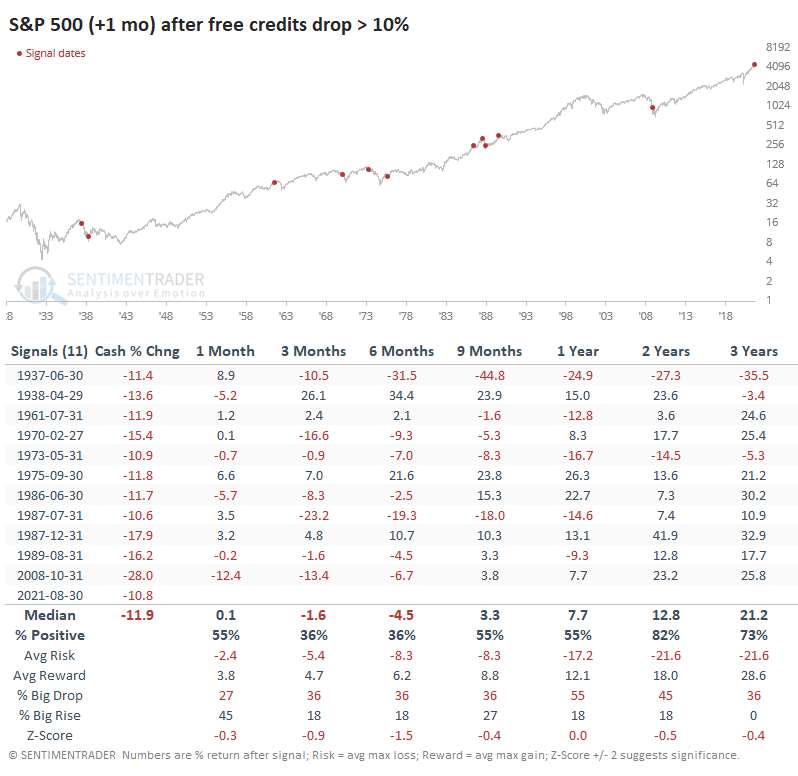
The 11% drop in free credits in July was the 11th-largest monthly drop in history. The only time it declined more than 10% during a month when the S&P was at new highs was June 1987 (again, the dates in the table below are advanced by one month).
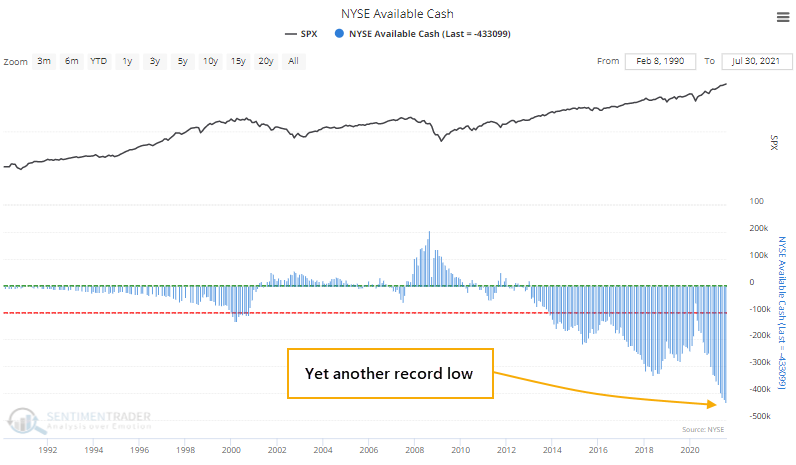
A RECORD IN NEGATIVE NET WORTH
If cash drops more than debt, then the Available Cash figure, a kind of "net worth" for investors, will decline. And so, in July, it fell yet again to another record low.
The U.S. stock market has grown exponentially over the decades, so if we express that Available Cash as a percentage of the total market capitalization of the U.S. stock market, the extreme isn't quite as extreme. It's still among the lowest readings in history, though.
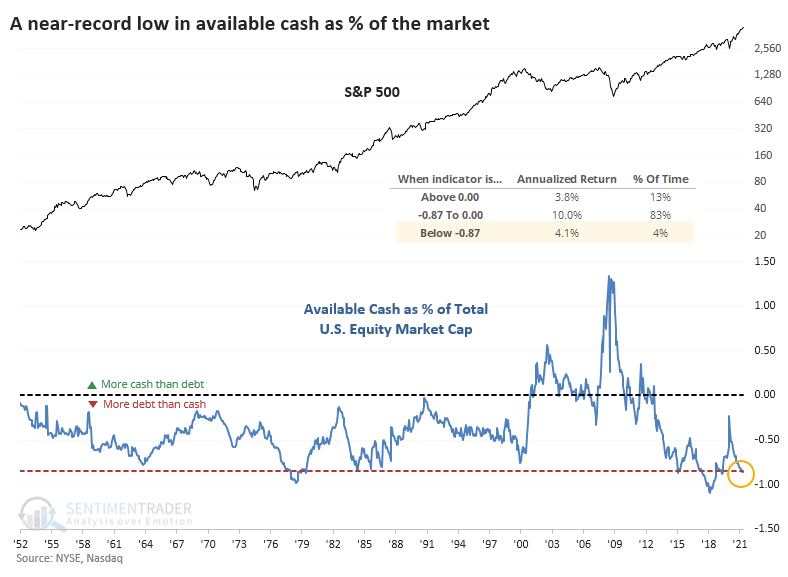
We can see from the chart that the S&P 500's annualized return when Available Cash was -.87% or less of market cap was +4.1%. That's positive, but below the returns when the net worth figure was less extreme.
Pointing out any negatives for stocks over the past 9 months has been an aggravating exercise in futility. Whatever is happening to drive the indexes higher [insert favorite excuse here], it continues unabated. For the first time in a long time, long-term breadth is negative, it's been persisting for months, and it's even worse on the Nasdaq. And yet buyers return to drive the indexes immediately to new highs, with the Nasdaq among the best performers on Monday. This is a heckuva mixed-up market, where nothing but blindly buying seems to work.