Products
SentimenTrader Trading Tools
‍
Backtest Engine
My Trading Toolkit
Correlation Analysis
Seasonality
Indicators & Data API
‍
Proprietary Indicators & Charts
Market Data API
Strategies & Scanner
‍
50+ Trading Strategies
Smart Stock Scanner
Research Reports
‍
Research Solutions
Reports Library
Free Resources
Simple Backtest Calculator
Simple Seasonality Calculator
The Kelly Criterion Calculator
Sentiment Geo Map
Public Research Reports
Pricing
Company
About
In the News
Testimonials
Client Success Stories
Contact
Log inLoginSign up
< BACK TO ALL REPORTS

Love for everything tech

Troy Bombardia
2020-04-21
Darling stocks such as Netflix and Amazon continue make all-time highs.

When it comes to trading, news headlines are a good way to get a sense of what's on everyone's mind. And right now investors' love affair with tech is real:

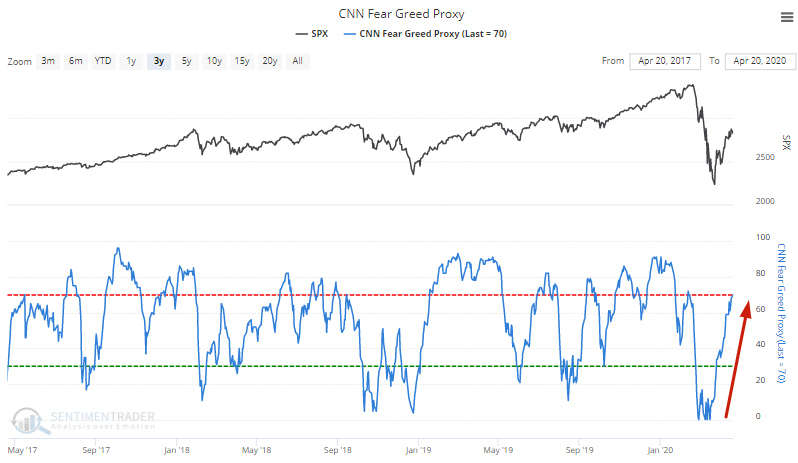
 Tech's rally has pushed the broad market higher, and in some ways, sentiment is creeping up. For example, our CNN Fear & Greed Index proxy has risen to 70:

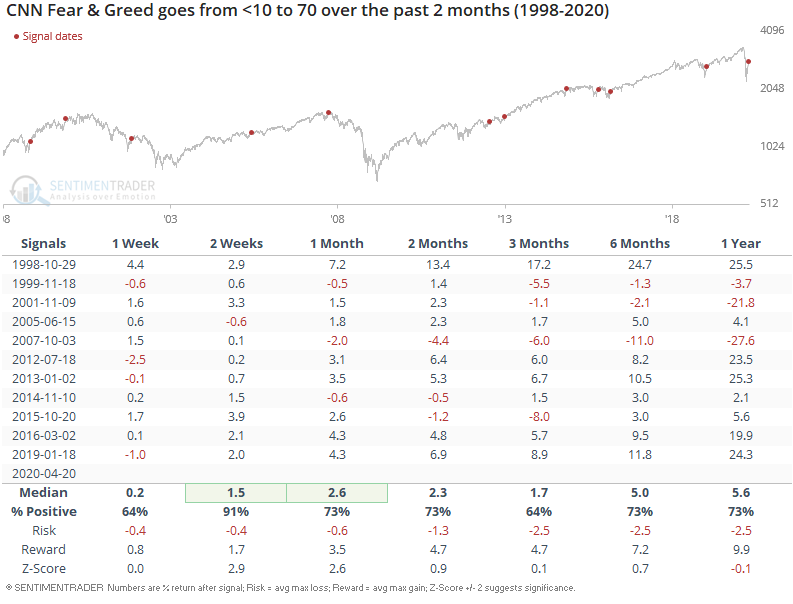
While it's easy to assume that this is a short term bearish sign for stocks, that hasn't always been the case. In fact, more often than not the S&P rallied over the next 2-4 weeks:

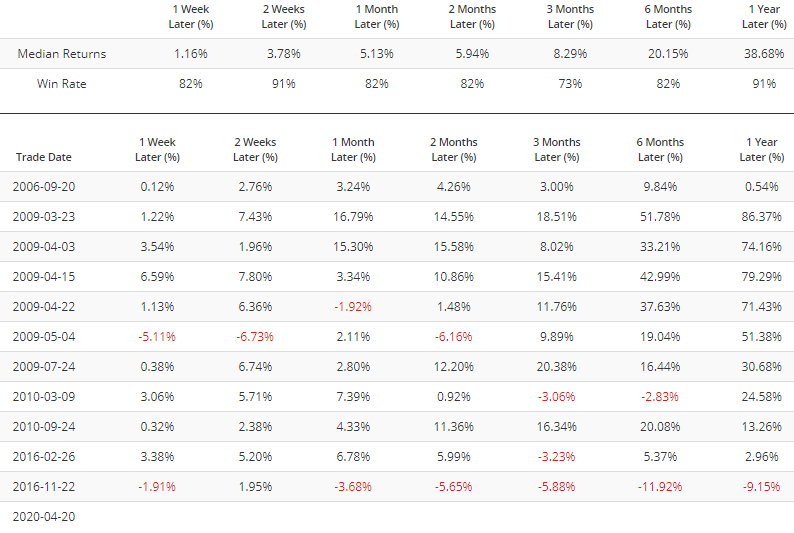
Certain sectors continue to exhibit extreme optimism. For example XRT (retail) Optix's 10 dma at at 78:

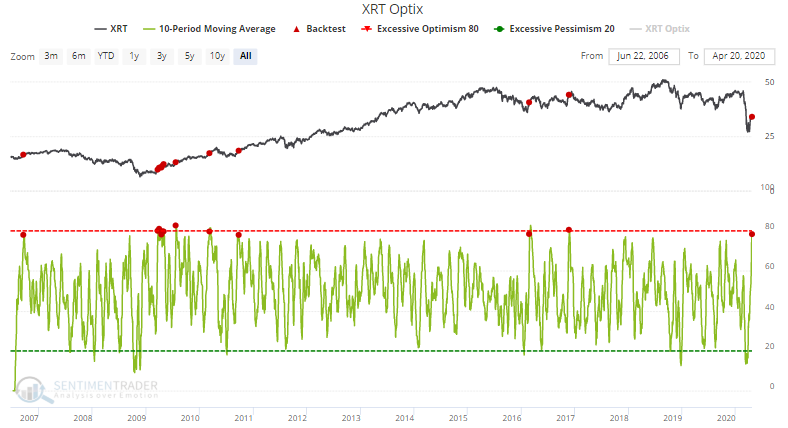
When this happened in the past, XRT went up more often than down over the next few weeks and months. Eventually there was a pullback, but it was hard to say "when".

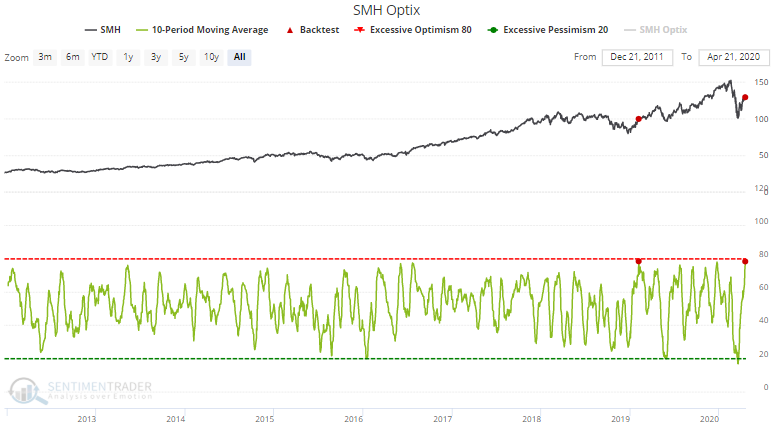
On the other hand, SMH (semiconductors) Optix's  10 dma is at an extremely high level (78). The only other time this happened in the past saw semiconductors consolidate sideways for the next few weeks.

I've shown several short term bearish stats over the past few days, whereas the ones today aren't really short term bearish. What gives?

In my opinion it is incredibly hard to predict the short term, regardless of how much confidence you have in your outlook. Too many unpredictable factors can impact the market's direction in the short term. 

Many of the sectors with the highest sentiment right now are related to tech. As the WSJ mentioned, tech & growth stocks have significantly outperformed value stocks. The Russell 2000 Growth/Value ratio's 14 week momentum remains consistently high around 81:


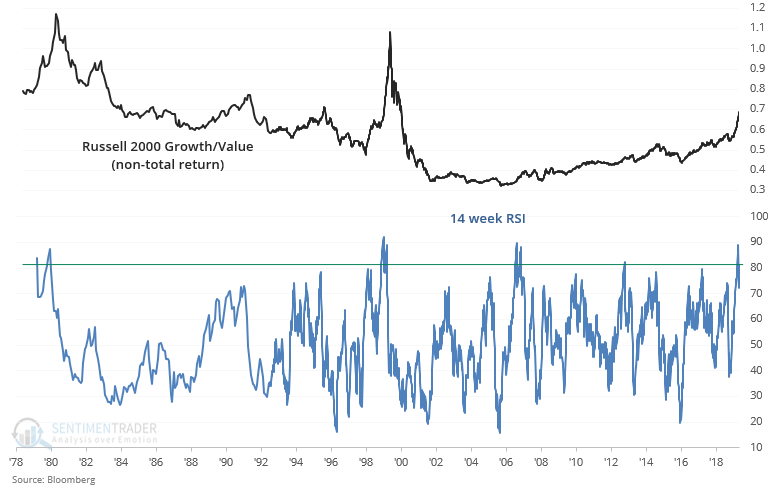
Such strong growth outperformance usually led to problems for stocks over the next year:
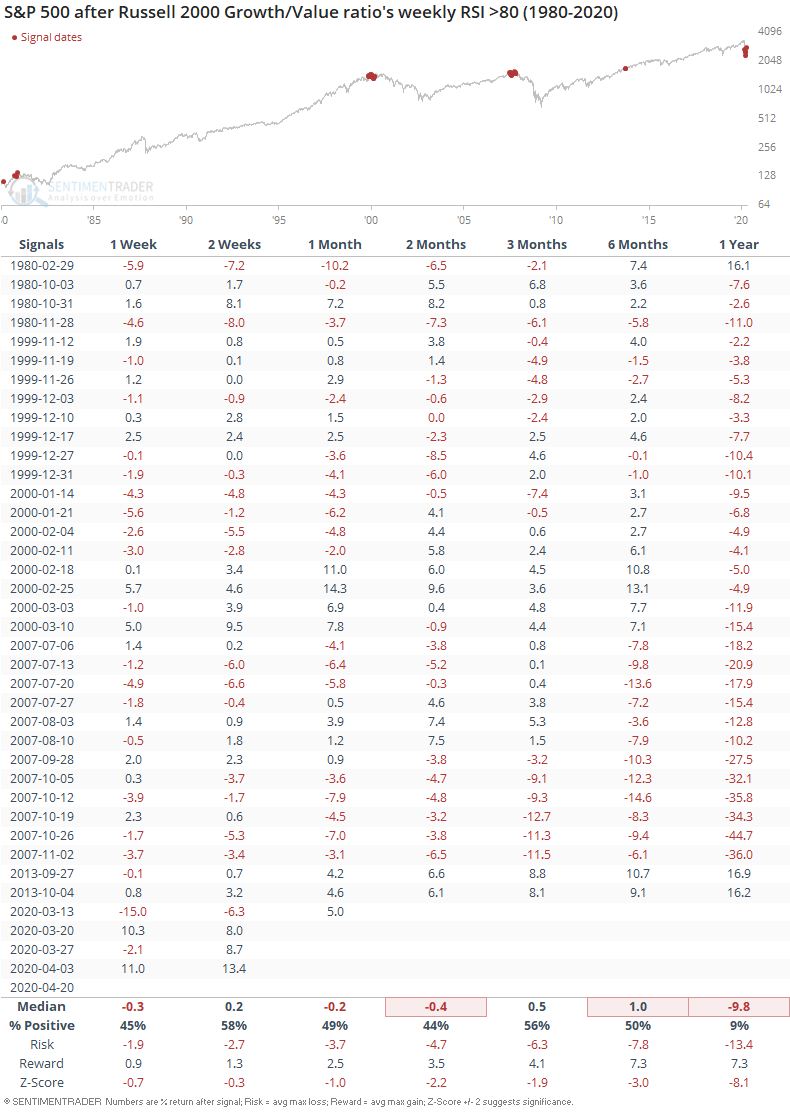
This happened in:

  1. February 1980: stocks crashed in March 1980
  2. October-November 1980: stocks tanked from 1981-1982
  3. 1990-2000: top of dot-com bubble
  4. 2007: stocks crashed aftwards
  5. September 2013: stocks did not fall

Sorry, you don't have access to this report

Upgrade your subscription plan to get access
Go to Dasboard
PRODUCTS
SentimenTrader
Trading Tools
Indicators & Data API
‍
Strategies & Scanner
‍
Research Reports
FREE
RESOUrCES
Simple Backtest
Calculator
Simple Seasonality
Calculator
The Kelly Criterion
Calculator
Sentiment Geo Map
‍
Public Research Reports
‍
Pricing
Bundle pricing
‍
Announcements
‍
FAQ
COMPANY
‍
About
‍
In the News
‍
Testimonials
‍
Client Success Stories
CONTACT
‍
General Inquiries
‍
Media Inquiries
‍
Financial Professionals Inquiries
‍
© 2025 Sundial Capital Research Inc. All rights reserved.
Setsail Marketing
TermsPrivacyAffiliate Program
Risk Disclosure: Futures and forex trading contains substantial risk and is not for every investor. An investor could potentially lose all or more than the initial investment. Risk capital is money that can be lost without jeopardizing ones’ financial security or life style. Only risk capital should be used for trading and only those with sufficient risk capital should consider trading. Past performance is not necessarily indicative of future results.

Hypothetical Performance Disclosure: Hypothetical performance results have many inherent limitations, some of which are described below. No representation is being made that any account will or is likely to achieve profits or losses similar to those shown; in fact, there are frequently sharp differences between hypothetical performance results and the actual results subsequently achieved by any particular trading program. One of the limitations of hypothetical performance results is that they are generally prepared with the benefit of hindsight. In addition, hypothetical trading does not involve financial risk, and no hypothetical trading record can completely account for the impact of financial risk of actual trading. for example, the ability to withstand losses or to adhere to a particular trading program in spite of trading losses are material points which can also adversely affect actual trading results. There are numerous other factors related to the markets in general or to the implementation of any specific trading program which cannot be fully accounted for in the preparation of hypothetical performance results and all which can adversely affect trading results.

Testimonial Disclosure: Testimonials appearing on this website may not be representative of other clients or customers and is not a guarantee of future performance or success.