
Macro model flips to cash

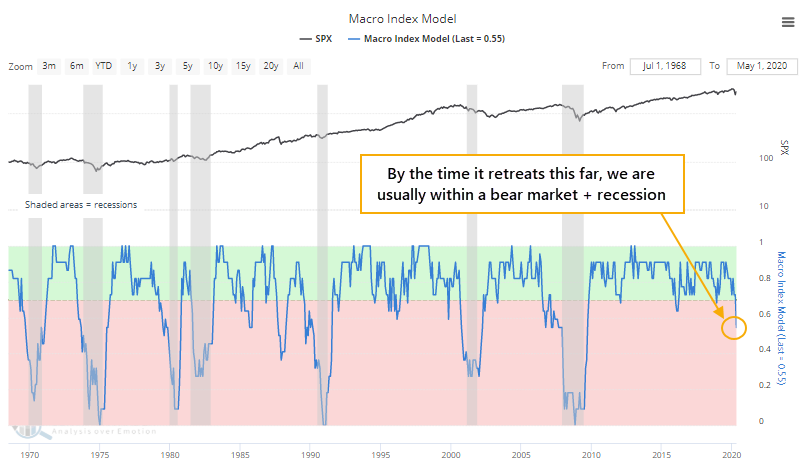
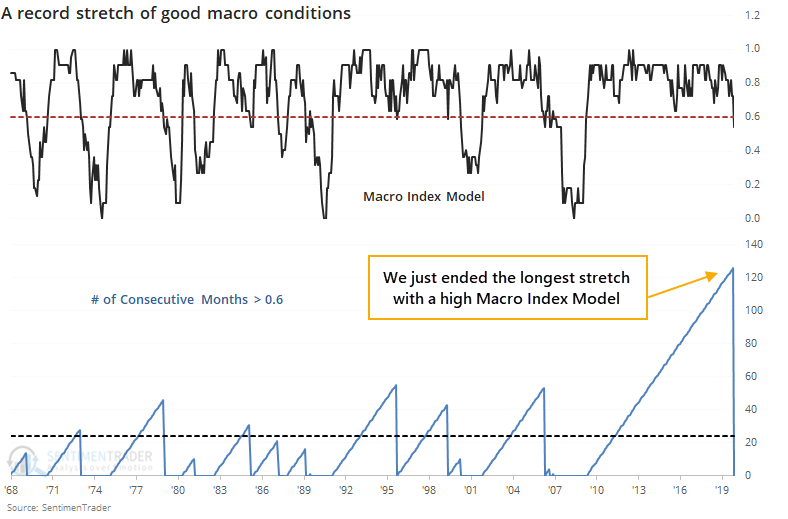
One of our main Buy/Sell Signals has flipped to a sell. The Macro Index Model, reflecting mostly monthly economic data, has deteriorated the most since the last recession.
As Troy noted when he first created the signal, macro deteriorates from time to time, which is normal during the ebb and flow of an economic expansion. To differentiate temporary slowdowns from real problems, the model looks for significant macro deterioration. It combines 11 diverse economic indicators to determine the state of the U.S. economy:
- New Home Sales
- Housing Starts
- Building Permits
- Initial Claims
- Continued Claims
- Heavy Truck Sales
- 10 year – 3 month Treasury yield curve
- S&P 500 vs. its 10-month moving average
- ISM manufacturing PMI
- Margin debt
- Year-over-year headline inflation
The model leans towards housing & the labor market. Housing indicators are extremely useful as leading economic indicators, and there are plenty of academic papers that explain why. Labor market indicators are very timely for calling recessions, with few false signals. Stock market investors should be bullish when the Macro Index is above 0.7, and bearish when the Macro Index is below or equal to 0.7.
Not only has it dropped below 0.7, it has gone further than any point over the past decade, and receded below 0.6. According to the Backtest Engine, future returns in the S&P 500 have been relatively subdued after such low readings.
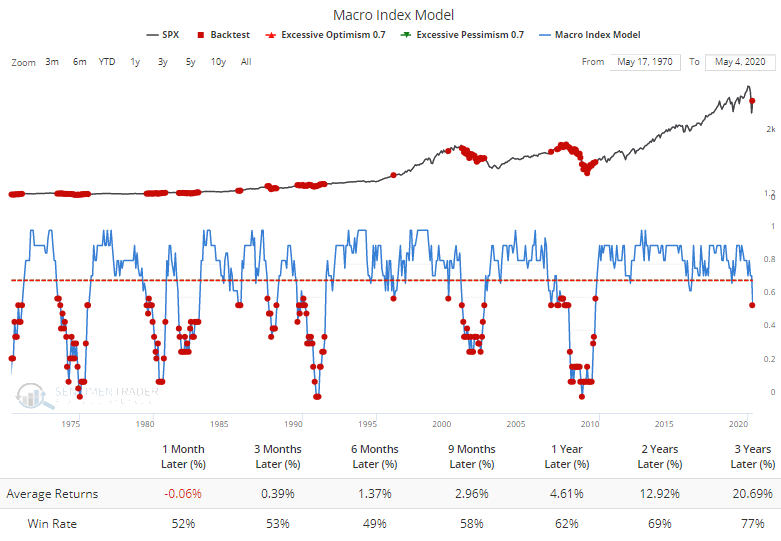
We can ask the Engine to ignore multiple readings in a row and exclude any of them that triggered within 12 months of another signal.
Returns degraded after these, in large part because it triggered early in the very long-term topping process before the last two recessions.
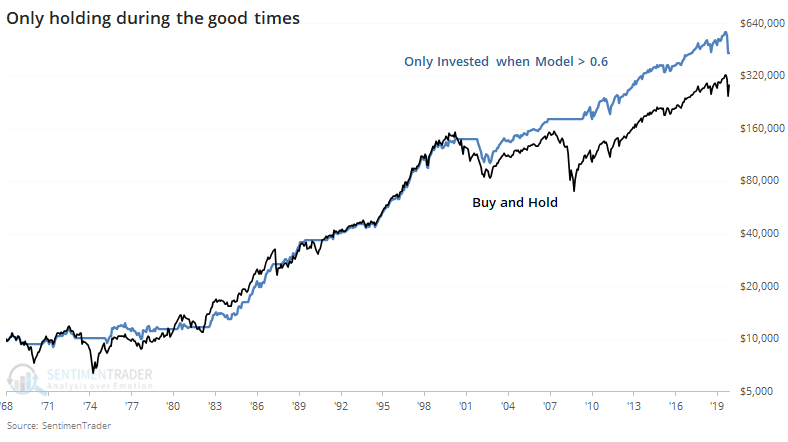
If we only held the S&P 500 following months when the signal was above 0.6, it would have showed a better risk/reward profile then simple buy-and-hold, even with getting caught during the severe March drawdown.
This signal may be different in that it just ended a record run in positive territory. We've seen time and time again over the years that long streaks of positive momentum which ended suddenly usually had more positive returns than those following shorter bouts of positive momentum.
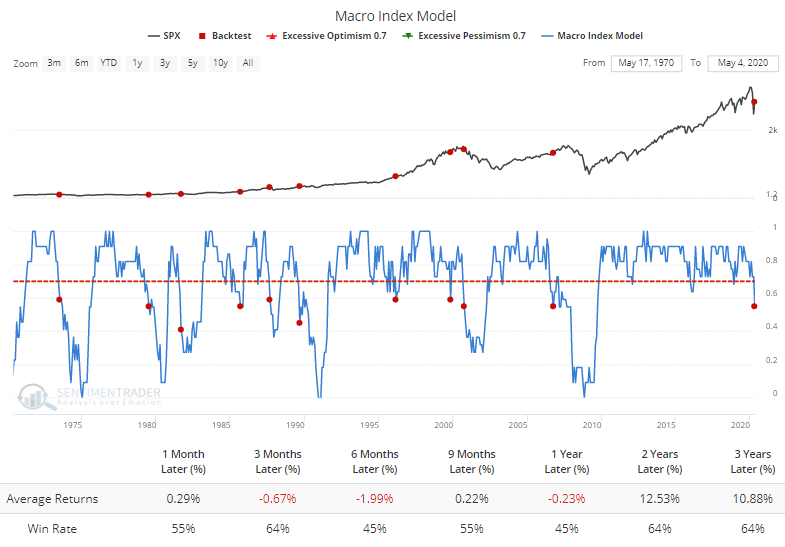
If we only look at times when the signal fell below 0.6 for the first time in at least two years, then the S&P's future returns were better. Three suffered major losses, and three escaped mostly unharmed.
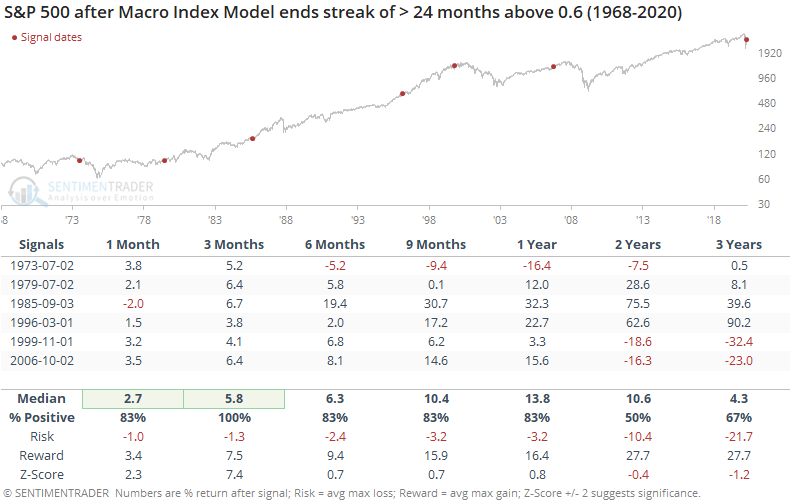
The biggest risk from here is persistency. If the signal continues to hover below 0.7 in the months ahead, like it did during the last two bear markets and recessions, then it significantly raises the risk that we're in a tough, long slog and not a rapid rebound. The most positive signals in the table above saw the model avoid much more deterioration, and typically rebounded within two months.
The point of using a mechanical system is it that takes emotion and judgment out of the equation. That's a good thing for many, maybe even most, of us. For those who use some discretion, when we see conditions deteriorate like this, combined with a rebound in sentiment, it makes sense to be cautious. The biggest caveat against the model's warning is the speed of the decline and recovery, as well as fiscal and monetary response, which is all of which are beyond what any of the other signals witnessed.