Market & fundamentals overview: the long awaited pullback
The stock market dropped this week after a long streak of strong momentum. Here's my market outlook:
- Long term risk:reward (e.g. 1-5 year basis) doesn’t favor bulls. Valuations are high, but valuations can remain high for years before stocks crash.
- Fundamentals (6-12 months): still bullish because there is no significant U.S. macro deterioration.
- Technicals (1-3 months): bearish
Fundamentals (6-12 months)
The economy and the stock market move in the same direction in the long term. Hence, leading economic indicators are also long term leading indicators for the stock market.
Overall, there is no significant U.S. economic deterioration right now. This is bullish for the stock market on a 6-12 month time frame. The main weak points in U.S. macro revolve around trade, manufacturing, and the yield curve. For more details and charts, please see the bottom of this post.
Technicals (1-3 months)
Our outlook over the next 1-3 months is bearish. With that being said, the market's strong momentum before this recent stock market rout suggests that any pullback/correction will not be protracted. Let's start with the bearish factors, and then we'll examine the bullish factors.
Bearish:
Sentiment
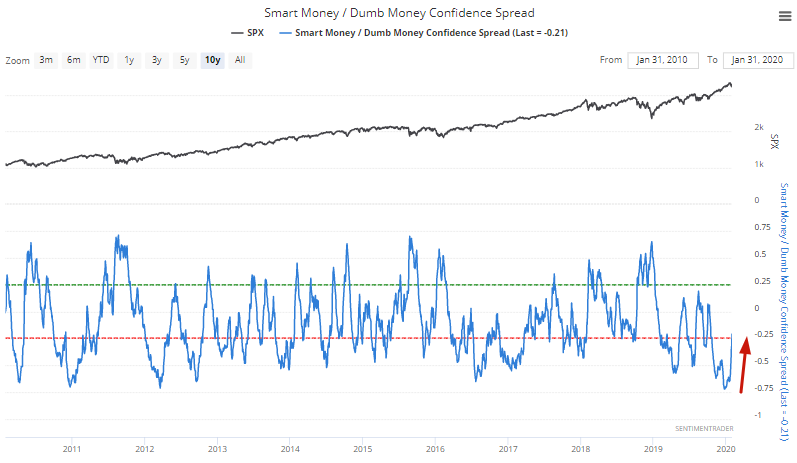
Extremely optimistic sentiment from the past few weeks remains a bearish factor for U.S. equities right now. As sentiment tends to move with price, the falling U.S. stock market is accompanied by a decrease in optimism.
The Smart Money/Dumb Money Confidence spread has now turned up from one of the most extreme readings in history.
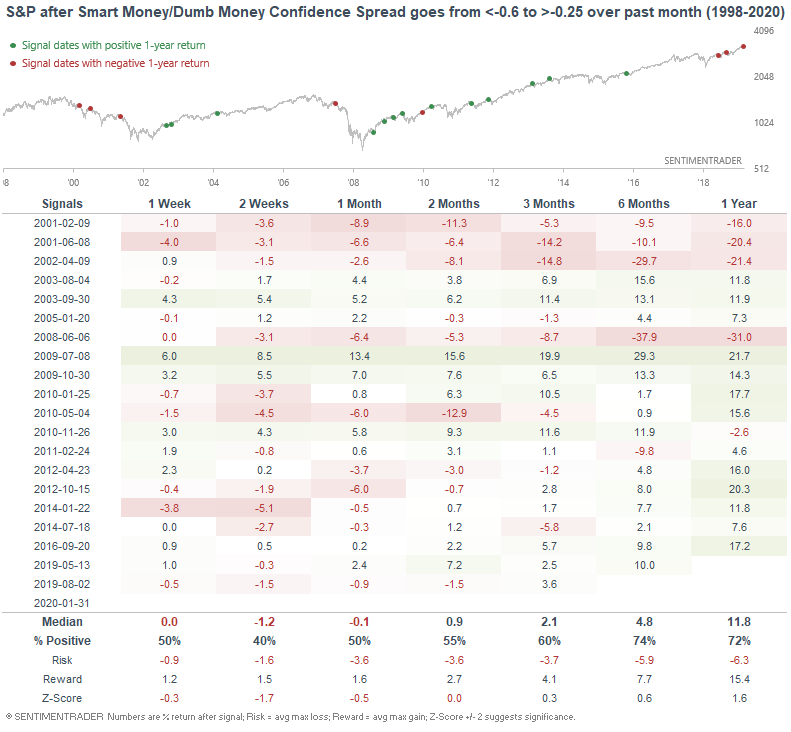
When the spread went from less than -0.6 to above -0.25 (over the past month), the S&P often struggled over the next 2 weeks:
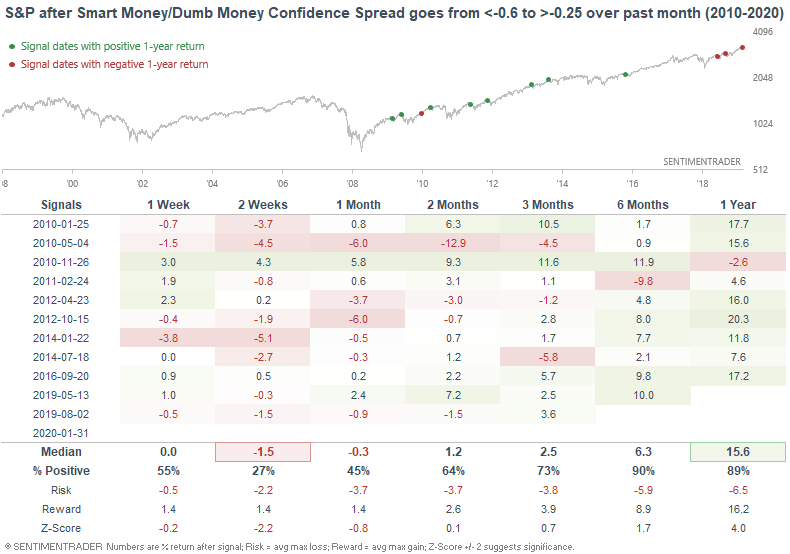
This has been particularly true over the past 10 years:
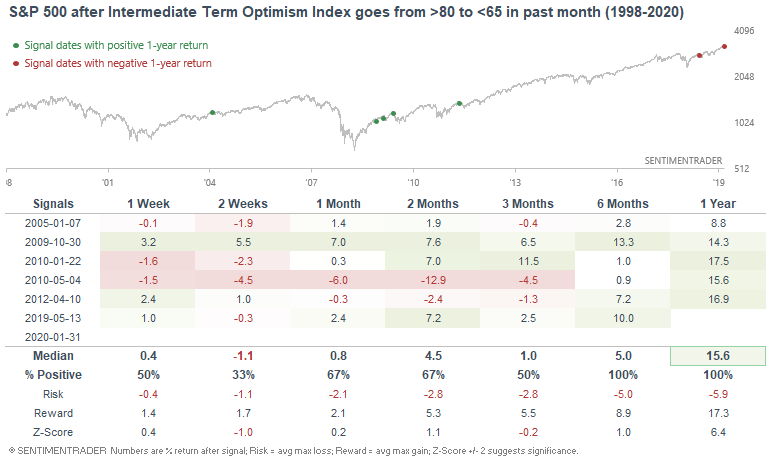
Similarly, the Intermediate Term Optimism Index has now turned down from one of its highest levels in history:
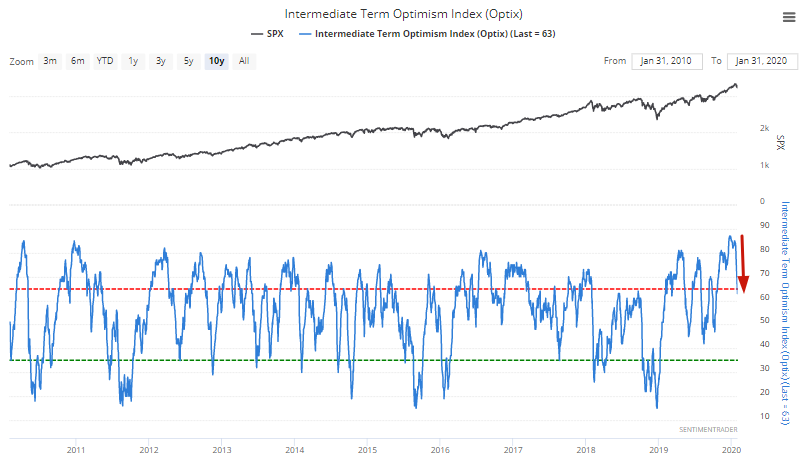
When this happened in the past, the S&P often suffered over the next 2 weeks.
Breadth warnings
As Jason noted on Friday, all 4 U.S. indices have triggered Hindenburg Omens. When this happened in the past, the U.S. stock markets returns over the next few weeks and months leaned bearish.
In the meantime, Jason also noted that the NYSE HiLo Logic Index has triggered a "split" breadth signal again. As we've covered extensively here at SentimenTrader, this has not been good for U.S. equities over the next 1-3 months.
Mixed:
Trend
As Jason mentioned on Tuesday, the S&P suffered a -1% loss after more than 50 days without a +/- 1% daily move. The end of long low volatility streaks were usually followed by more losses over the next few weeks.
Bullish:
Volatility after extreme momentum
As Jason mentioned on Friday, the old implied volatility index VXO has spiked above 20 for the first time in a long time. Since stock market tops are rarely preceded by extremely strong momentum, such volatility spikes were usually bullish for stocks over the next 1-3 months. Cases which saw the stock market fall even more in the short term rarely turned into protracted declines.
In the meantime, I noted that for the first time in 4 months, fewer than 7 out of 10 S&P 500 sectors went up in January. The first case of weak sector breadth after a long period of strong sector breadth was usually followed by more gains for the S&P 1-2 months later.
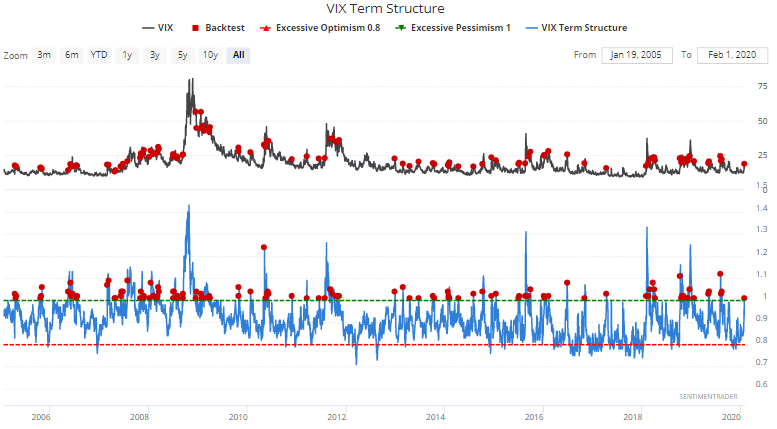
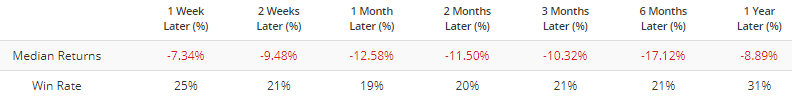
And finally, VIX's term structure exceeded 1 on Friday, which means that 1 month VIX futures are higher than 3 month VIX futures. When this happened in the past, VIX's returns over the next few weeks leaned bearish:
Rush to safe-havens
As global equities have pulled back over the past 2 weeks and coronavirus fears intensify, bonds have rallied:
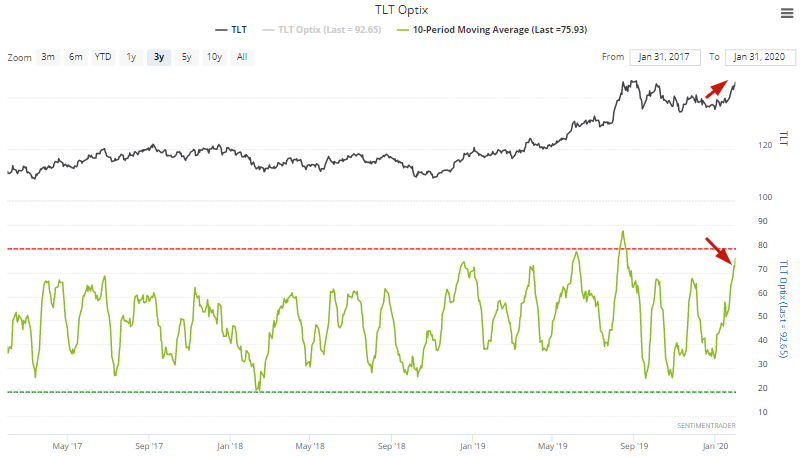
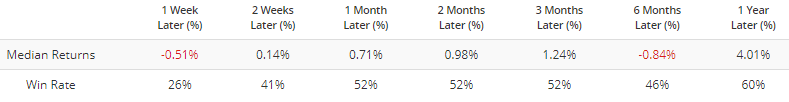
TLT Optix's 10 dma is now above 75, a level that usually led to losses for TLT over the next week:
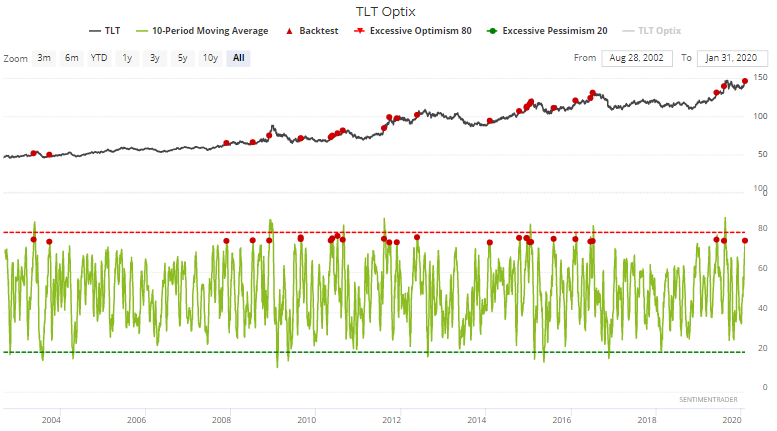
Since flight-to-safety trades are usually accompanied by stock market selloffs, the S&P 500 often rallied 1 month later:
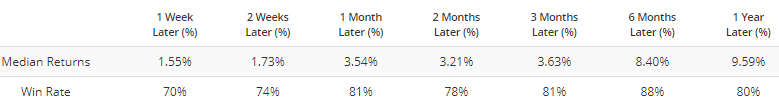
And VIX often fell over the next month:
Across the board selloff
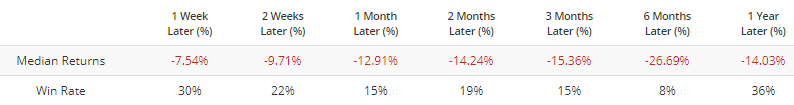
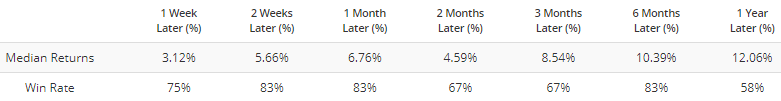
With the stock market's sudden drop this week, 28% of the S&P's members jumped below their lower Bollinger Bands (on a weekly basis):
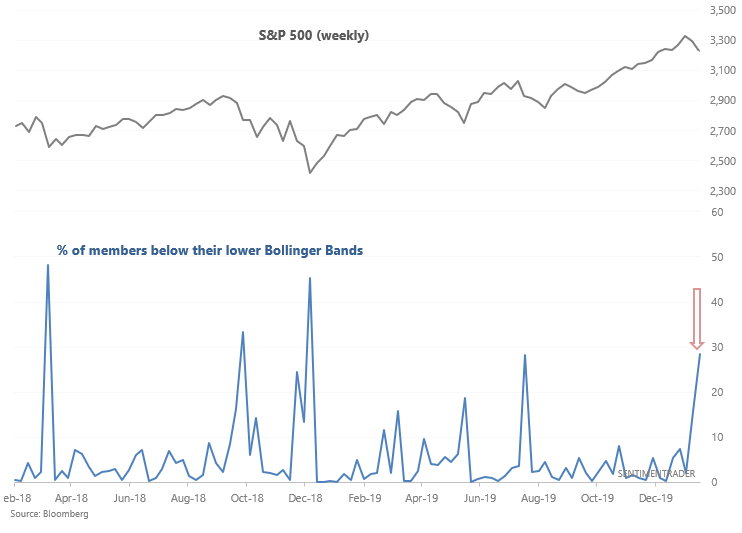
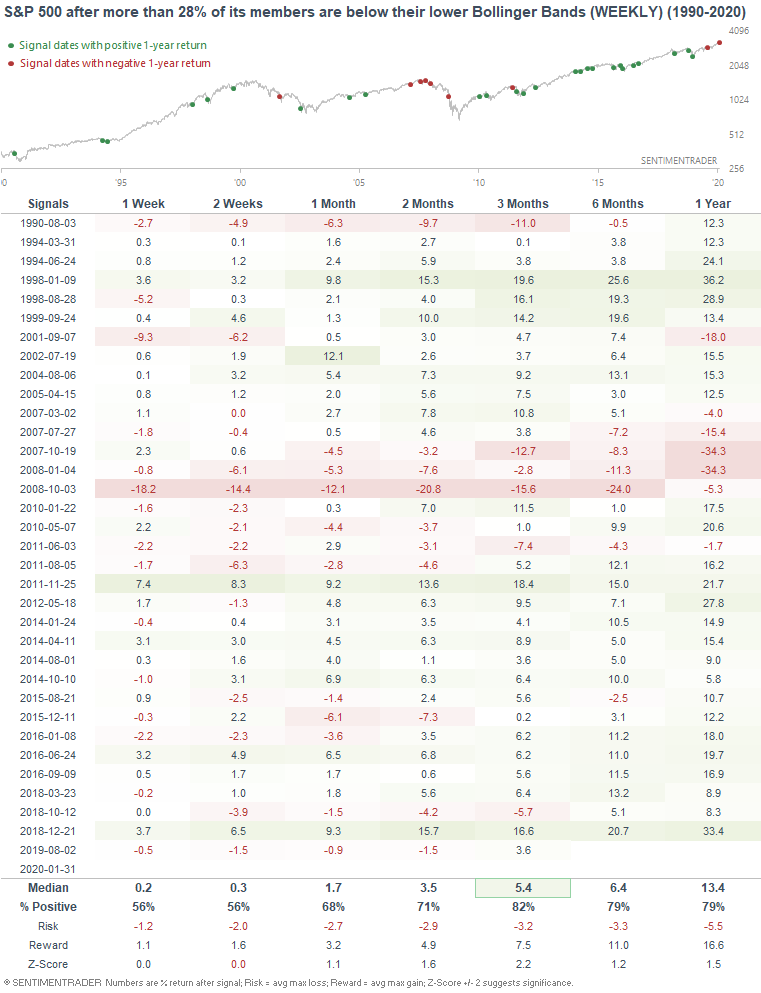
When this happened in the past, the S&P often rallied over the next 3 months. The bearish historical cases mostly occurred within the context of the 2007-2009 bear market:
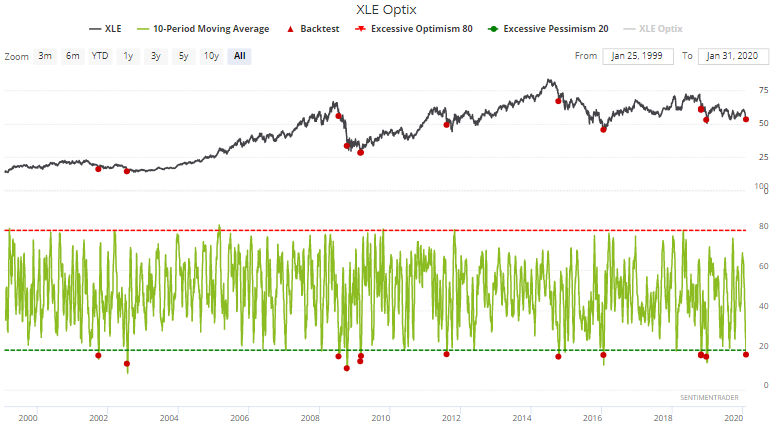
Energy sector sentiment
Out of various U.S. stock market sectors, sentiment towards energy sector stocks is extremely low. XLE Optix's 10 dma is now below 18, a level that has only been reached several times over the past 20+ years. When it was this low in the past, XLE often rallied over the next 2-4 weeks:
February 1, 2020: Fundamentals Overview Part 2
This is Part 2 of a weekly update on the U.S. stock market's long term fundamentals. Part 1 can be found here.
Fundamentals 1-3 years: market timing
I don't try to predict the future of the economy. Plenty of very smart people try, and when you add up the successes+failures, the results are usually no better than a 50/50 coin toss. That's why I focus instead on leading economic indicators. Look at what has already happened instead of predicting the future.
The economy drives corporate earnings, which drives the stock market in the long term. As a result, bull markets usually coincide with economic expansions, and big bear markets usually coincide with recessions.
Since the stock market tends to peak before recessions begin, we need to look at leading economic indicators, which also deteriorate before recessions begin. This doesn’t mean that the stock market’s exact top cannot occur before macro starts to peak. This happened in January 1973, when the stock market peaked a few months before macro started to deteriorate. However, the biggest part of bear markets always occur after macro has deteriorated significantly.
Here’s a brief summary of the leading and most important economic indicators I track, some of which I include in the Macro Index. The ones that are included in the Macro Index have an asterisk beside them**
Bullish factors right now
- Labor market**
- Housing**
- Financial conditions
- Heavy Truck Sales**
- Inflation-adjusted retail sales
Neutral/bearish factors right now
- Corporate profits
- High yield spreads
Bearish factors right now
- Yield curve**
- Manufacturing**
Bullish factors
Labor market
Labor market indicators do not show any significant deterioration right now.
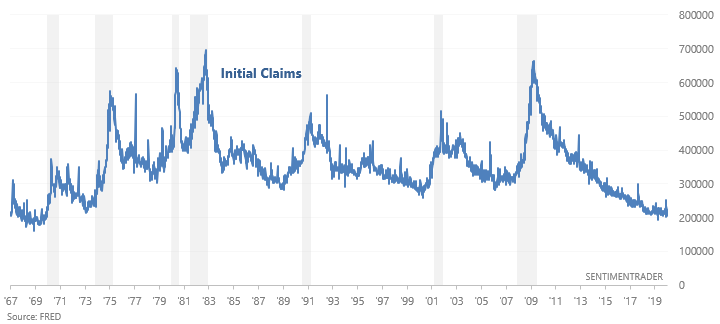
Initial Claims
Initial Jobless Claims measures the number of jobless claims filed by people who are seeking to receive jobless benefits. In other words, this measures the number of people who are recently unemployed. This economic indicator continues to trend sideways. In the past, Initial Claims trended higher before a recession began. This is still a positive point for macro, but watch out over the next few months in case Initial Claims trends upwards because Initial Claims is very low right now.
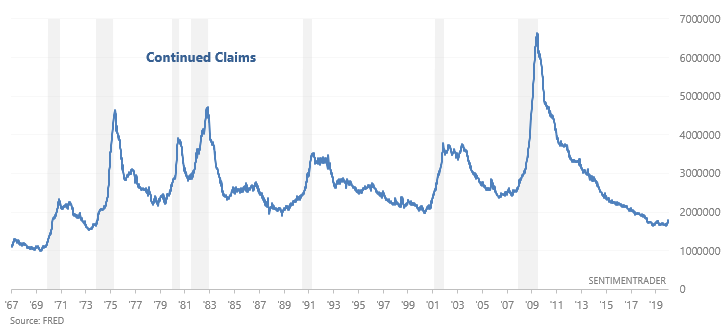
Continued Claims
Continued Jobless Claims measures the number of people who are still filing jobless claims (past the initial claim). This economic indicator continues to trend sideways. In the past, Continued Claims trended higher before a recession began. This is still a positive point for macro, but watch out over the next few months in case Continued Claims trends upwards because Continued Claims is very low right now.
Housing
Housing market indicators do not show significant deterioration right now.
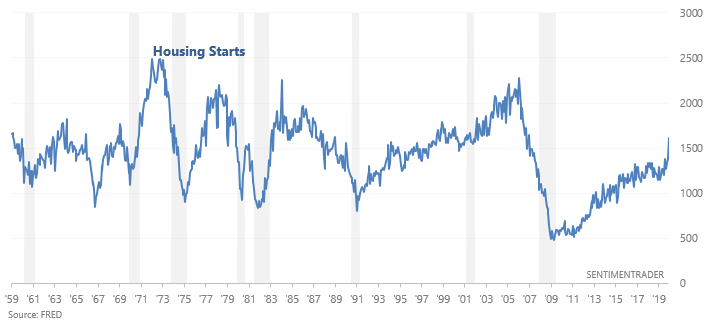
Housing Starts
Housing Starts measures the number of new homes that are starting to be built in the U.S., from the time of first excavation. This figure is trending higher right now. In the past, Housing Starts trended downwards before recessions began. This is a positive for macro.
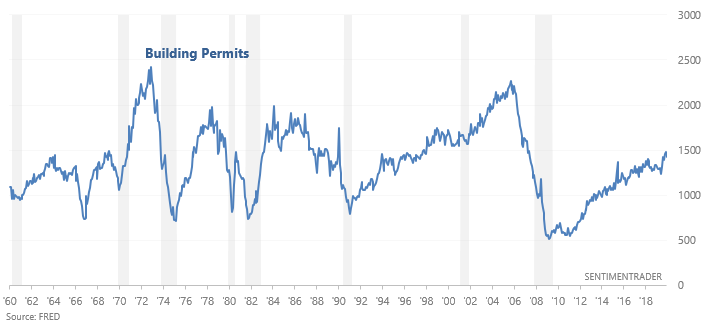
Building Permits
Building Permits are trending upwards right now. In the past, Building Permits trended downwards before recessions began. This is a positive for macro.
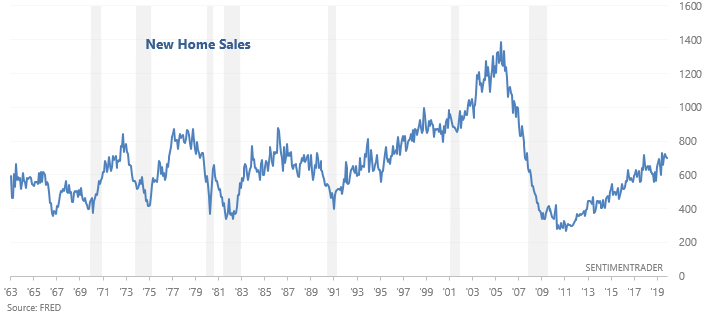
New Home Sales
New Home Sales are trending upwards right now. In the past, New Home Sales trended downwards before recessions began. This is a positive for macro.
Financial Conditions
Indicators related to financial conditions remain relatively loose. This is a positive for macro.
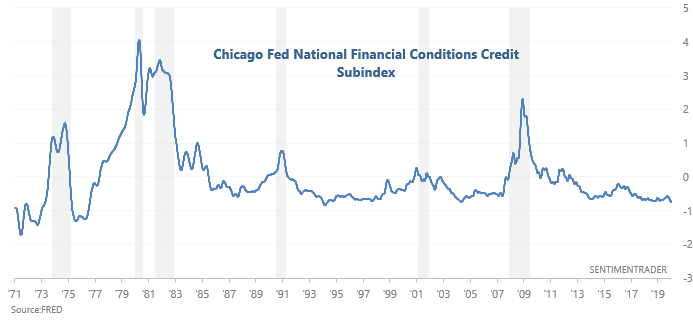
Chicago Fed Financial Conditions Credit Subindex
The Chicago Fed Financial Conditions Credit Subindex remains quite low. Looking at the bigger picture, the Credit Subindex is trending sideways right now. In a credit-driven economy, the Credit Subindex tends to trend solidly upwards (i.e. tighten) before a recession begins.
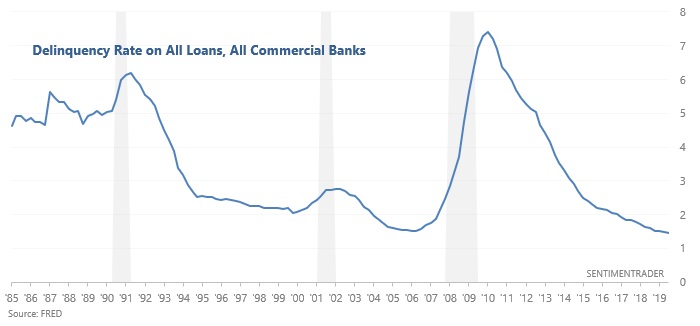
Loans
The Delinquency Rate on All Loans continues to trend downwards. In the past, the Delinquency Rate trended higher before a recession began. This is a positive for macro.
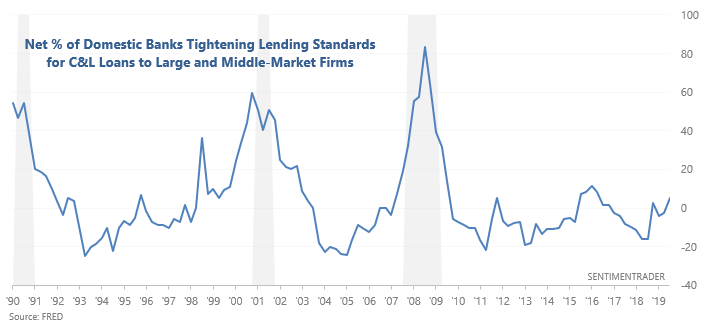
Banks’ lending standards
Banks are starting to tighten their lending standards right now. In the past, lending standards tightened for several quarters before a recession began, causing the Net Percentage of Banks Tightening Standards to trend higher. This was a positive for macro, but is now something that bulls should watch out for in case lending standards continue to tighten.
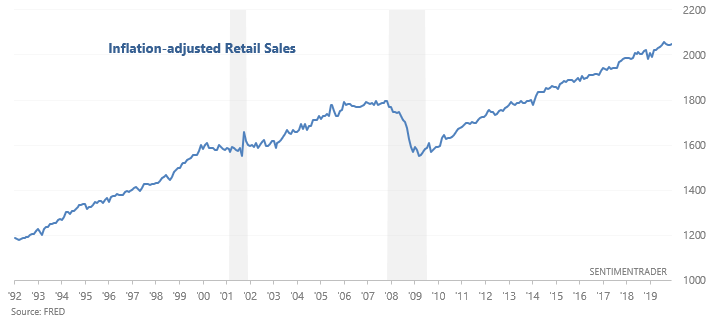
Inflation-adjusted retail sales
Inflation-adjusted Retail Sales continue to trend higher. In the past, inflation-adjusted Retail Sales trended sideways before recessions began. This is a positive for macro.
Neutral/bearish factors
Corporate Profits
Figures related to corporate profits suggest that the economic expansion is definitely late-cycle.
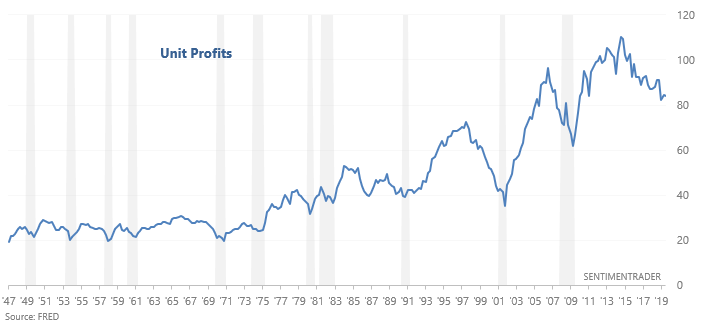
Unit Profits
Unit Profits continue to trend downwards, which is typically what happens in the second half of an economic expansion cycle. However, this indicator is not a timing tool. Unit Profits can fall for years before a recession begins.
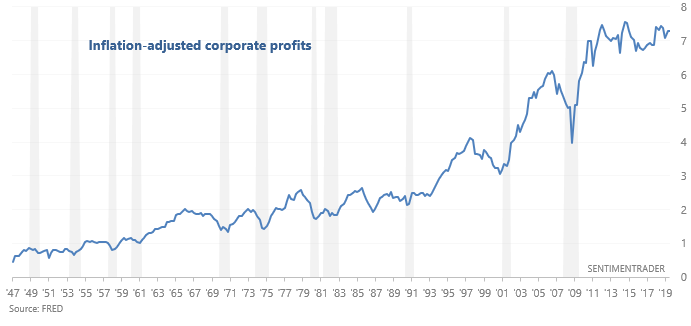
Corporate Profits
Inflation-adjusted corporate profits are trending sideways. In the past, inflation-adjusted corporate profits trended downwards for several quarters before recessions began. If corporate profits start to trend downwards, this will be a negative for macro in 2020.
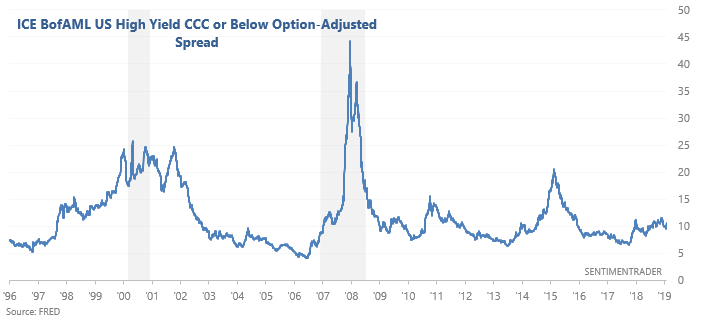
High yield spreads
From September 2018 – present, high yield spreads on the lowest rated bonds have been trending higher while the stock market has made higher highs. This is a necessary but not sufficient condition for bear markets and recessions. In the past, high yield spreads on these bonds trended higher before bear markets and recessions began. Meanwhile, high yield spreads in general are still trending lower. Overall, this is a neutral factor for stocks right now.
Bearish factors
Yield Curve
Both the popular 10 year - 2 year and 10 year - 3 month sections of the yield curve were recently inverted, and are now trending higher. Here's the 10 year - 3 month yield curve, which historically has been a better market timing indicator than the 10 year - 2 year yield curve:
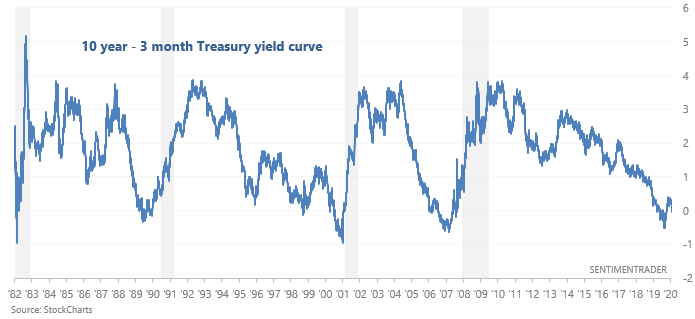
Overall, the yield curve is a bearish factor for macro right now because inversions & post-inversion steepenings tend to occur 1-2 years before recessions and bear markets begin. HOWEVER, the yield curve is merely one of many factors to consider, and it is not flawless.
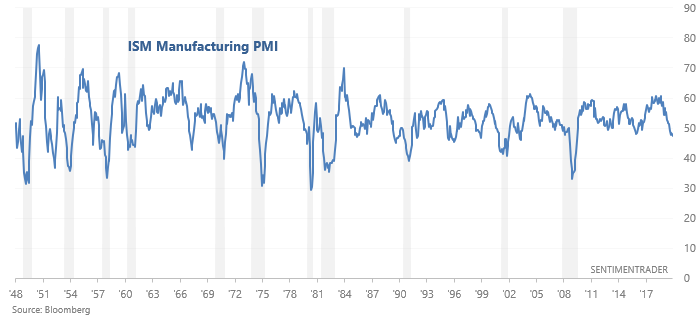
Manufacturing
The manufacturing sector remains one of the weakest parts of the U.S. economy, and this is probably related to the trade war. For example, the ISM Manufacturing PMI is currently below 50, which signals contraction. This is a bearish factor for our Macro Index.
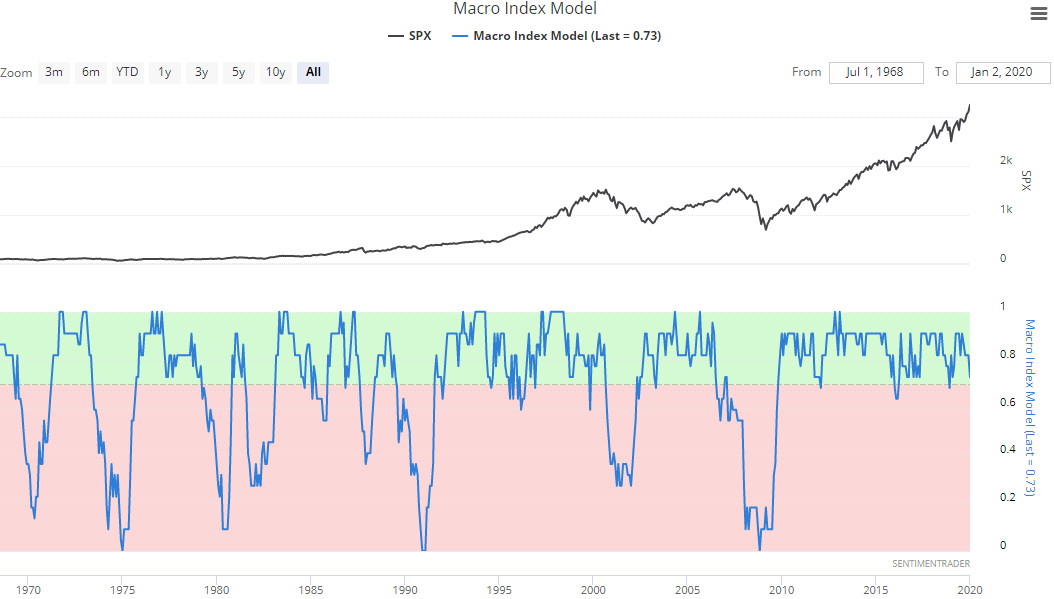
Macro Index
The Macro Index includes:
- New Home Sales
- Housing Starts
- Building Permits
- Initial Claims
- Continued Claims
- Heavy Truck Sales
- 10 year - 3 month Treasury yield curve
- S&P 500's 10 month average
- ISM Manufacturing PMI
- Margin Debt
- Inflation