Market overview: a little less bullish
The stock market remains near an all-time high, despite a nonstop stream of things to "worry about". (I think Jason's tweet sums up this week). Here's my market outlook:
- Long term risk:reward doesn’t favor bulls. Valuations are high, but valuations can remain high for years.
- Fundamentals (6-12 months): still bullish because there is no significant U.S. macro deterioration, but this could change IF macro data deteriorates significantly over the next few months
- Technicals (3-6 months): mostly bullish, although some of the medium term studies are having less of a bullish bias
- Technicals (1-2 months): no clear edge in either direction.
Fundamentals (6-12 months)
The economy and the stock market move in the same direction in the long term. Hence, leading economic indicators are also long term leading indicators for the stock market.
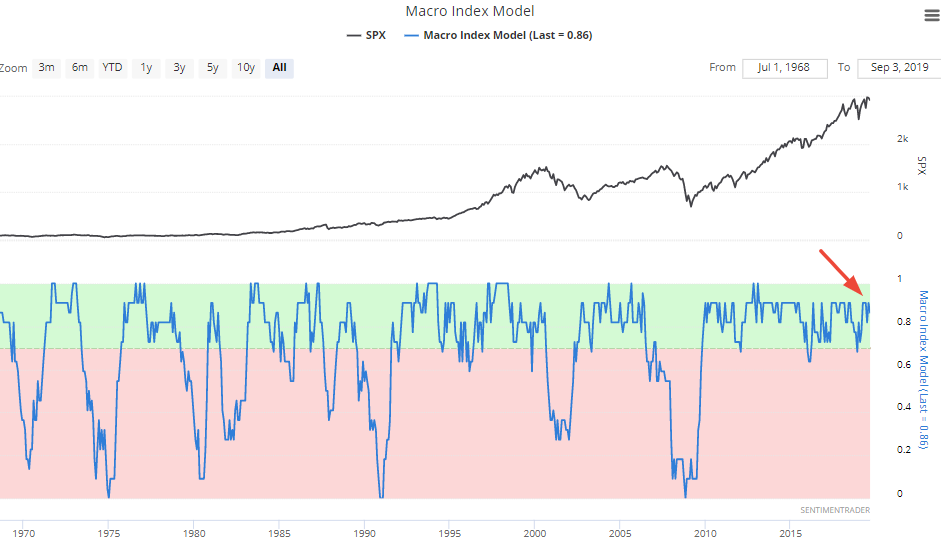
Here is our Macro Index, which aggregates 11 leading indicators. Overall, there is no significant U.S. economic deterioration right now. What will happen to macro in the future? I don't know. Instead of trying to guess the future, macro tells us how to react and trade day-by-day depending on what's happening right now.
The main weak points in U.S. macro revolve around trade, manufacturing, and the yield curve. (Please see the specified economic-data charts at the bottom of this post.)
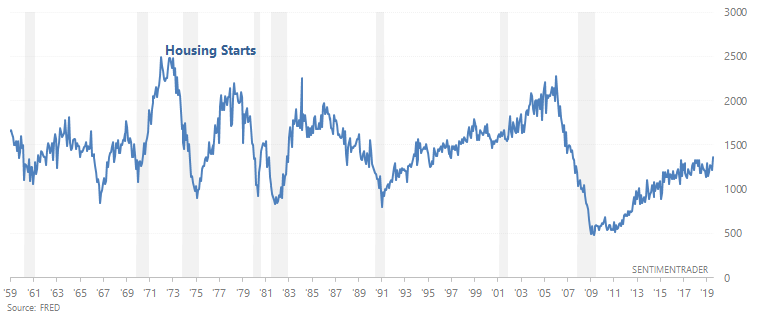
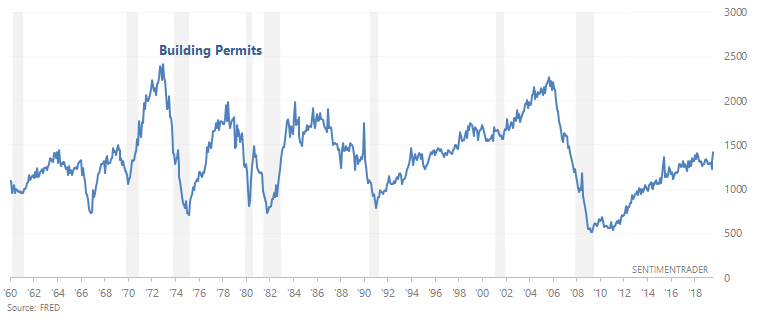
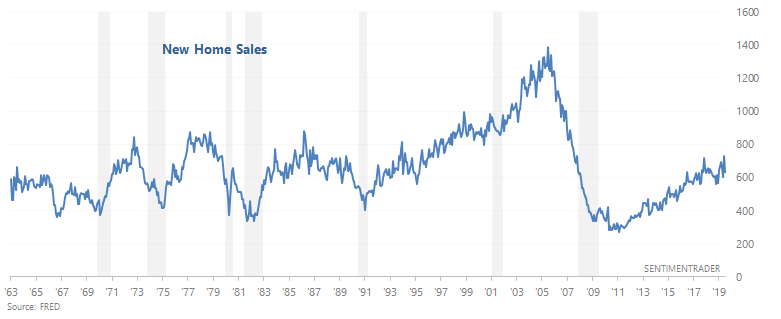
- Housing was weak, but is starting to improve. In the past, Housing Starts, Building Permits, and New Home Sales trended downwards before recessions began. Housing Starts and New Home Sales are trending sideways right now, while Building Permits are trending sideways/downwards.
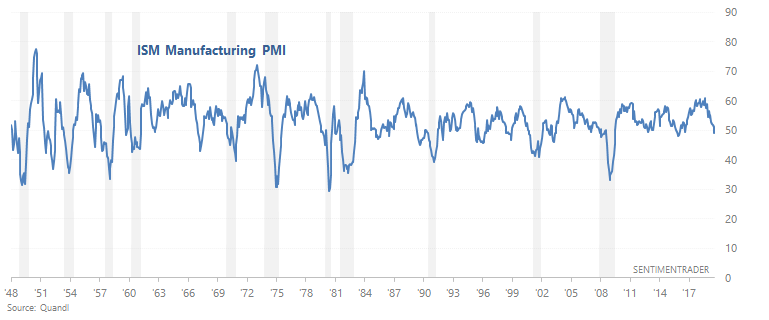
- Manufacturing-related data remains weak. The ISM manufacturing PMI has fallen below 50, signalling contraction.
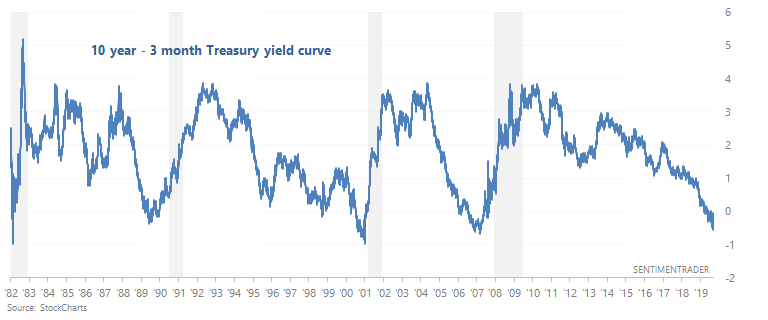
- The yield curve remains a long term bearish factor for stocks. As we've demonstrated many times here at SentimenTrader, yield curve inversions typically happen near the end of economic expansions and bull markets.
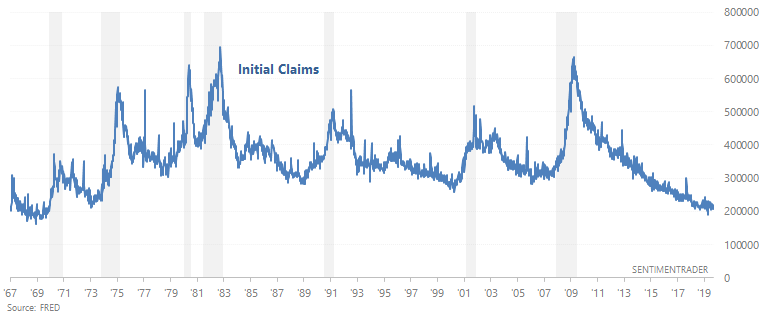
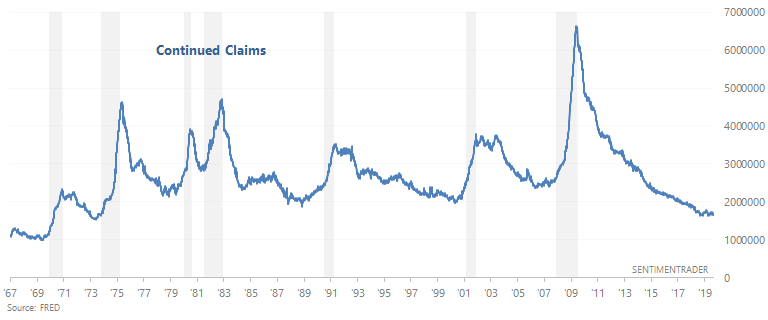
- The labor market is still a bullish factor for macro. 2 leading labor market indicators - Initial Claims and Continued Claims - continue to trend sideways. In the past, Initial Claims and Continued Claims trended upwards before recessions began.
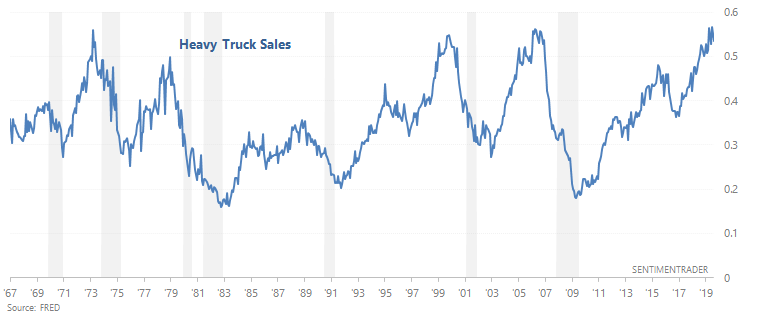
- Heavy Truck Sales is still a bullish factor for macro because this indicator is still trending upwards. In the past, Heavy Truck Sales trended downwards before recessions began.
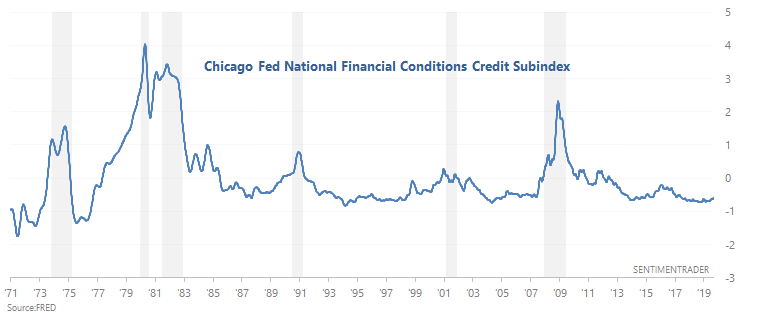
- Financial conditions are semi-weak, but there has yet to be significant deterioration.
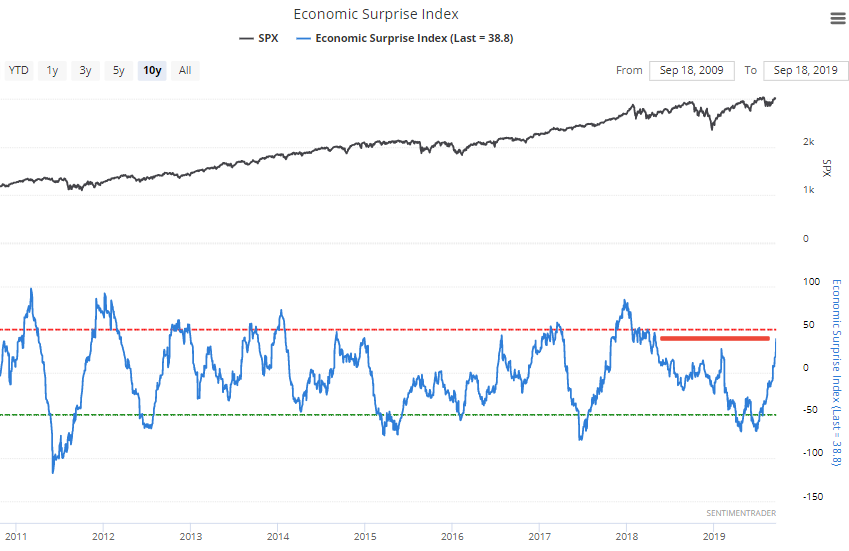
As I mentioned on Thursday, U.S. economic data is beating analysts' expectations (probably due to depressed expectations). The Citigroup Economic Surprise Index has risen to the highest level since early-2018.
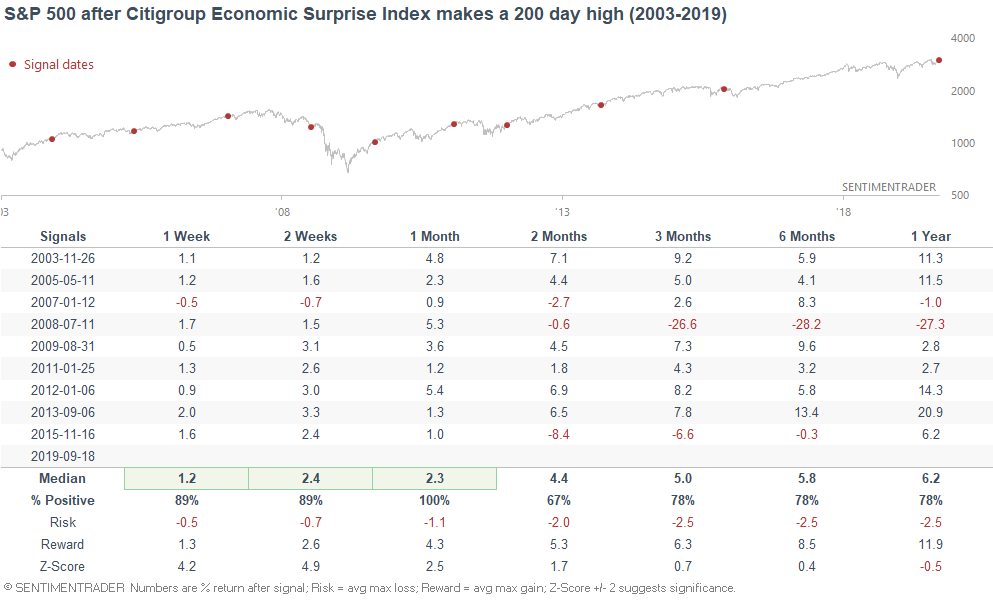
When the Economic Surprise Index rose to its highest level in 200 days in the past, the S&P usually did well over the next month:
And lastly, the Conference Board LEI remains unchanged at an all-time high.
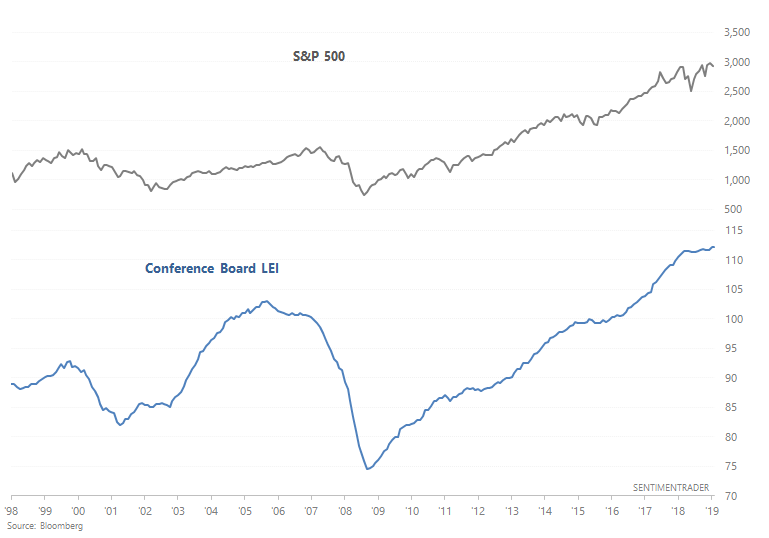
The Conference Board LEI is best used as a fundamental-based trend following indicator. I.e. be long the S&P 500 unless the Conference Board LEI is trending downwards. The following chart compares:
- Buy and hold the S&P 500.
- Buy the S&P 500 when the Conference Board LEI's 6 month average is going up. Otherwise, buy the Bloomberg Barclays U.S. Treasury Bond Index
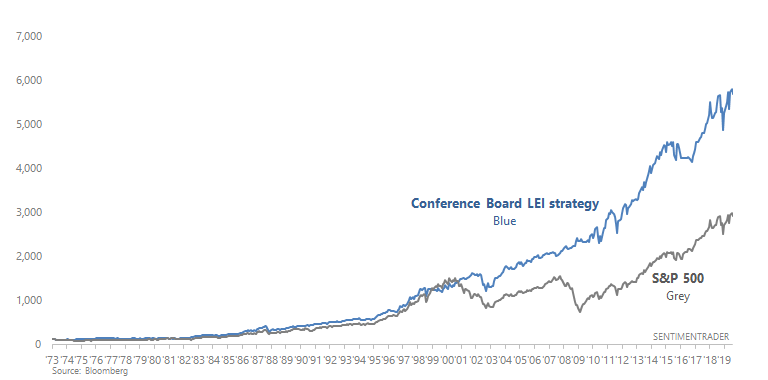
This strategy is currently long the S&P 500.
Technicals (3-6 months)
Most stats suggest that the stock market's 3-6 month outlook is bullish, although there are now some bearish stats mixed inbetween. Let's start with the bullish stats, and then we'll look at the bearish ones.
Bullish:
Volatility
As Jason pointed out on Friday, the Russell 2000's implied volatility has diverged from the S&P 500's implied volatility, as traders bet on small caps being hit by higher vol.
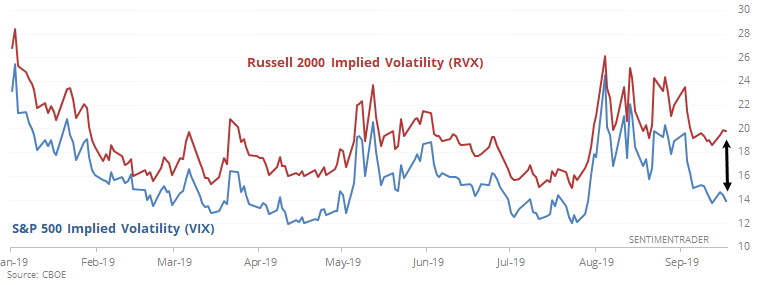
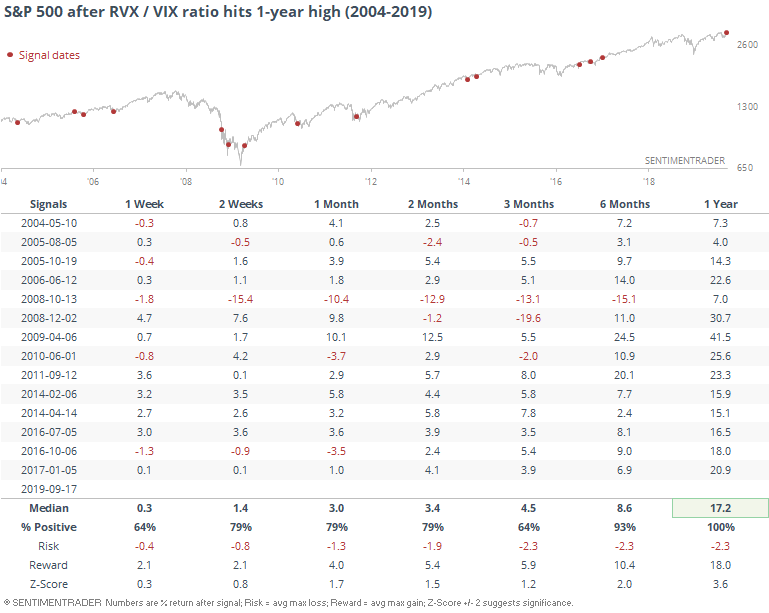
But the divergence wasn't a problem for the stock market in the past:
Correlations
On Tuesday Jason mentioned that the correlation between gold and the USD is turning increasingly positive. This is typically seen as a bearish sign for global markets, since both assets are seen as safe havens.
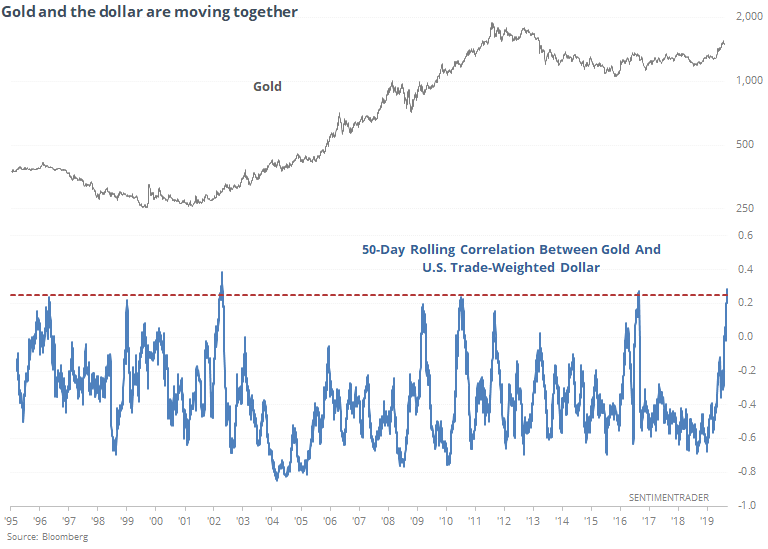
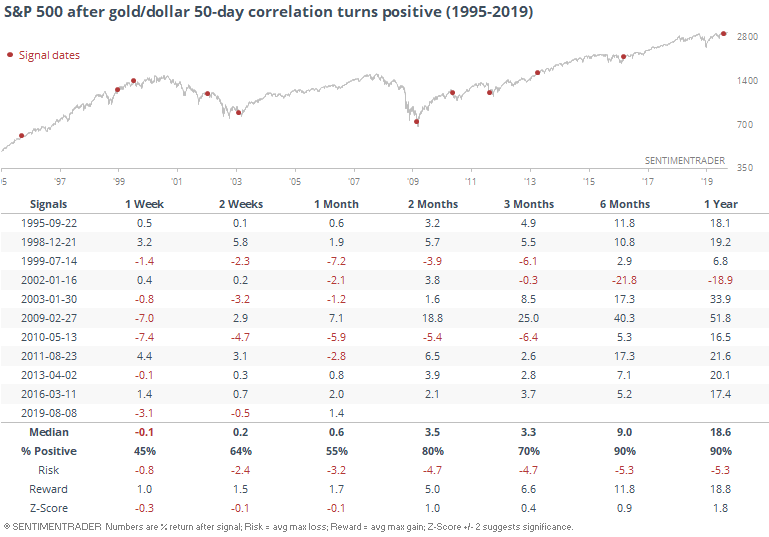
But while this did sometimes happen during crises, such a positive correlation tends to occur towards the middle/end of a crisis. Hence why the S&P's 1 year forward returns are mostly bullish:
Long term breadth
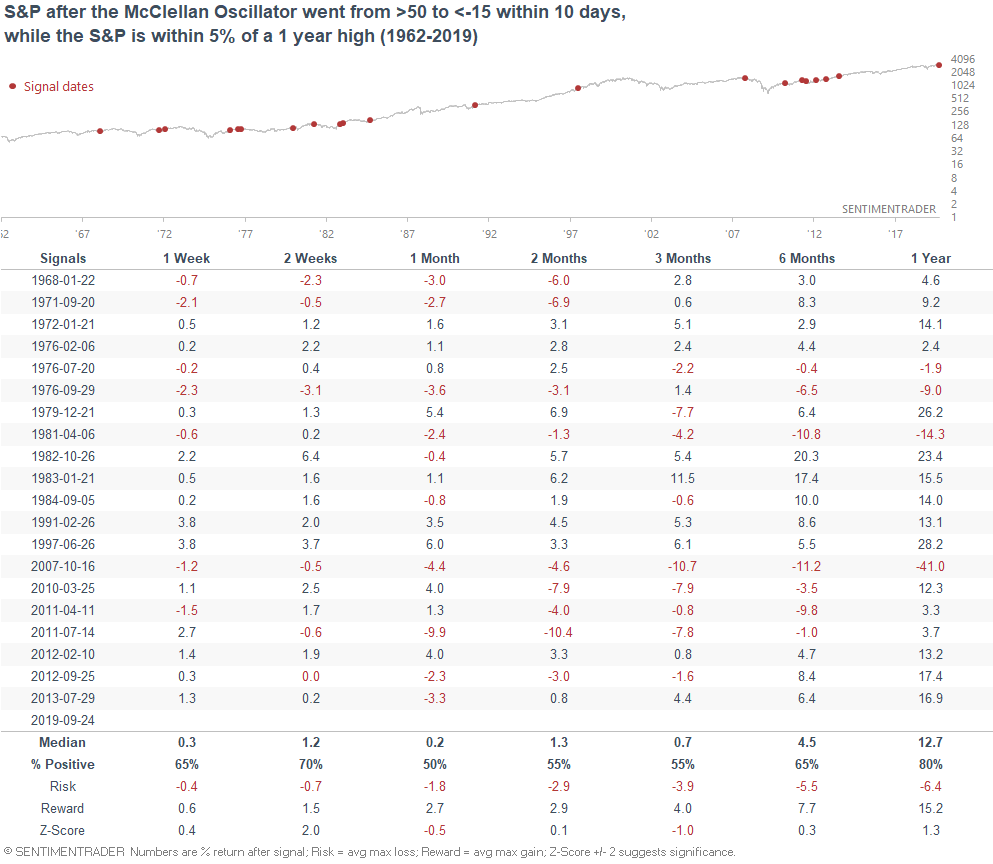
The McClellan Summation Index - a long term look at the momentum of the market's breadth - has been positive for 170 days.
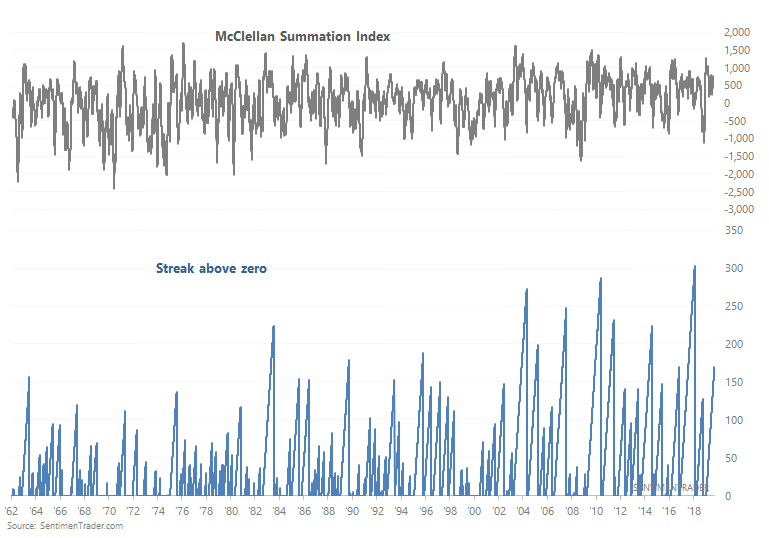
These long streaks of positive breadth were mostly bullish for stocks over the next few weeks and months.
Neutral/Bearish:
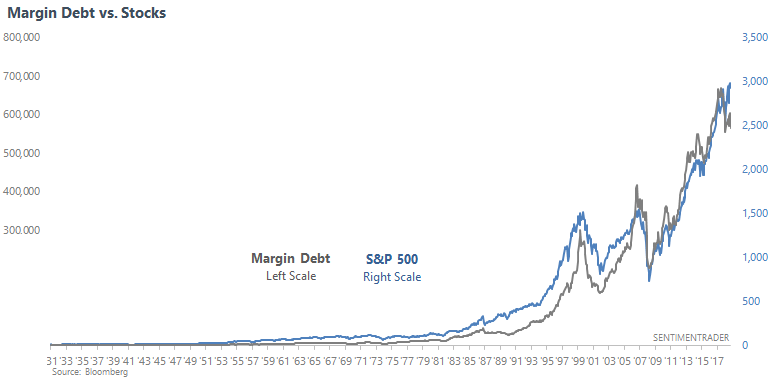
Margin Debt
Margin debt (nominal #) tends to move inline with the stock market. At times these can diverge, and it usually isn't a good sign for stocks:
- When margin debt growth significantly outpaces the S&P 500's growth, the S&P tends to fall.
- When margin debt growth significantly lags the S&P's growth, the S&P tends to face headwinds going forward.
*The 2nd problem isn't as bearish as the first.
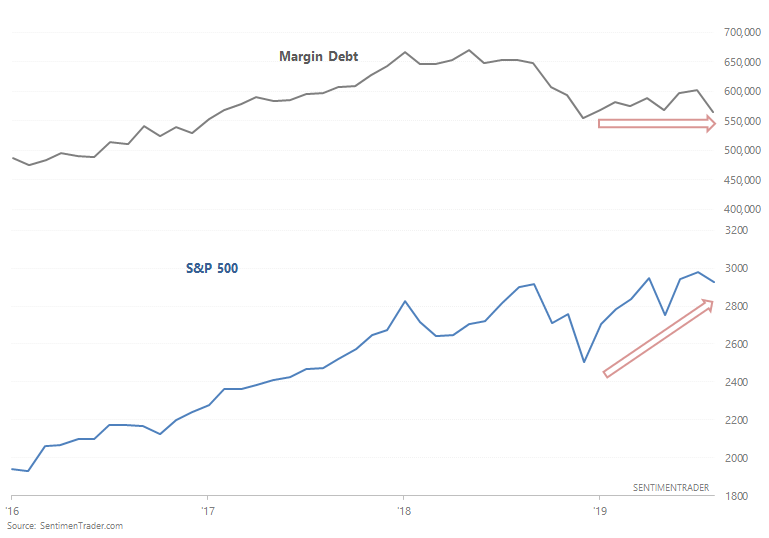
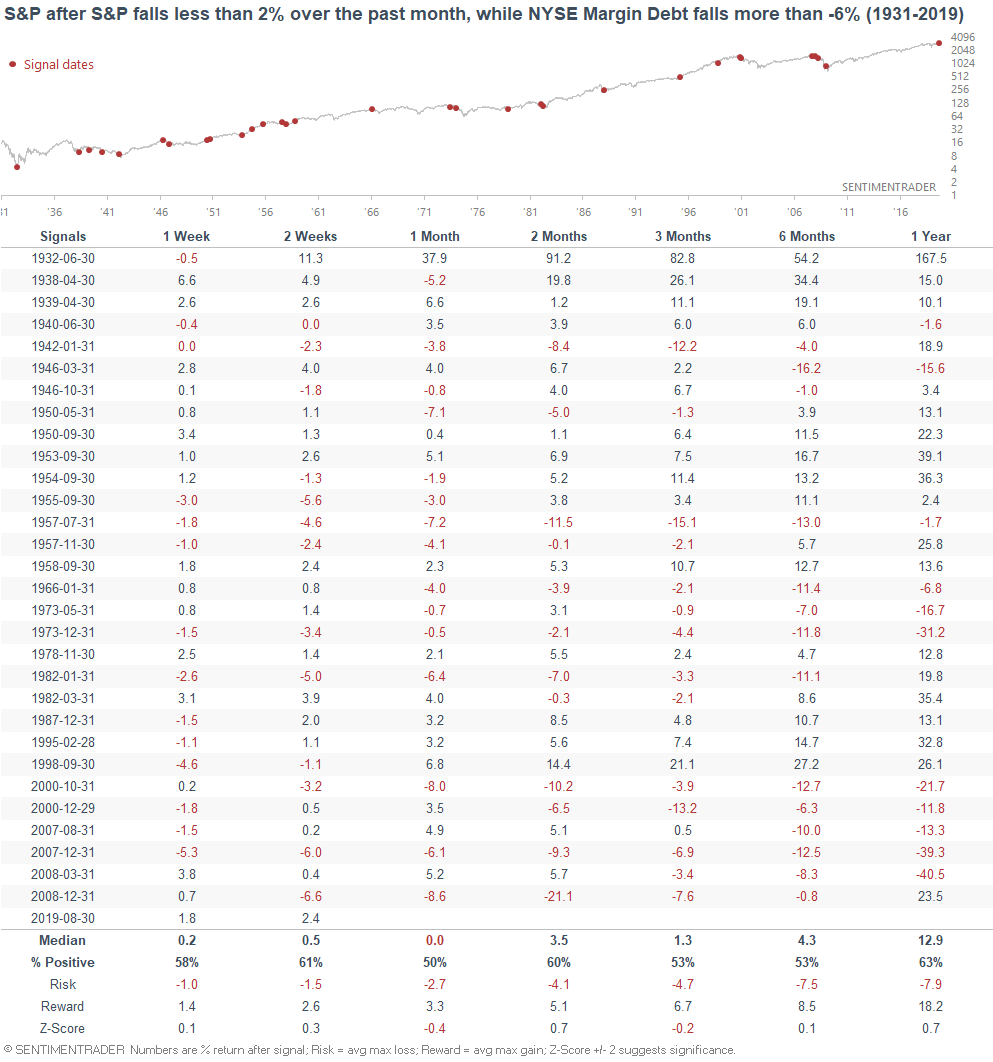
Based on the latest margin debt figures, margin debt fell more than -6% in August while the S&P fell less than -2%. The last 2 times this happened were during the 2000-2002 and 2007-2009 bear markets.
If we look at every historical case from 1931-present, the S&P's returns over the next 3-6 months were worse than random.
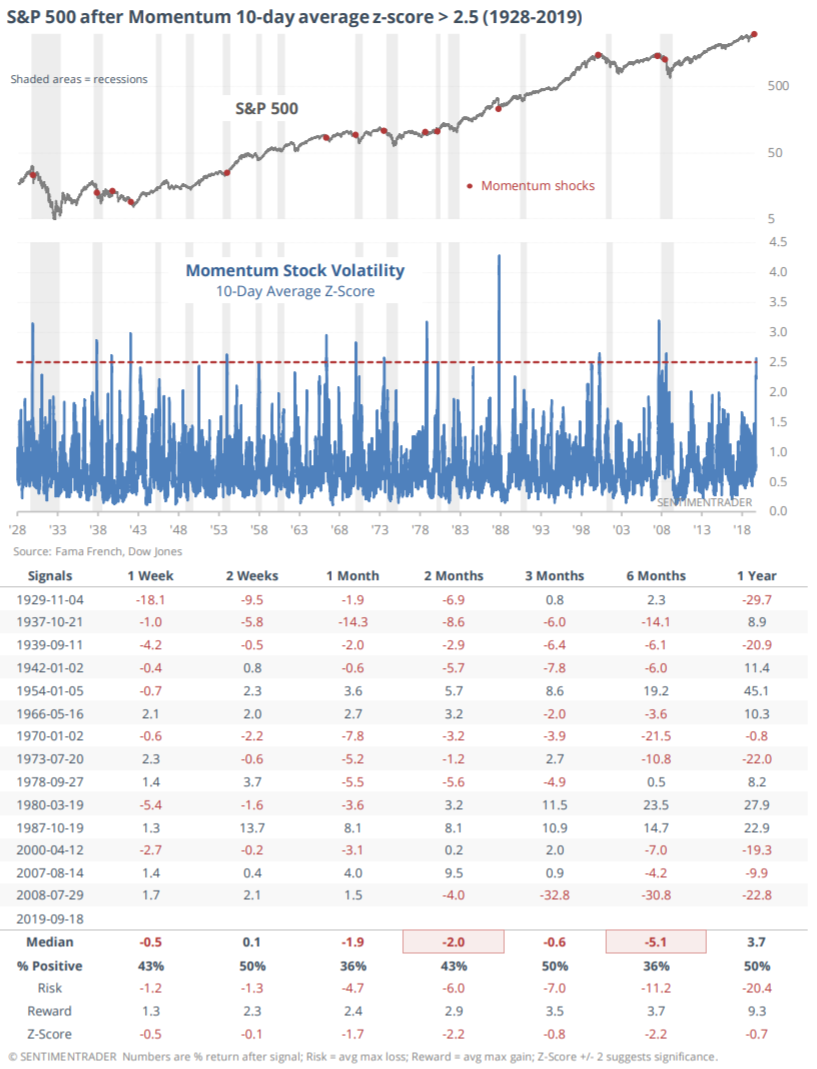
Momentum
Among the themes that made headlines this week was the sudden rotation from momentum to value. The 10-day average z-score of momentum's daily moves has jumped to 2.5 standard deviations.
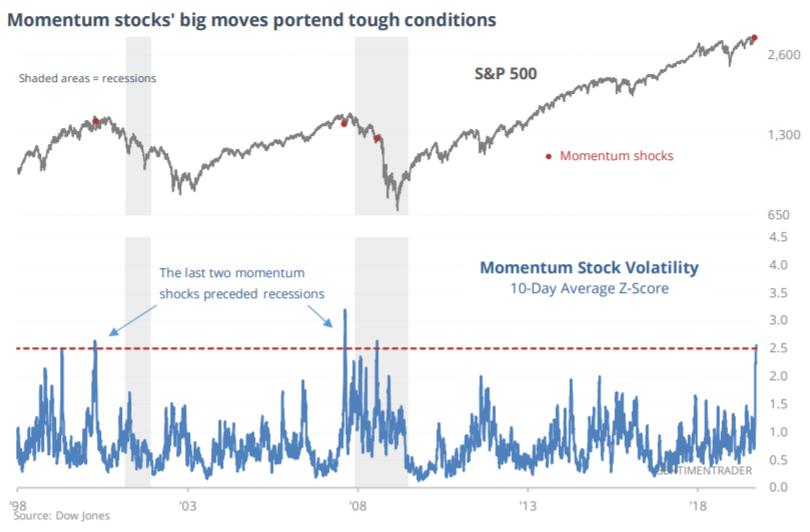
Overall, this wasn't good for stocks going forward.
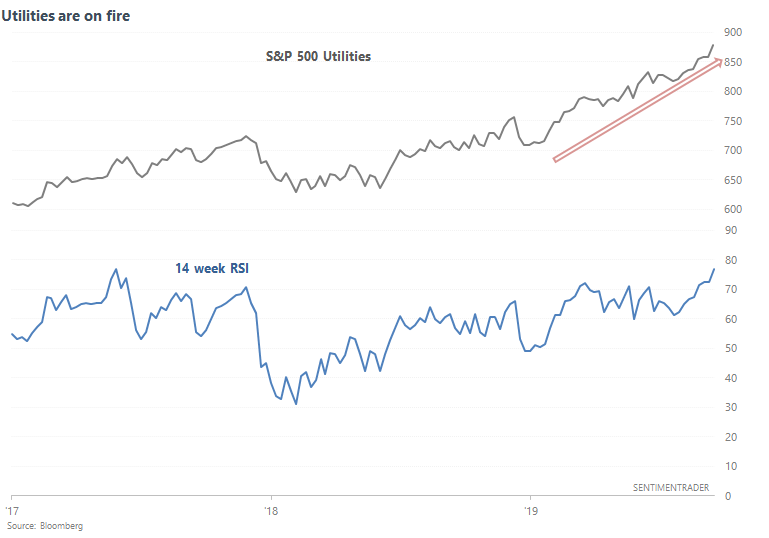
Shift into defensives
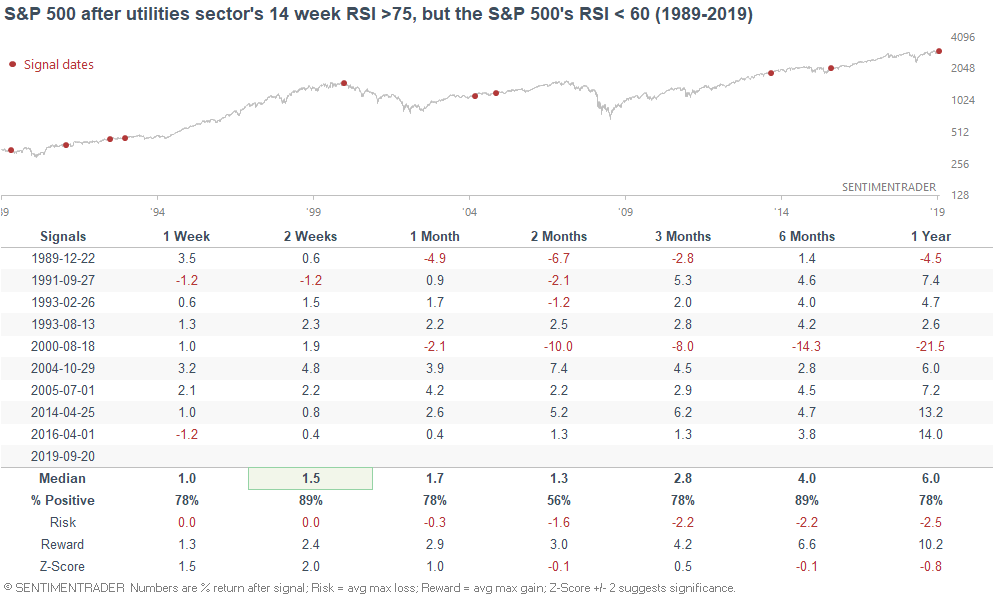
With so many things to "worry about", investors and traders continue to bid up utility stocks. The S&P 500 Utilities sector's 14 week RSI is now at 76.
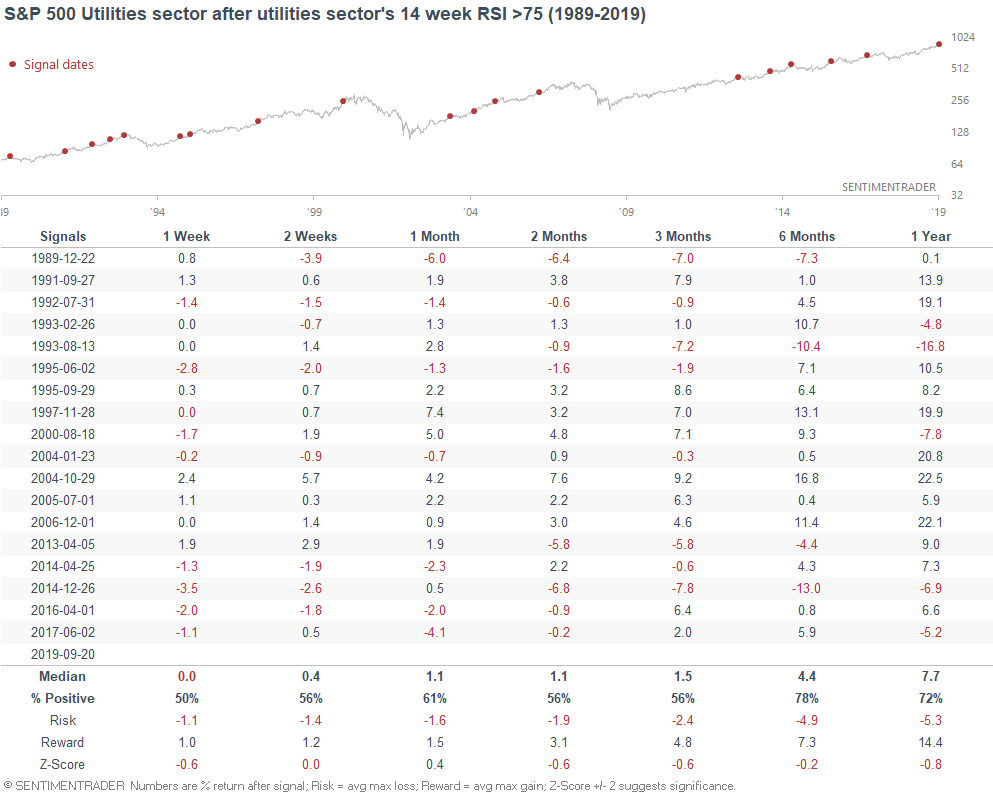
When this happened in the past, utilities often underperformed over the next 2-3 months.
The broader S&P 500 performed a little bit better:
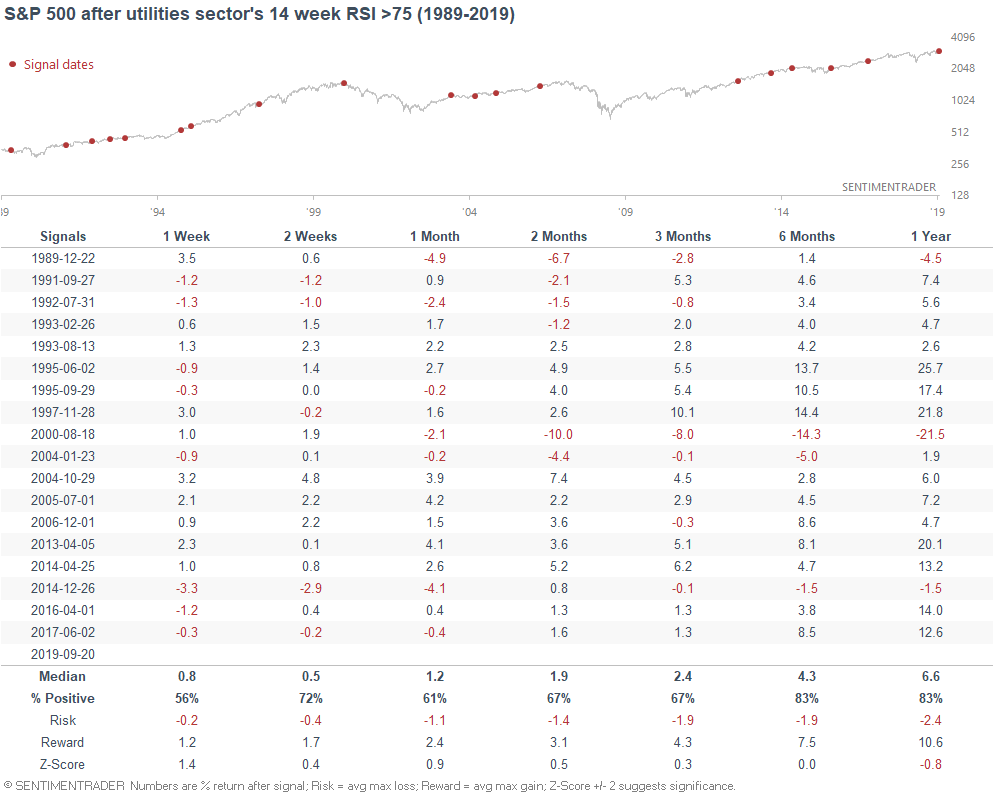
And if we specifically look at the cases in which utilities were overbought but the broad S&P wasn't, the broad S&P tends to catch up.
Sentiment & flows
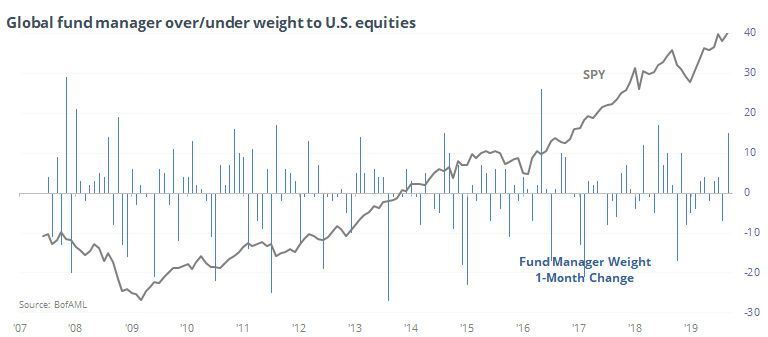
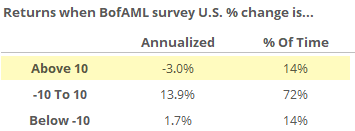
Jason noted on Tuesday that large money managers have become significantly more optimistic towards U.S. equities (+15%). Large swings towards optimism in the past weren't too good for equities going forward.
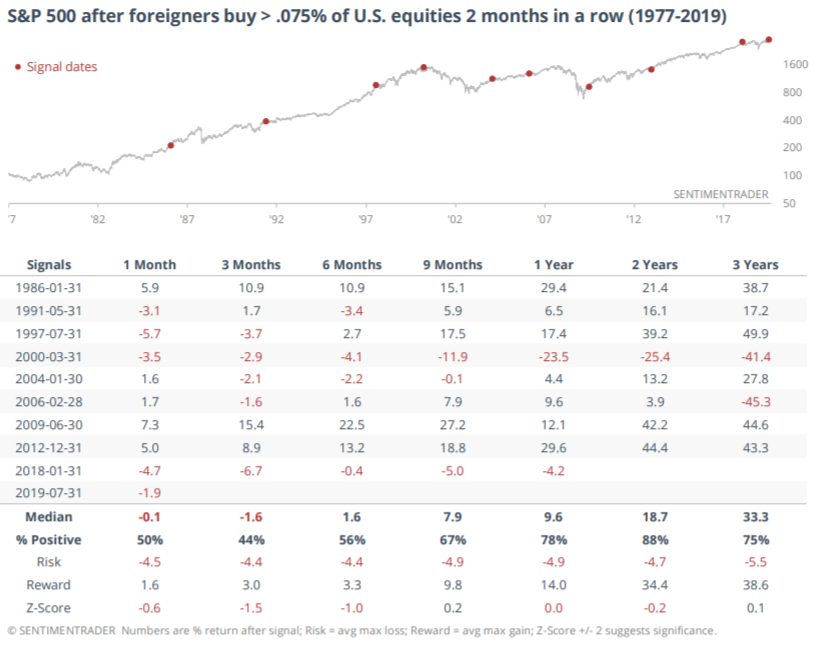
Similarly, foreign investors are coming back to U.S. stocks in size for the first time in a year.
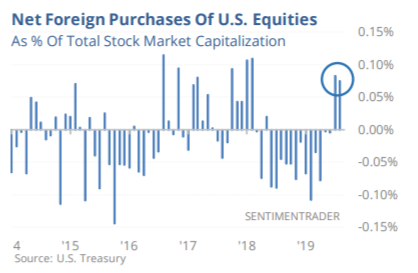
When this happened in the past, the S&P's returns over the next half year were below average:
Meanwhile, CFO's have become increasingly pessimistic on the economy.
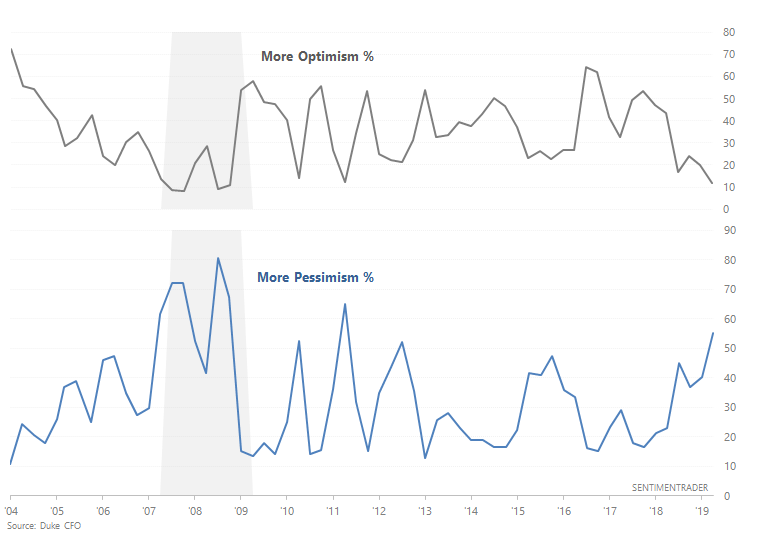
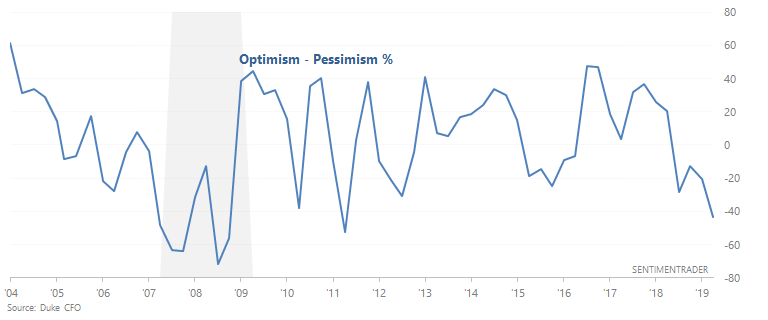
When CFO's were this pessimistic on the past, their worst fears didn't always turn out to be true.
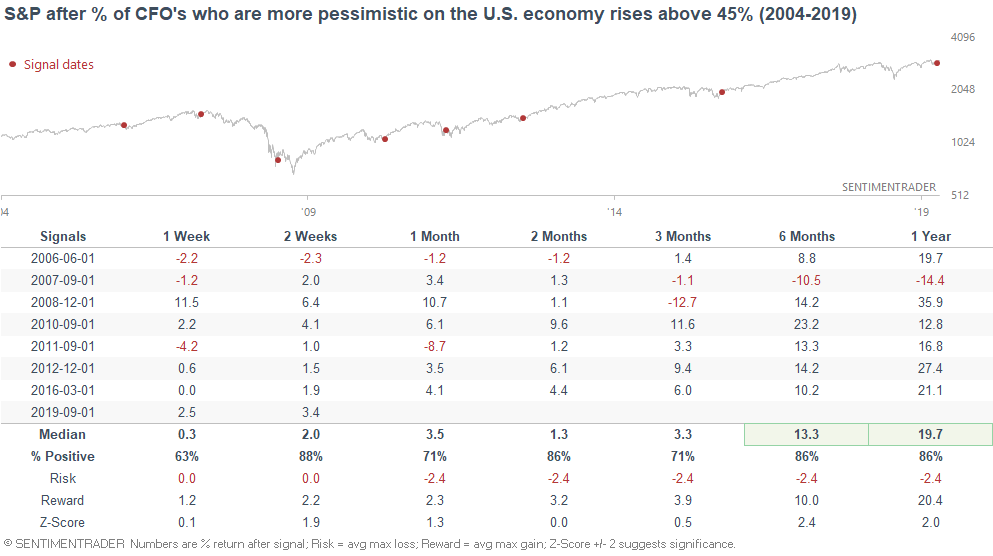
Their fears are more a result of what we already know: global growth slowdown + trade war. Sometimes their fears turn out to be correct (e.g. in 2007), other times their fears were later alleviated as the global economy recovers (e.g. 2010, 2011, 2012, 2015).
Overall, sentiment is a mixed bag right now. Neither clearly bullish nor clearly bearish.
Short term breadth
Looking at breadth, a pattern emerges:
- Most stocks in popular indices (e.g. S&P 500) are trending upwards
- Few stocks are sinking (e.g. making 52 week lows, oversold)
- Fewer than expected stocks are making new 52 week highs
While this isn't ideal, it's not clearly bearish either. Depending on how you look at it, this can come off as either bullish or bearish. Overall, breadth is a mixed factor for the stock market right now.
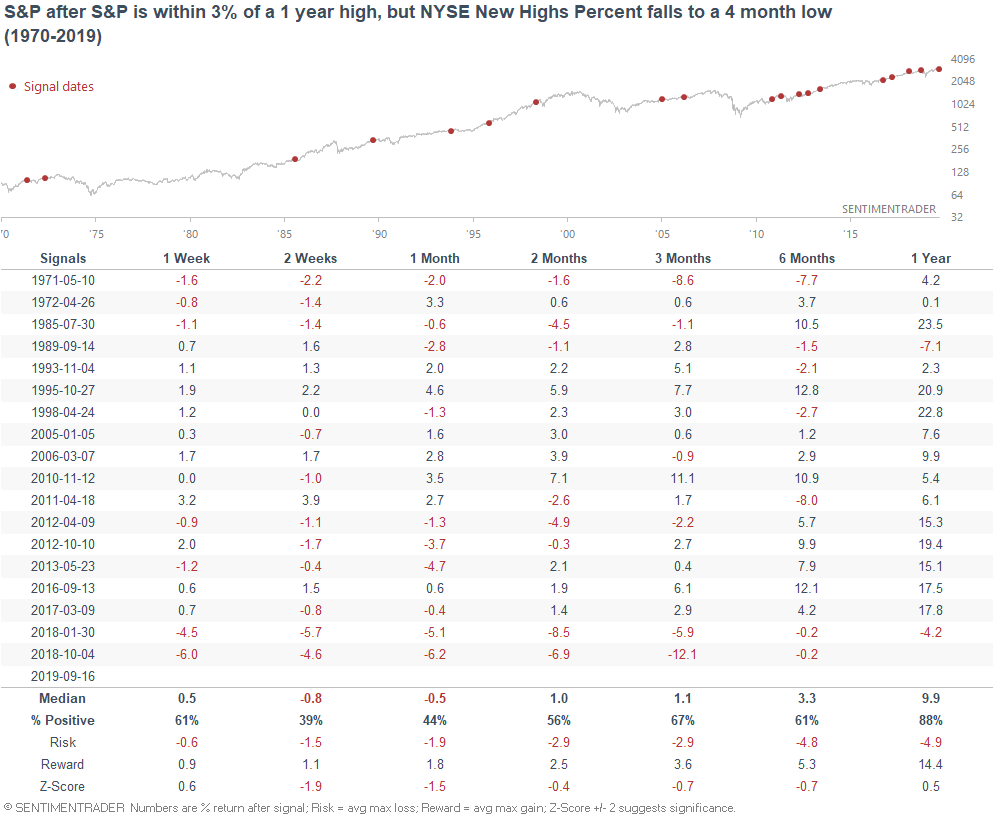
For example, relatively few issues were making new 52 week highs while the U.S. stock market approached all-time highs this week.
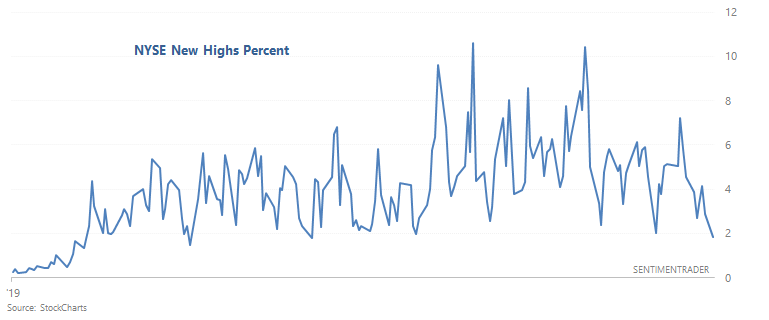
This is a slight short term concern for stocks, especially if this persists.
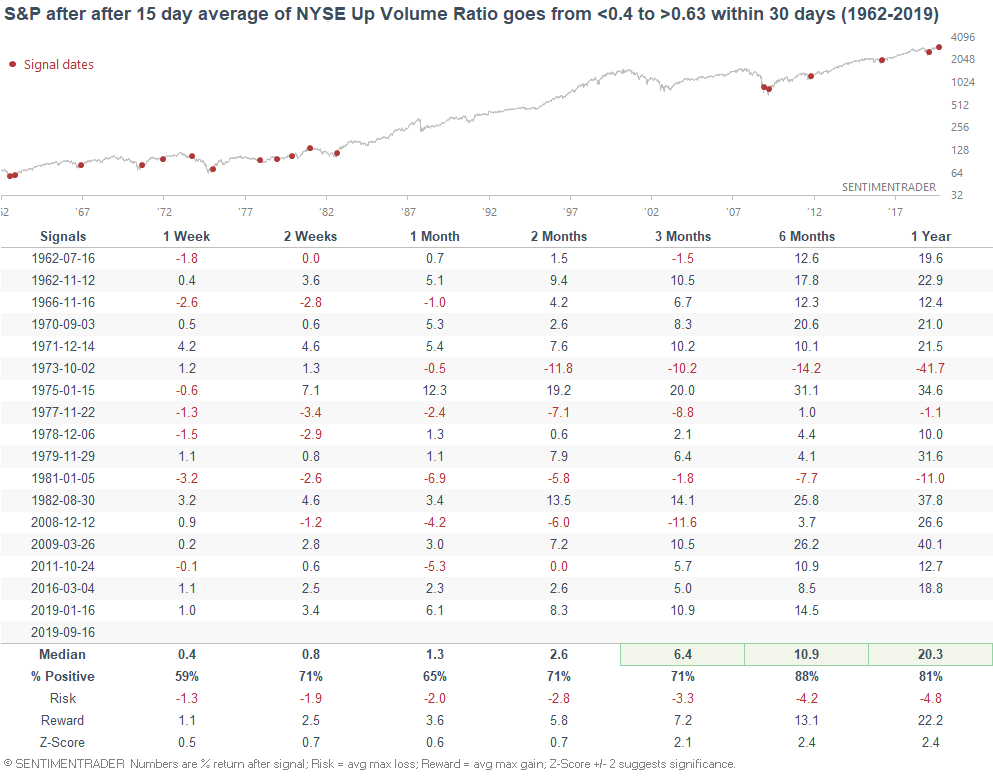
Meanwhile, more money is flowing into stocks that are going up than stocks that are going down.
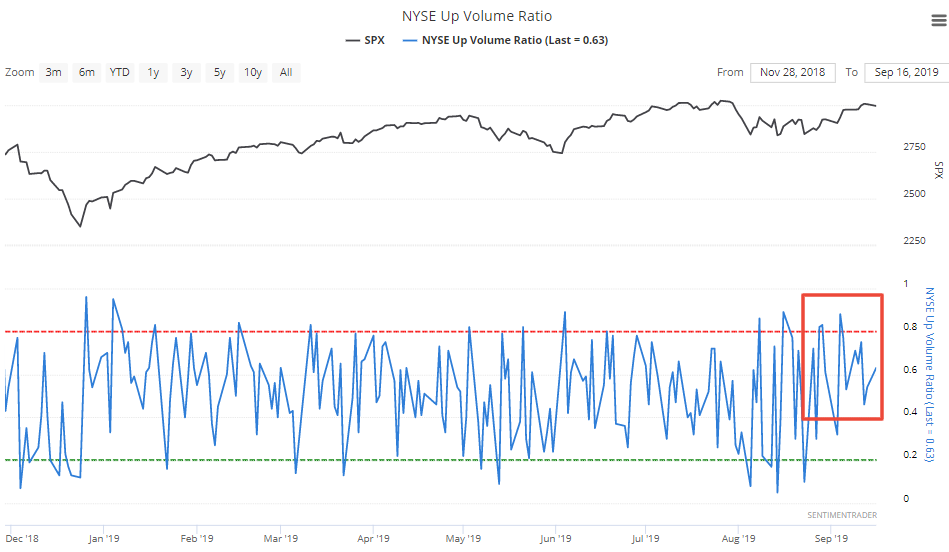
When this happened in the past, the S&P often rallied significantly over the next 6-12 months.
*Economic Data charts (from "Fundamentals")
Housing Starts:
Building Permits:
New Home Sales:
ISM Manufacturing PMI:
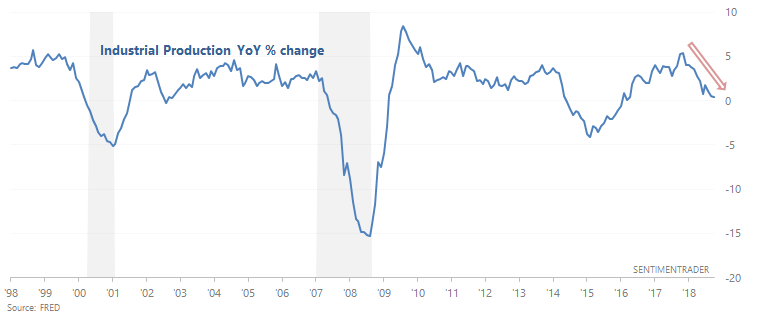
Industrial Production:
10 year - 3 month yield curve:
Initial Claims:
Continued Claims:
Heavy Truck Sales:
Chicago Fed National Financial Conditions Credit Subindex:
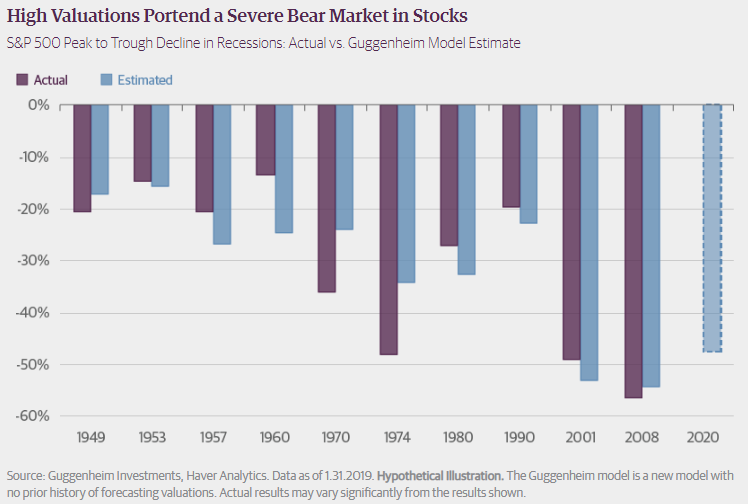
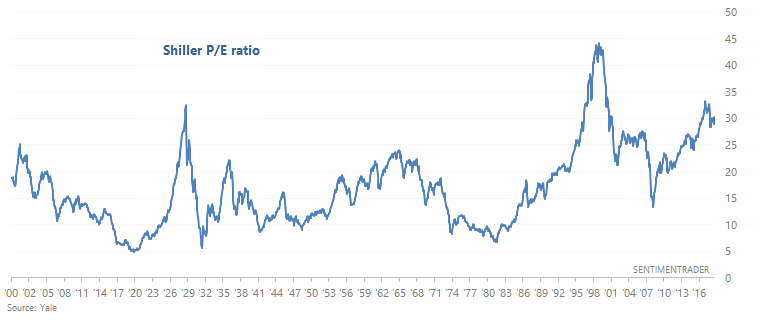
Popular valuation indicator Shiller P/E:
Here's an interesting chart from Guggenheim which demonstrates the relationship between the size of a recession-driven bear market and the stock market's valuations before the bear market: