Market overview: almost at an all-time high
The stock market is within an inch of its all time high. Here's my market outlook:
- Long term risk:reward doesn’t favor bulls. Valuations are high, but valuations can remain high for years.
- Fundamentals (6-12 months): still bullish because there is no significant U.S. macro deterioration, but this could change IF macro data deteriorates significantly over the next few months
- Technicals (3-6 months): mostly bullish
- Technicals (1-2 months): no clear edge in either direction.
Fundamentals (6-12 months)
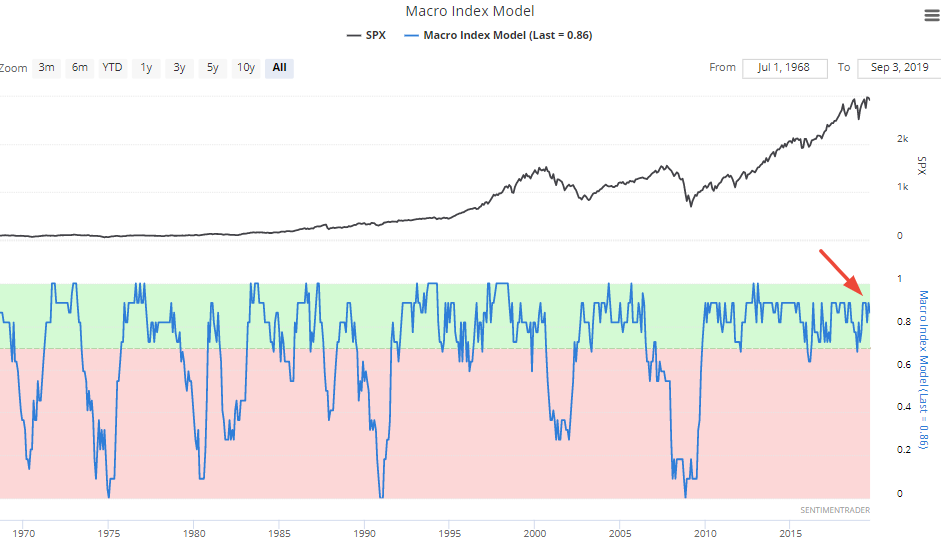
The economy and the stock market move in the same direction in the long term. Hence, leading economic indicators are also long term leading indicators for the stock market.
Here is our Macro Index, which aggregates 11 leading indicators. Overall, there is no significant U.S. economic deterioration right now. What will happen to macro in the future? I don't know. Instead of trying to guess the future, macro tells us how to react and trade day-by-day depending on what's happening right now.
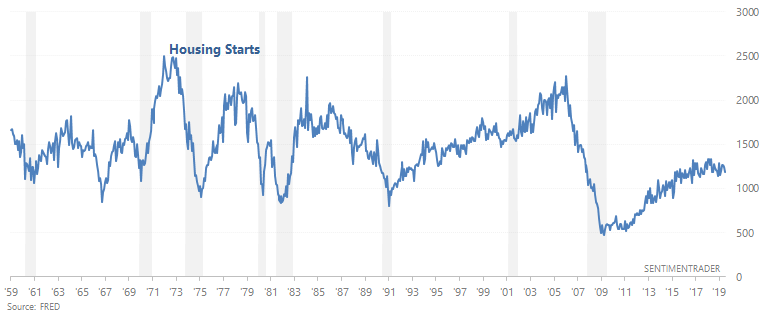
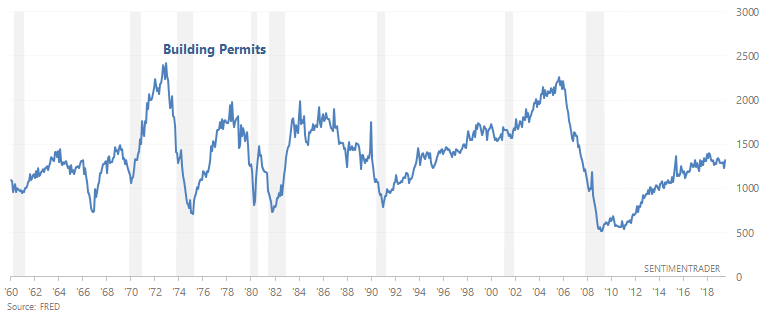
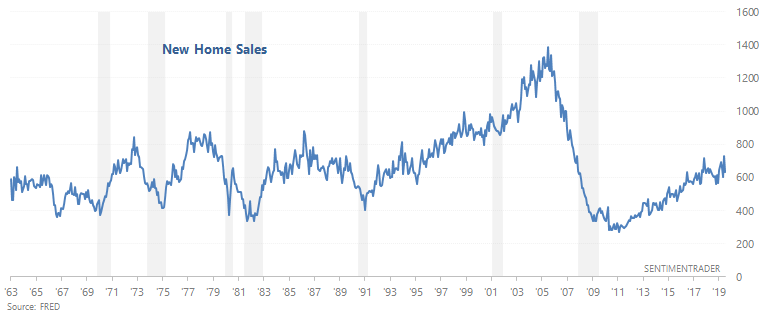
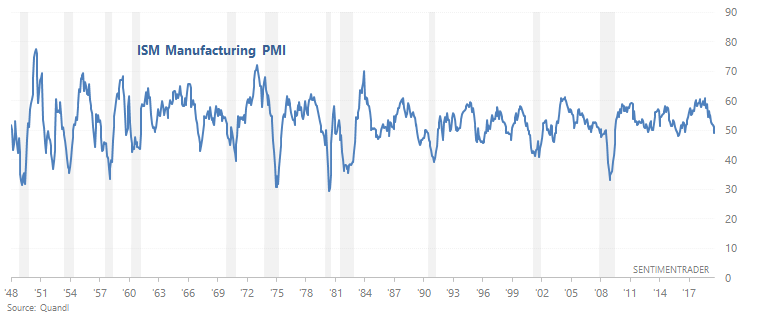
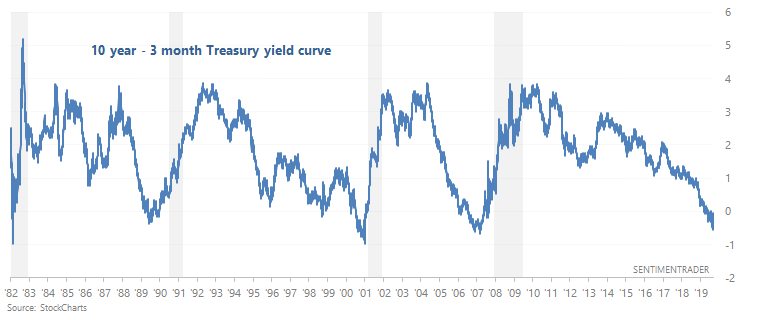
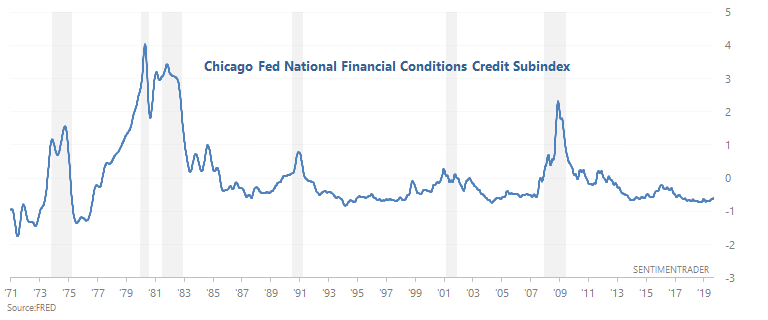
The main weak points in U.S. macro revolve around trade, manufacturing, and the yield curve. Housing and financial conditions are semi-weak, but there has yet to be significant deterioration. Let's take a look at some data. (Please see the specified economic-data charts at the bottom of this post.)
- Housing remains slightly weak, which makes this a slight negative for macro right now. In the past, Housing Starts, Building Permits, and New Home Sales trended downwards before recessions began. Housing Starts and Building Permits are trending sideways/downwards right now, while New Home Sales is trending sideways.
- Manufacturing-related data remains weak. The ISM manufacturing PMI has fallen below 50, signalling contraction.
- The yield curve remains a long term bearish factor for stocks. As we've demonstrated many times here at SentimenTrader, yield curve inversions typically happen near the end of economic expansions and bull markets.
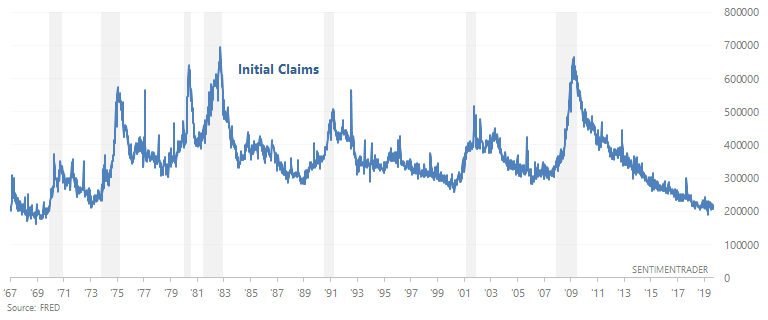
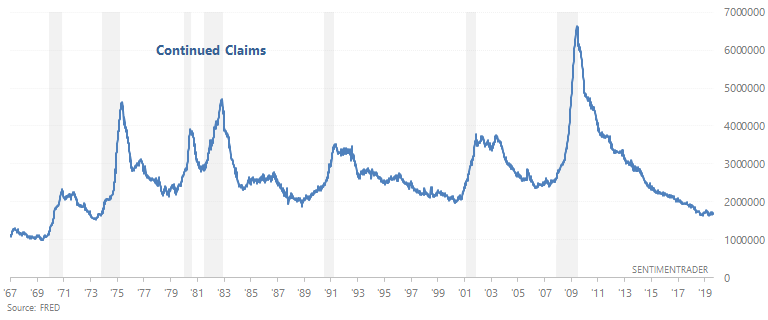
- The labor market is still a bullish factor for macro. 2 leading labor market indicators - Initial Claims and Continued Claims - continue to trend sideways. In the past, Initial Claims and Continued Claims trended upwards before recessions began.
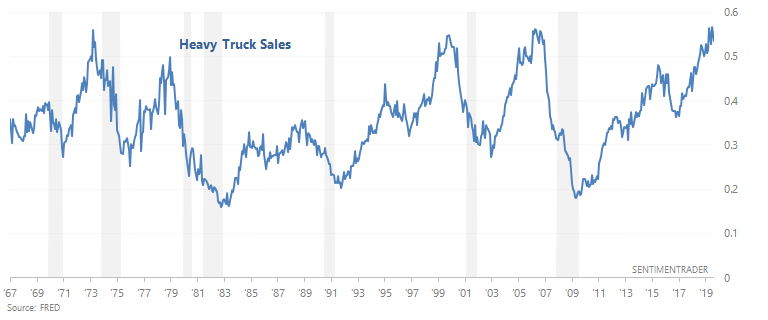
- Heavy Truck Sales is still a bullish factor for macro because this indicator is still trending upwards. In the past, Heavy Truck Sales trended downwards before recessions began.
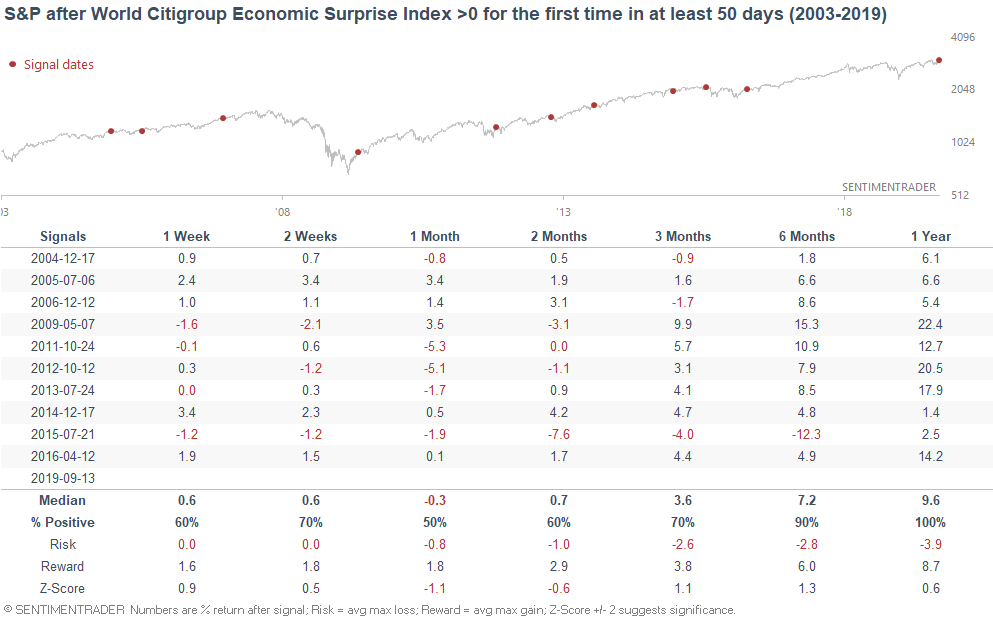
As I mentioned on Tuesday, Citigroup's World Economic Surprise Index has finally turned positive after the longest negative streak since this data series began.
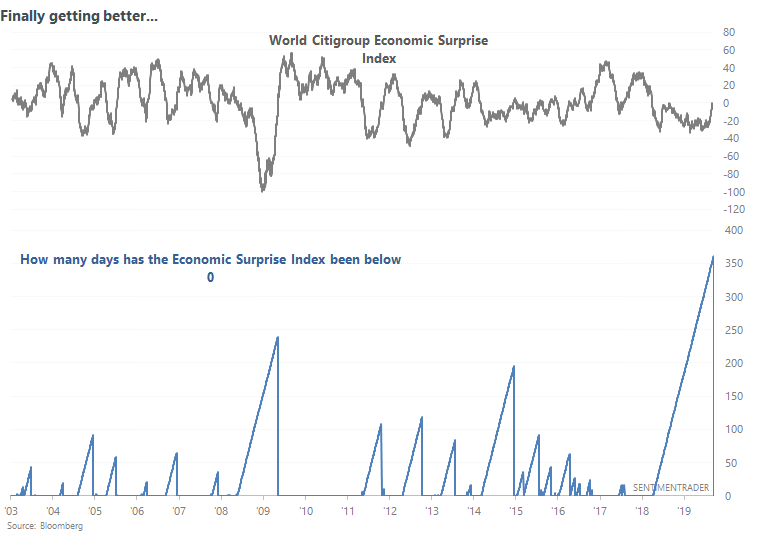
When economic data finally started to outperform expectations (or when expectations have been lowered fast enough to match reality), the U.S. stock market usually did well over the next 6-12 months.
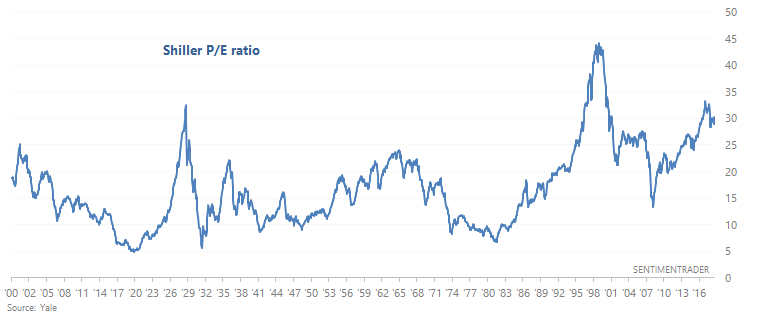
While the bull market may continue, long term risk:reward does not favor bulls right now. Valuations are high, which suggests that the stock market's returns on a 5-10 year forward basis will be worse than random. However, valuations can remain high for years before a bear market begins. Valuations provide the powder for a stock market "explosion" (i.e. big bear market), whereas recessions provide the spark. And a recession right now is unlikely.
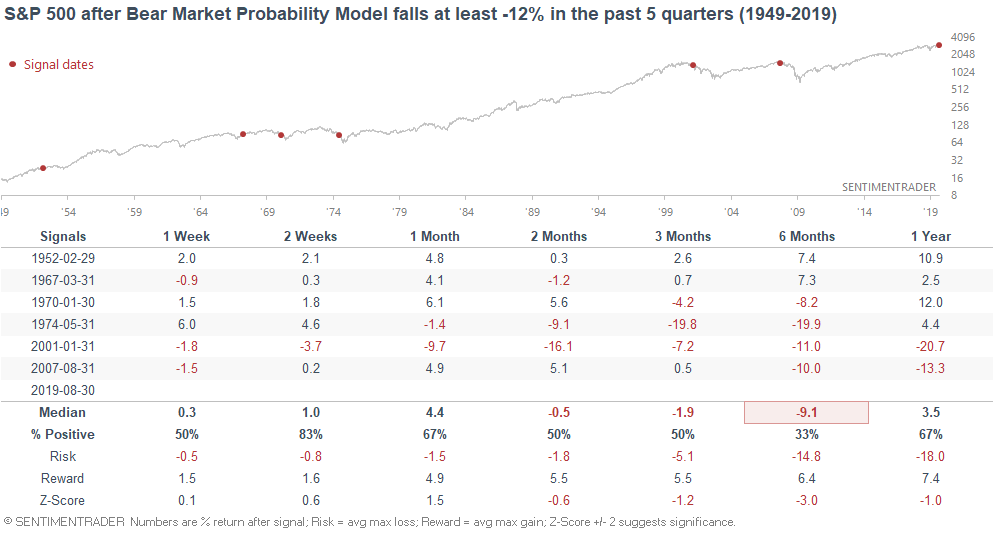
The Goldman Sachs Bear Market Model is rolling over from a dangerous level right now.
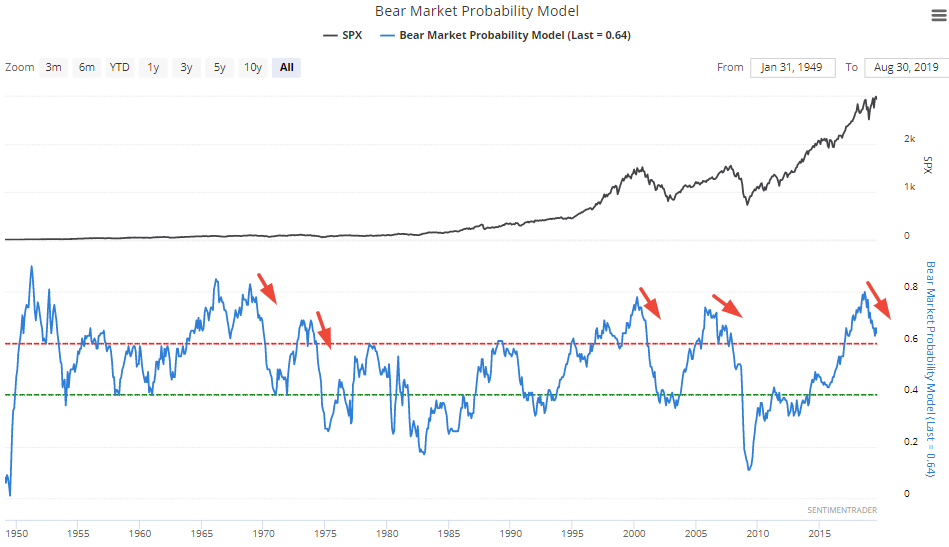
When this happened in the past, the S&P often performed poorly over the next 6 months. This is how the last 4 big bear markets began.
Technicals (3-6 months)
The stock market is usually hard to predict on a 1-2 month forward basis, unless there is an extreme. There are no short term extremes right now. So let’s focus on a 3-6 month forward basis. Most stats suggest that the stock market's 3-6 month outlook is bullish, although there are a few bearish stats mixed inbetween. This is to be expected. Never will there be a case in which the future is 100% bullish or 100% bearish.
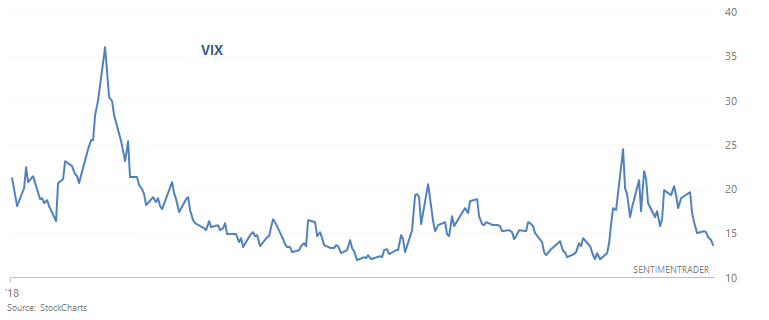
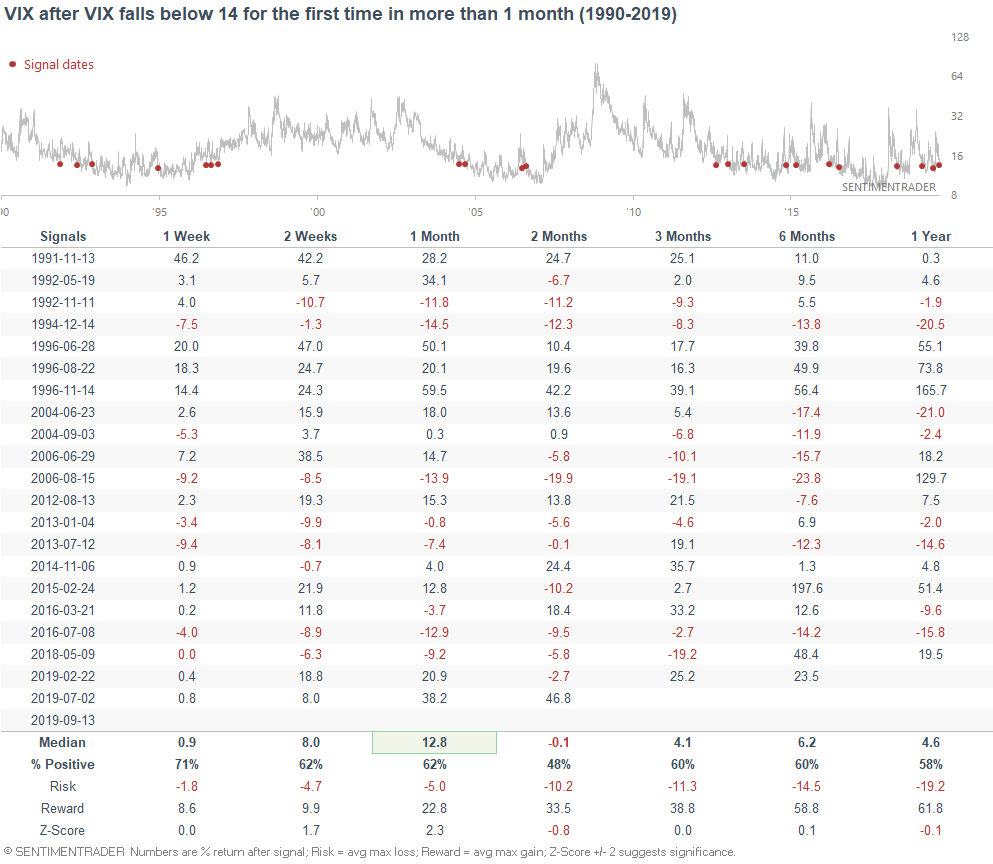
VIX
With the stock market rallying towards all-time highs, volatility continues to subside. VIX has now fallen below 14.
When volatility subsided in the past, the S&P usually did well over the next 2-3 months. 6-12 month forward returns were also mostly bullish because towards the end of a bull market, volatility was usually higher and trending upwards.
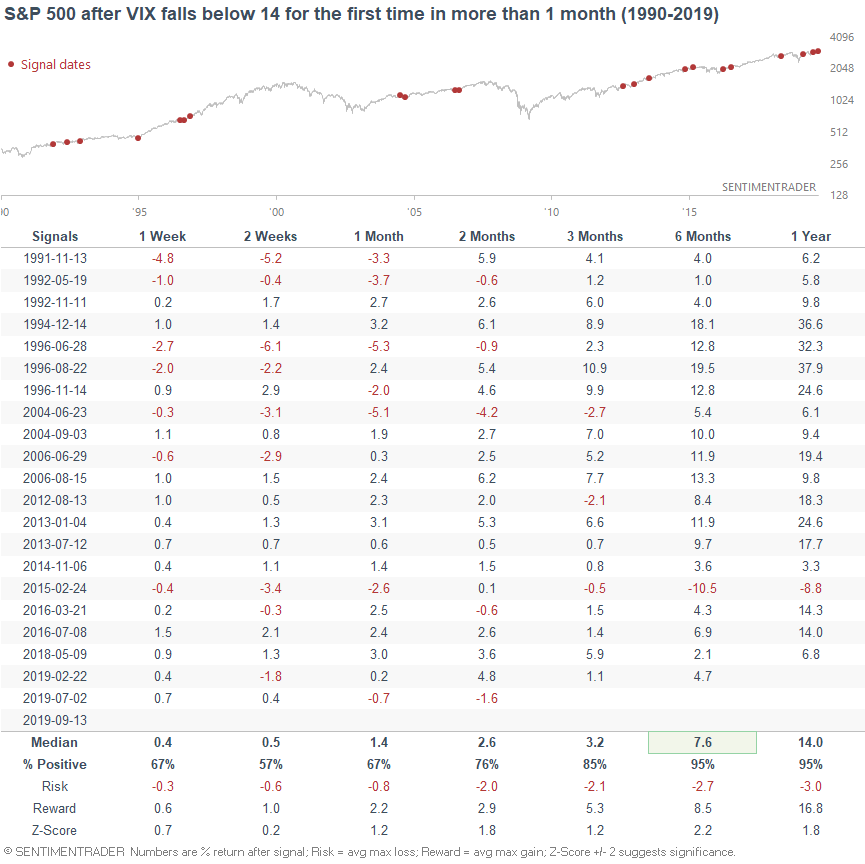
But at the same time, VIX usually didn't fall much more. By the time VIX fell to this point, its ability to keep falling over the next 1 month was limited.
Breadth
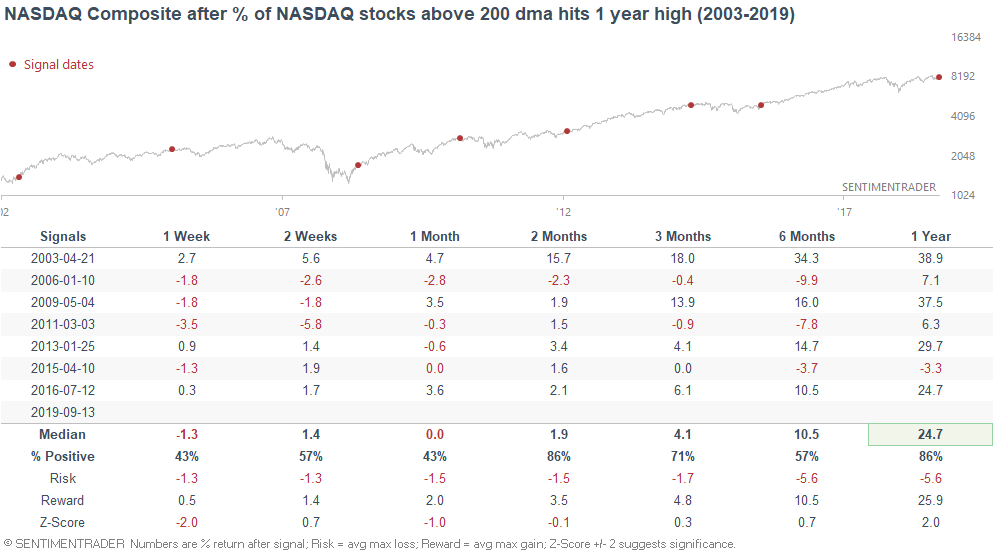
As the WSJ pointed out, various popular breadth indicators are improving. For example, the % of NASDAQ stocks above their 200 dma has set a new 1 year high.
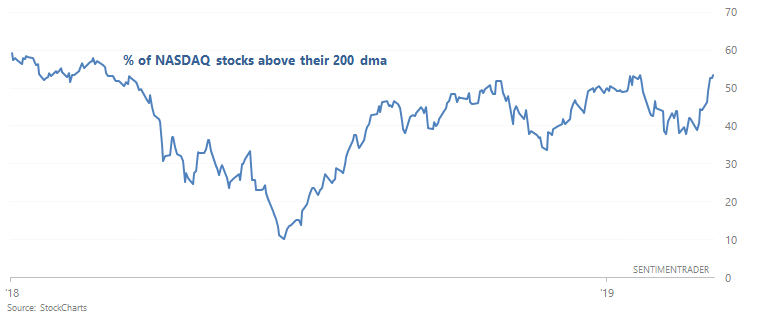
When this happened in the past, the NASDAQ Composite often pushed higher over the next 2-3 months.
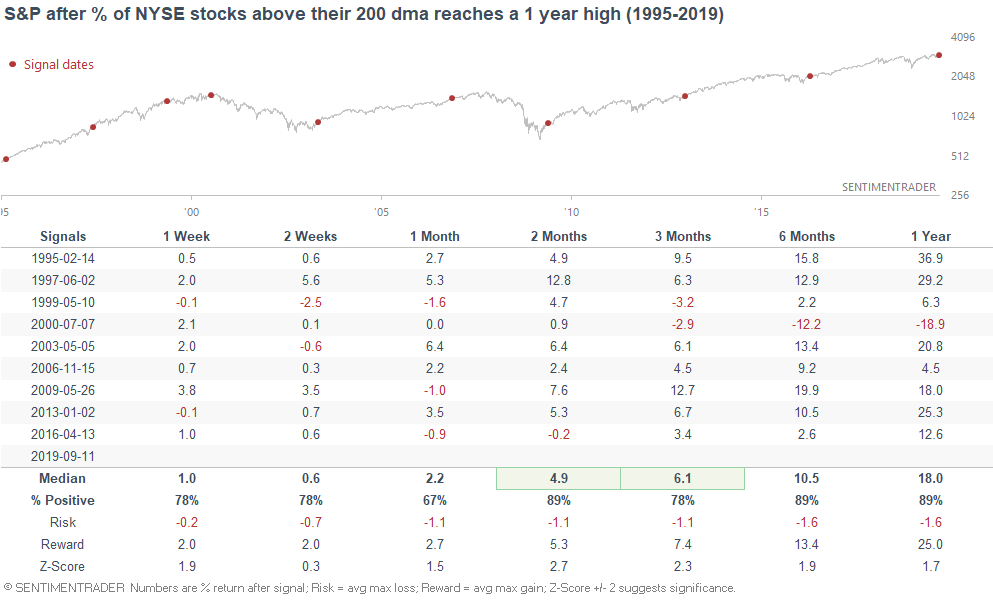
Similarly, the % of NYSE stocks above their 200 dma has hit a 1 year high.
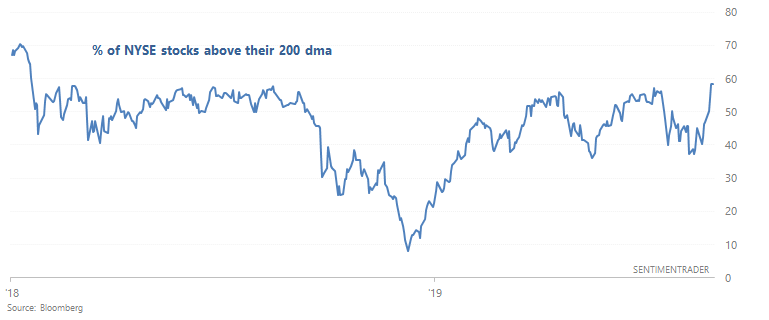
When this happened in the past, the S&P 500 often did well over the next 2-3 months.
Momentum
As plenty of people have noted, momentum stocks significantly underperformed this week, with the Dow Jones U.S. Thematic Market Neutral Momentum Index falling more than -9%.
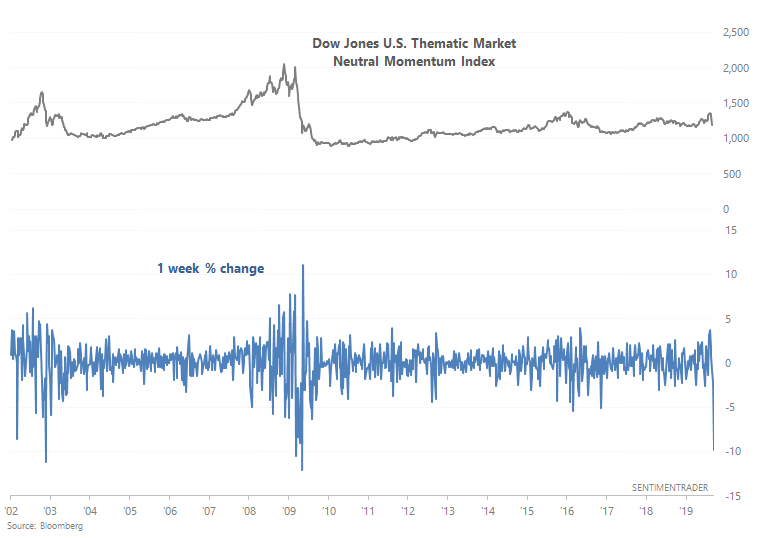
This is the largest 1 week drop since *gasp* 2009.
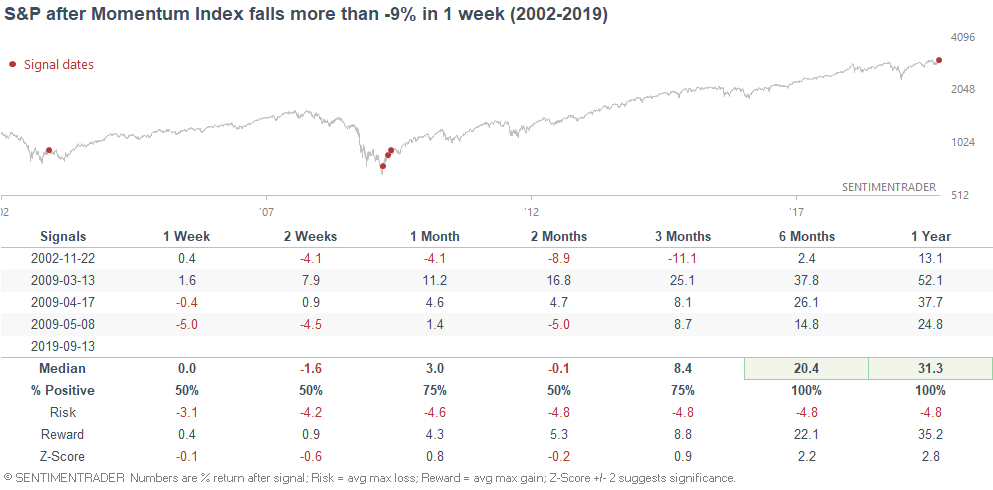
Personally, I don't think comparing today vs. 2002 and 2009 makes much sense. The stock market today is near an all-time high, whereas the historical signals occurred after 50%+ bear markets. So while such a large 1 week drop is crazy, this is not "crazy bullish" for stocks over the next 6-12 months.
Risk Appetite
As Jason mentioned on Monday, the Risk Appetite Index (which combines 3 firms' measures for risk appetite) was very low in August, and is now curling up as the stock market rallies.
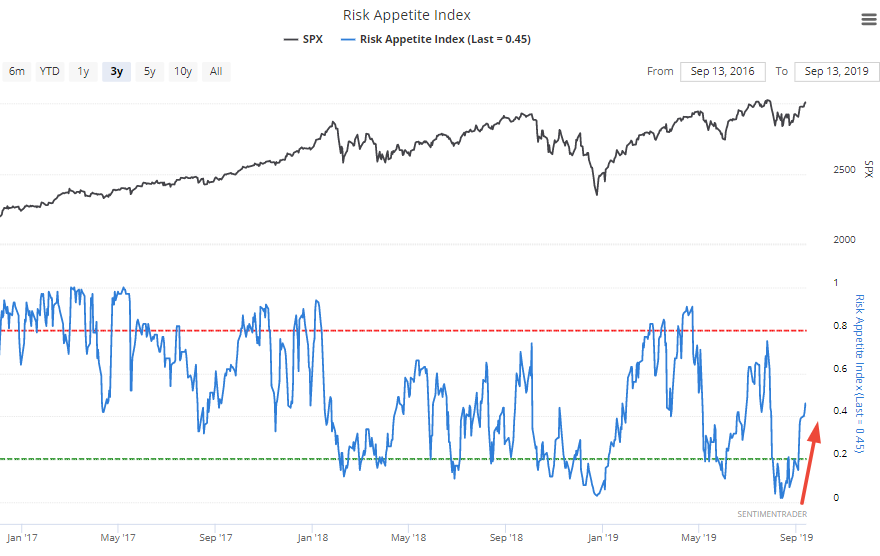
The following table illustrates what happens next to the S&P when the Risk Appetite Index went from under 10 to above 45 within 1 month:
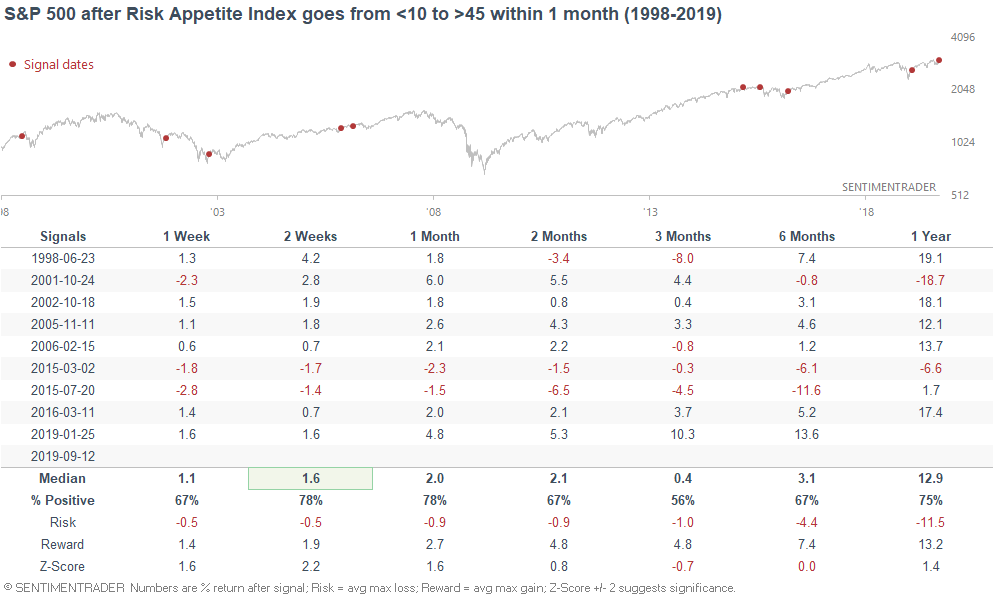
In the past, this often carried over into more gains for the S&P over the next 2-4 weeks.
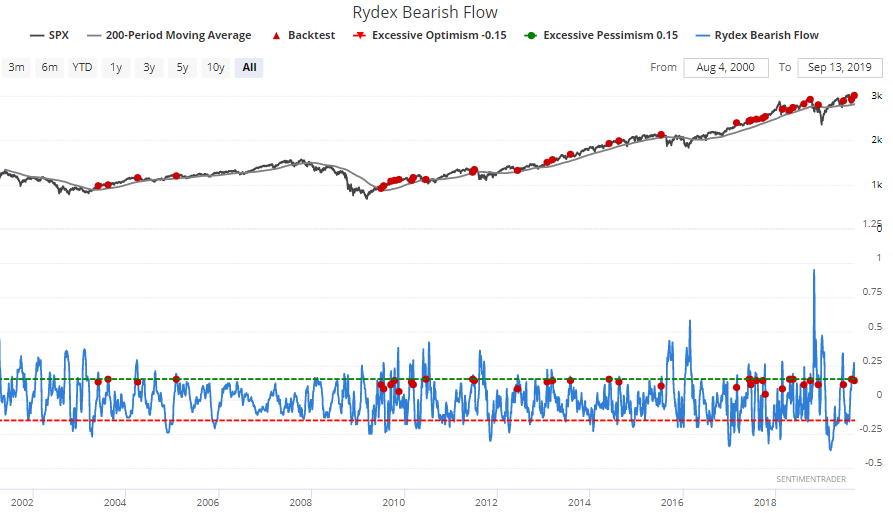
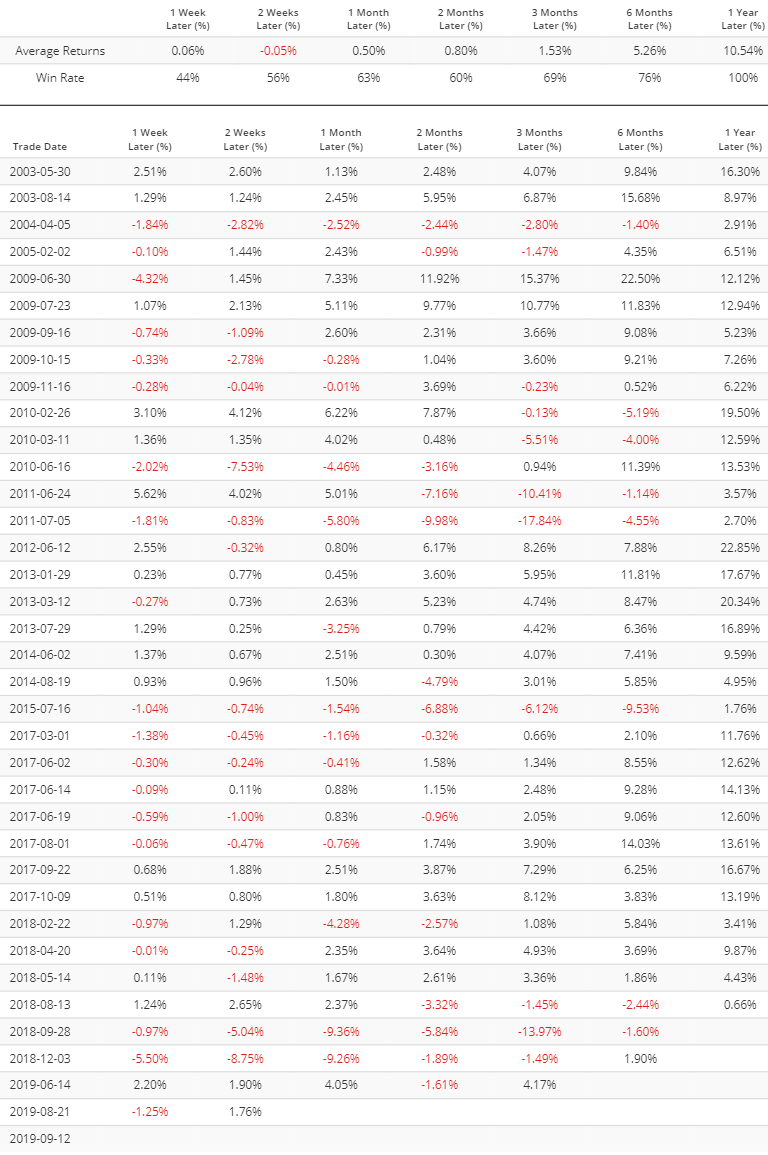
Rydex Bearish Flow
Traders are finally pouring less money into bearish funds, causing Rydex Bearish Flow to fall below 0.15. When this happened while the S&P was above its 200 day moving average, the S&P would sometimes experience short term losses as a small pullback/correction morphed into a bigger correction, but always went higher 1 year later.
Exposure
As Jason mentioned on Thursday, equity long/short hedge funds have very low exposure to stocks. This is to be expected in an industry where many are obsessed with the "impending recession". Trade war uncertainty doesn't help either.
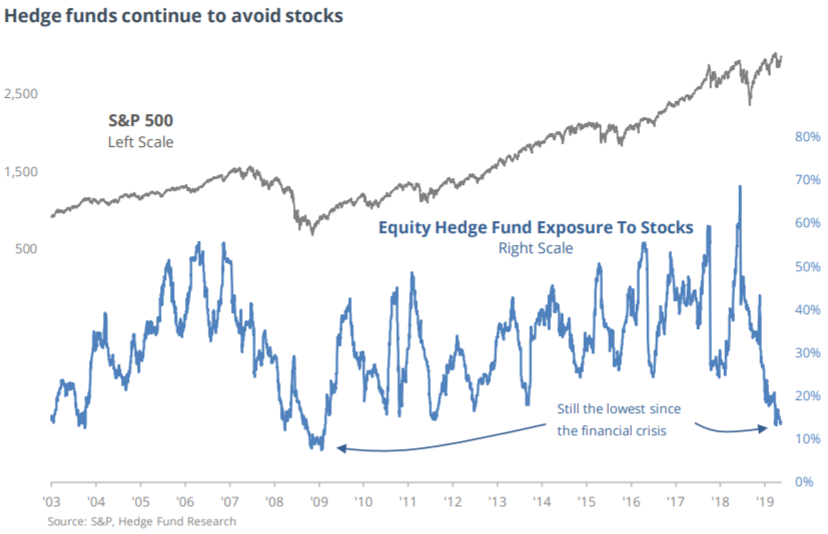
While hedge fund positioning may not be a bullish factor for stocks (saying that today is "just like" 2008/2009 makes no sense given where we are in the economic expansion), this certainly isn't bearish for stocks either. Overall, I would consider this to be a slightly bullish factor.
Technicals (1-2 months)
Price pattern
The Dow has rallied 8 days in a row, to within less -1% of an all-time high. When this happened in the past, the Dow was more bullish than random over the next 1-2 weeks.
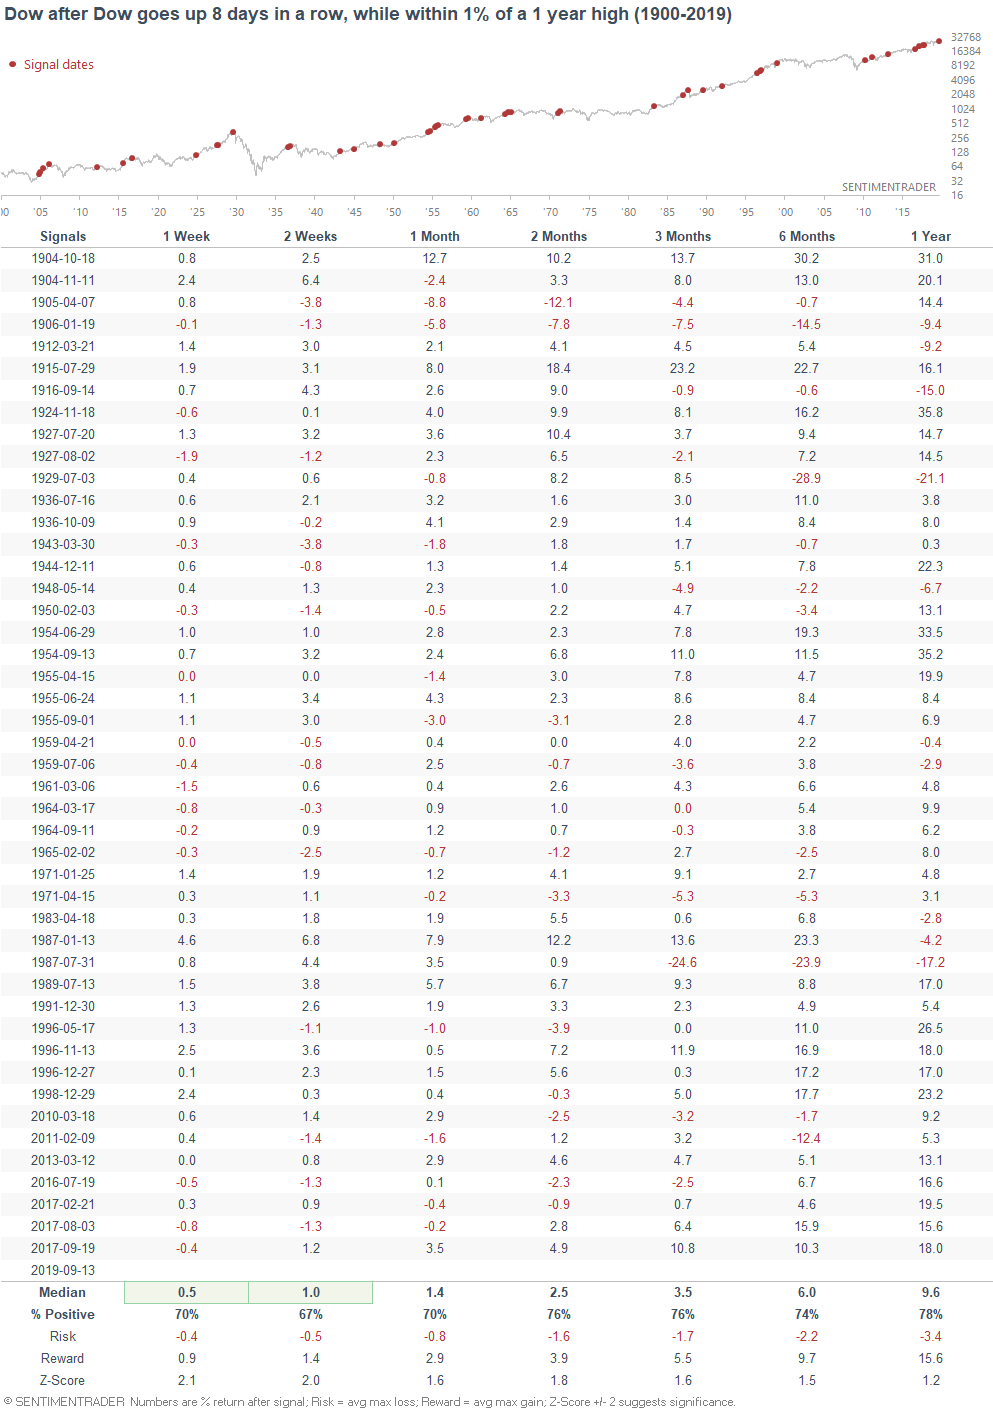
But as Jason has said before, price patterns are less valid nowadays than they were in the past.
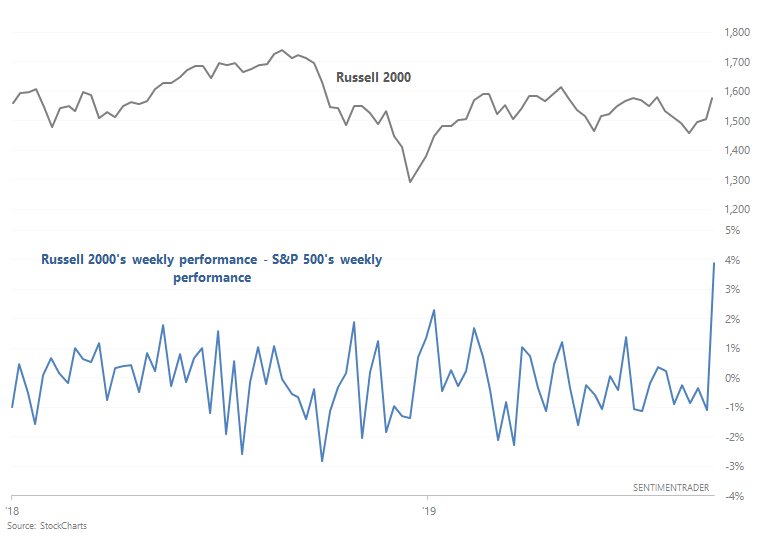
Small caps vs large caps
To show you the problem with price patterns and short term stats (namely their inconsistency), the following stat looks at small caps vs. large caps. Small caps have finally outperformed the S&P significantly this week (after a long streak of underperformance), with the Russell 2000 rallying 3.8% more than the S&P 500.
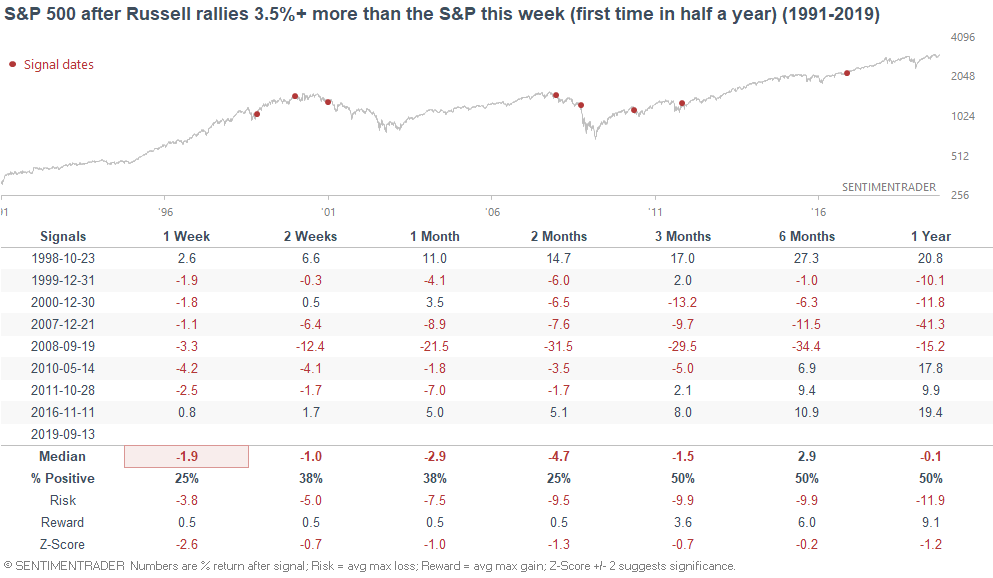
As you can see, the stock market's short term performance is more bearish than random.
There is no clear edge right now for stocks in the short term.
To recap
- Long term risk:reward doesn’t favor bulls. Valuations are high, but valuations can remain high for years.
- Fundamentals (6-12 months): still bullish because there is no significant U.S. macro deterioration, but this could change IF macro data deteriorates significantly over the next few months
- Technicals (3-6 months): mostly bullish
- Technicals (1-2 months): no clear edge in either direction.
*Economic Data charts (from "Fundamentals")
Housing Starts:
Building Permits:
New Home Sales:
ISM Manufacturing PMI:
10 year - 3 month yield curve:
Initial Claims:
Continued Claims:
Heavy Truck Sales:
Chicago Fed National Financial Conditions Credit Subindex:
Popular valuation indicator Shiller P/E:
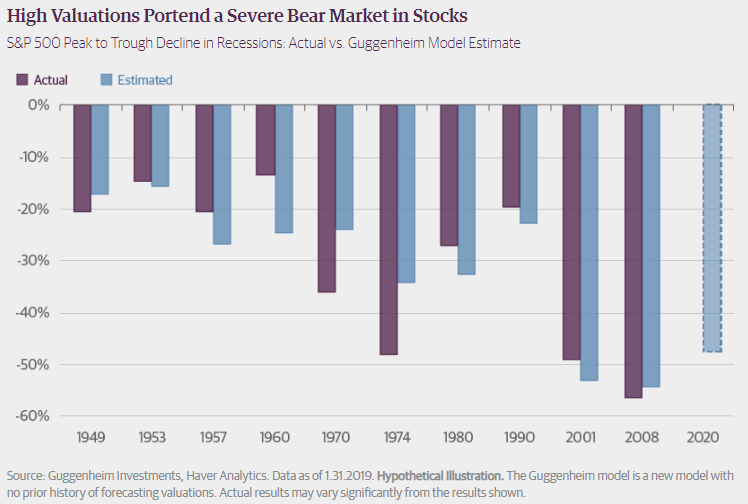
Here's an interesting chart from Guggenheim which demonstrates the relationship between the size of a recession-driven bear market and the stock market's valuations before the bear market: