
Market overview: facts over opinion
There are so many things to think and "worry" about right now. Trade war, earnings slowdown, macro weakness, recession fears, yield curve..... The list is endless. So let's step back and focus on what we know (data) instead of opinions (trying to predict the future).
- Long term risk:reward doesn’t favor bulls. Valuations are high, but valuations can remain high for years.
- Fundamentals (6-12 months): still bullish because there is no significant U.S. macro deterioration
- Technicals (3-6 months): mostly bullish
- Technicals (1-2 months): no clear edge in either direction. If I had to guess, I think there’s a 60% chance that the S&P makes new lows. Not decisive.
Fundamentals (6-12 months)
The economy and the stock market move in the same direction in the long term. Hence, leading economic indicators are also long term leading indicators for the stock market.
- Leading economic indicators sometimes deteriorate significantly BEFORE a bear market begins, e.g. 2006-2007.
- Leading economic indicators sometimes deteriorate significantly AFTER a bear market begins (e.g. 1969, 1973, 2000).
But for the cases in which leading indicators deteriorated AFTER a bear market began, the bear markets' worst parts (e.g. 2001, 1974) occurred after the leading indicators deteriorated significantly. Let's look at these leading indicators.
Here is our Macro Index, which aggregates 11 leading indicators. Overall, there is no significant U.S. economic deterioration right now. What will happen to macro in the future? I don't know. Instead of predicting the future, macro tells us how to react and trade day-by-day depending on what's happening right now.
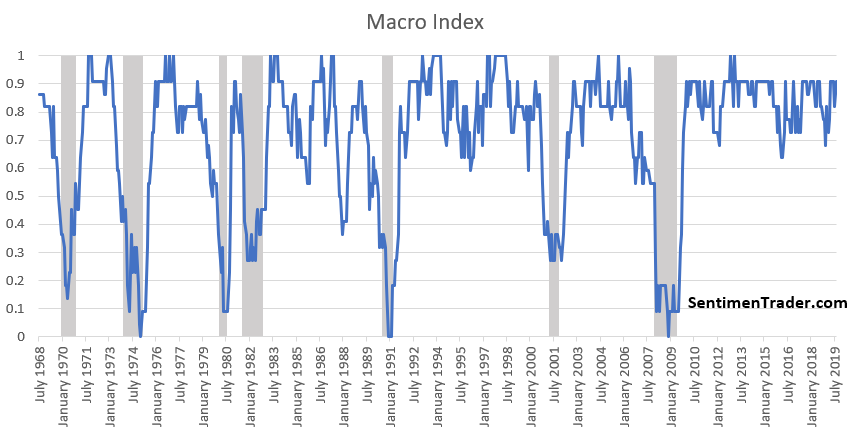
The main weak points in macro revolve around trade, manufacturing, and yield curve. Housing is semi-weak, but there is yet to be significant deterioration.
Trade
Trade-related economic indicators are weak. As I demonstrated on Friday, the Philly Fed's one-month diffusion index has fallen below 60. This suggests that there is some economic weakness in the U.S., particularly in states that have been more adversely impacted by the trade war.
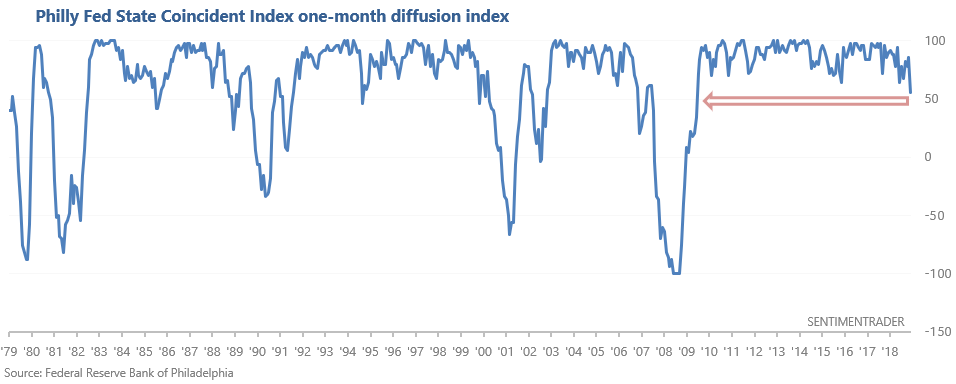
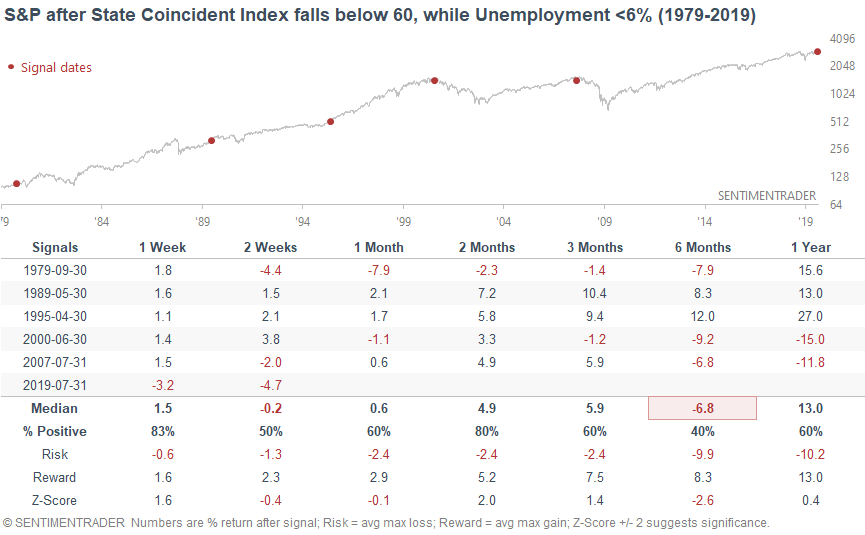
In the past, readings below 60 were not good for stocks. It was far better to buy stocks when the Philly Fed State Coincident Index was above 60.
Manufacturing
Manufacturing-related data remains weak. The Macro Index includes the ISM Manufacturing PMI. It considers ISM readings above 50 to be bullish and readings below 50 to be bearish.
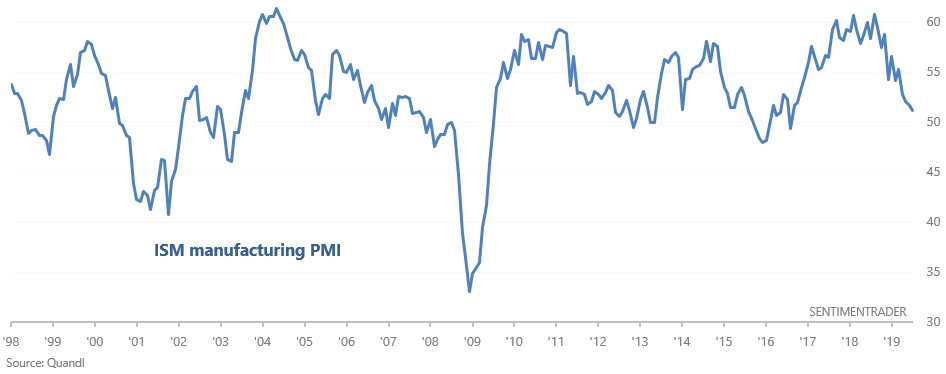
While manufacturing remains a bullish factor for macro right now, it could quickly change into a bearish factor next month if manufacturing continues to deteriorate. Watch this closely.
Yield Curve
The yield curve remains a long term bearish factor for stocks. As we've demonstrated many times here at SentimenTrader, yield curve inversions typically happen near the end of economic expansions and bull markets. But instead of being obsessed with the yield curve, it's important to remember that the yield curve is just one of many macro factors to consider.
Economic sentiment
The University of Michigan publishes a Current Economic Conditions Index that asks consumers how they view current economic conditions in the country. As you can see in the chart below, most economic expansions coincide with a Current Economic Conditions Index that's either flat or trending upwards.
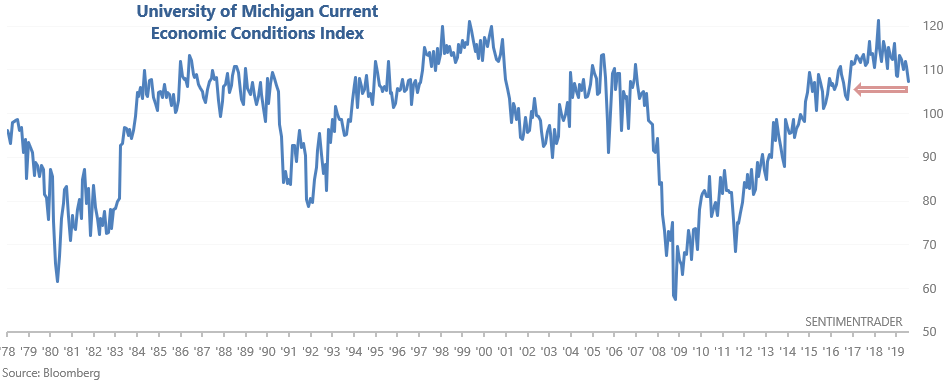
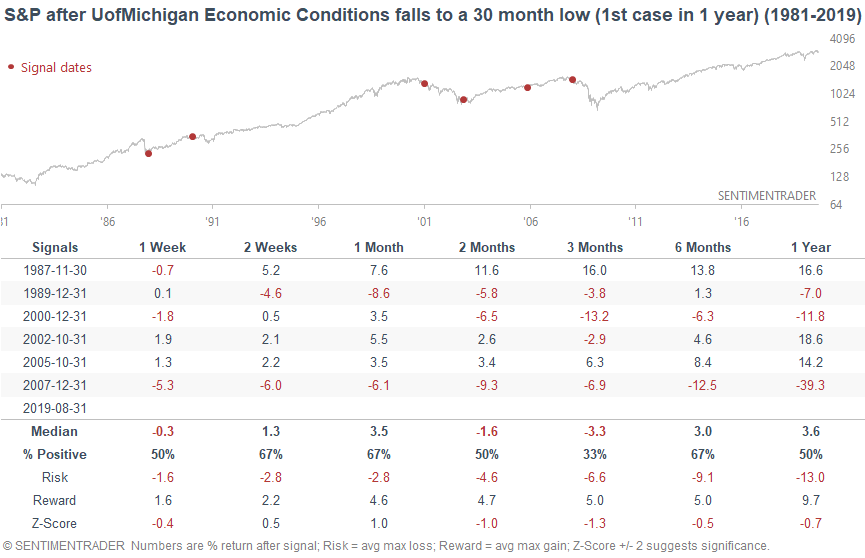
This index has now fallen to the lowest level in more than 30 months. When this happened in the past, there were a few long term warning signs (along with a few false signals).
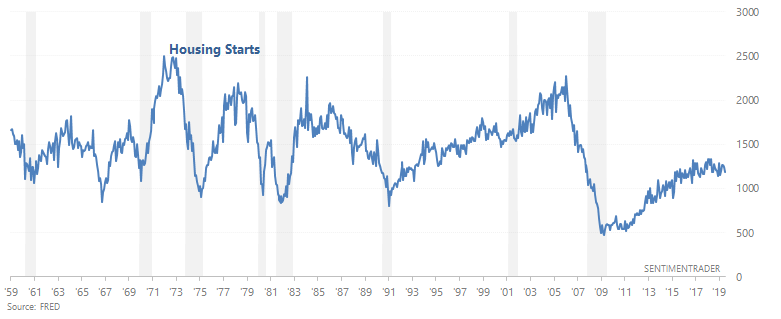
Housing
Housing remains slightly weak, which makes this a slight negative for macro right now.
Here’s Housing Starts, which has been trending sideways/downwards for months. In the past, Housing Starts trended downwards before recessions began.
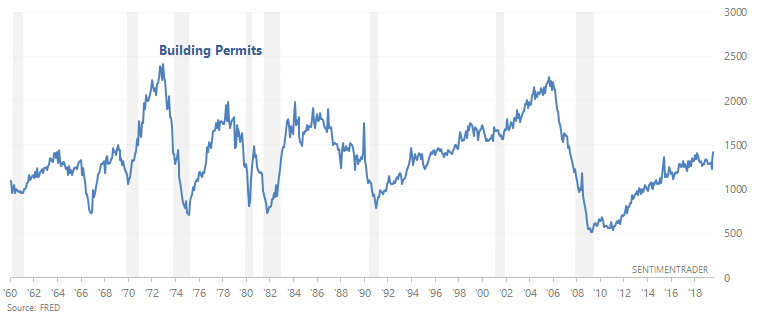
Here’s Building Permits, which has also been trending sideways/downwards for months. In the past, Building Permits trended downwards before recessions began.
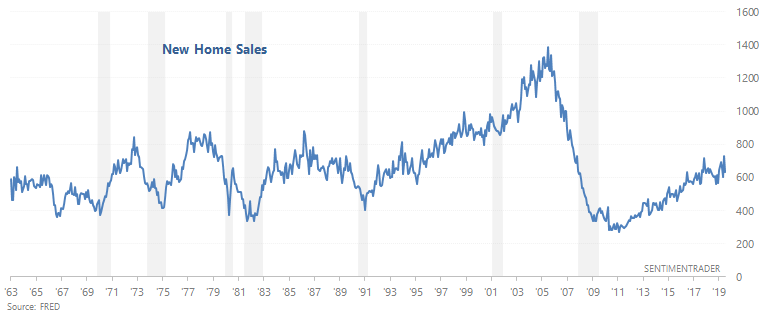
And here’s New Home Sales, which is trending sideways. In the past, New Home Sales trended downwards before recessions began.
Now that we've covered the bad news, here's a quick glance at the good news. Since I don't want this to a long post with too many economic charts, I will just describe the state of these macro indicators.
- The labor market is still a bullish factor for macro. 2 leading labor market indicators - Initial Claims and Continued Claims - continue to trend sideways. In the past, Initial Claims and Continued Claims trended upwards before recessions began.
- Heavy Truck Sales is still a bullish factor for macro because this indicator is still trending upwards. In the past, Heavy Truck Sales trended downwards before recessions began.
- Inflation is still a bullish factor for macro because it is not trending upwards. In the past, inflation trended upwards before recessions began.
- The Chicago Fed Financial Conditions Credit Subindex is still a bullish factor for macro because it is not trending upwards. In the past, this leading indicator trended upwards before recessions began.
And lastly, the Conference Board Leading Economic Index continues to make new highs.
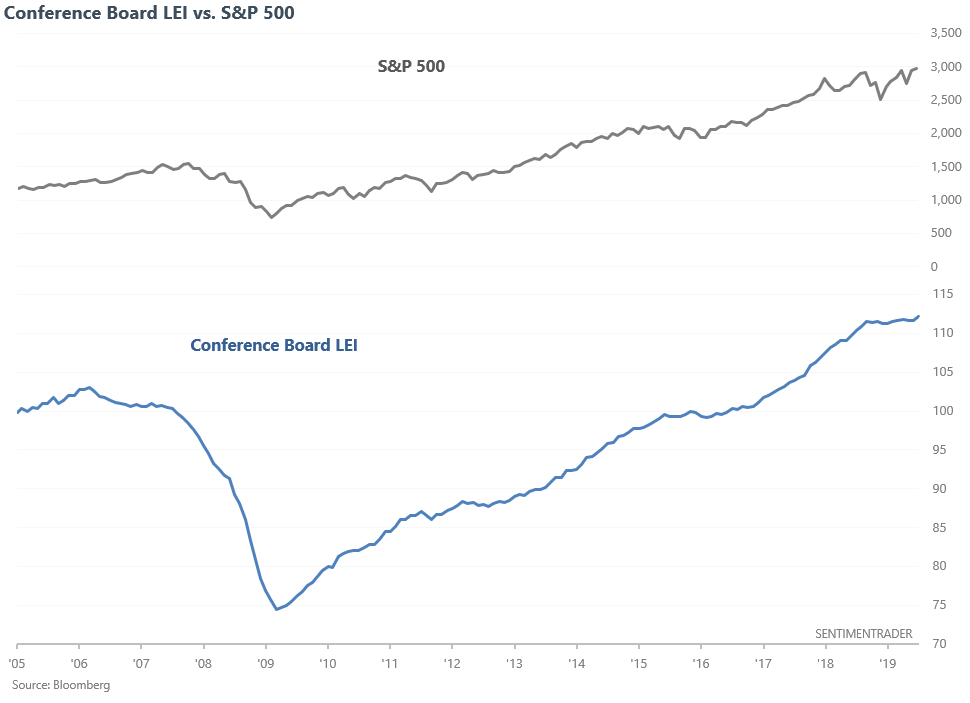
This is bullish for stocks because in the past, it was far better to buy stocks when the LEI's 6 month average is going up (i.e. right now) than when the 6 month average is going down.
Now that we've looked at macro, let's look at the stock market's outlook over the next 6-12 months from a technical perspective. This technical outlook remains within the context of a bullish macro environment. If macro deteriorates significantly over the next few months, then technical factors that were once "bullish for stocks 6-12 months later" will no longer be bullish. Fundamentals can completely swamp technicals during a recession (e.g. 2008).
Technicals (3-6 months)
The stock market is usually hard to predict on a 1-2 month forward basis, unless there is an extreme. There are a few extremes right now, but these are not decisive. So let’s focus on a 3-6 month forward basis.
Patterns
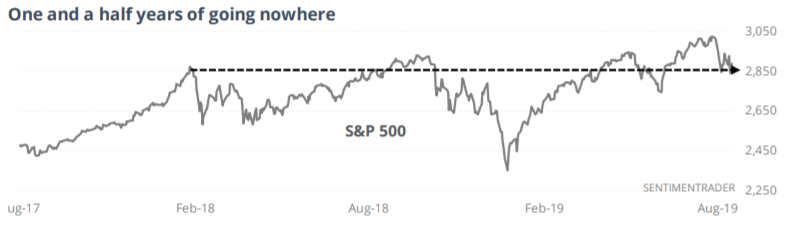
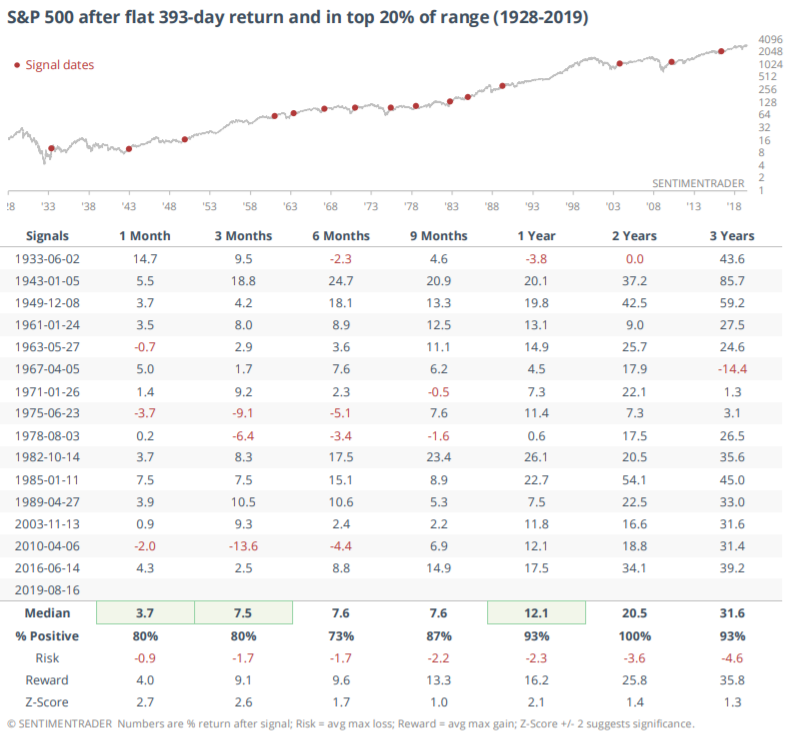
The S&P has gone nowhere over the past 18 months. As a result, many traders are wondering if this is a topping pattern because the stock market's tops tend to be relatively flat (e.g. 2000) or roll over (e.g. 2007). But as Jason demonstrated on Monday, "flat tops" that last this long usually aren't flat tops. They're mostly consolidations that led to breakouts on the upside.
Sentiment
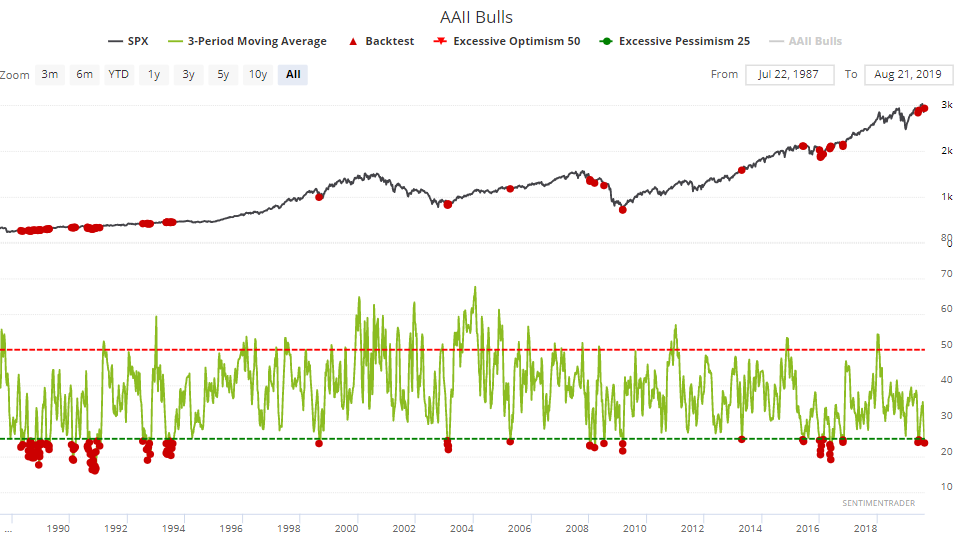
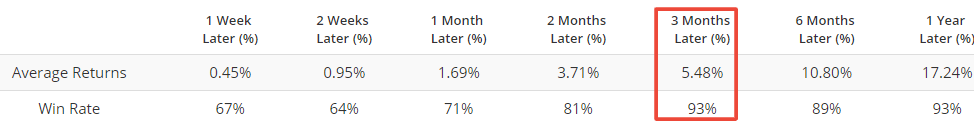
As Jason pointed out on Friday, AAII Bulls' 3 week average has dropped to an exceptionally low level. Readings below 25 are quite bullish for stocks over the next 3 months.
Safe Haven
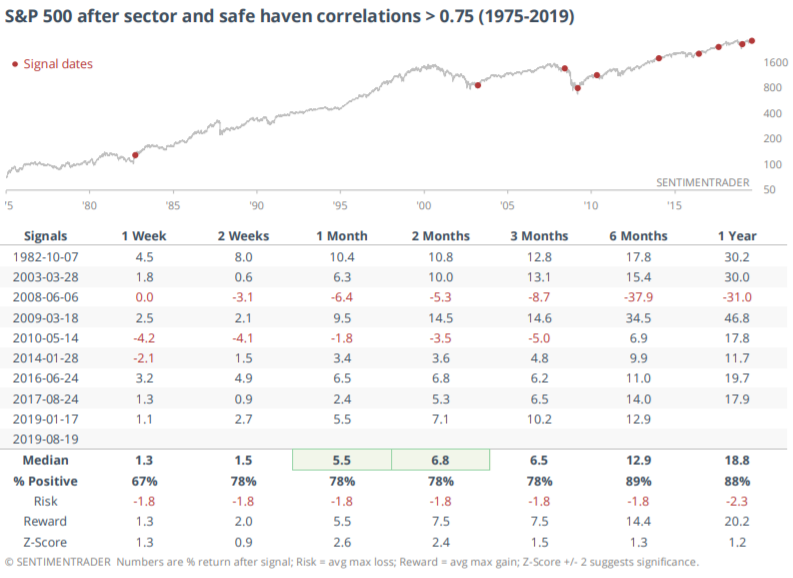
As Jason pointed out on Tuesday, the stock market's sectors and safe haven assets have been strongly correlated recently. This typically happens during times of market anxiety (e.g. in a crisis or recession), when investors and traders are all reacting to the same events.
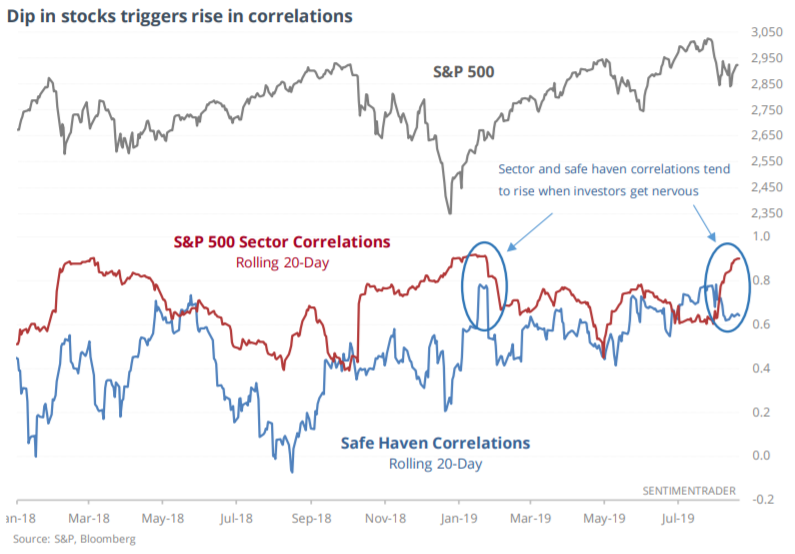
But true to contrarian form, spikes in cross-asset correlations are typically bullish for stocks on a multi-month time frame.
Breadth
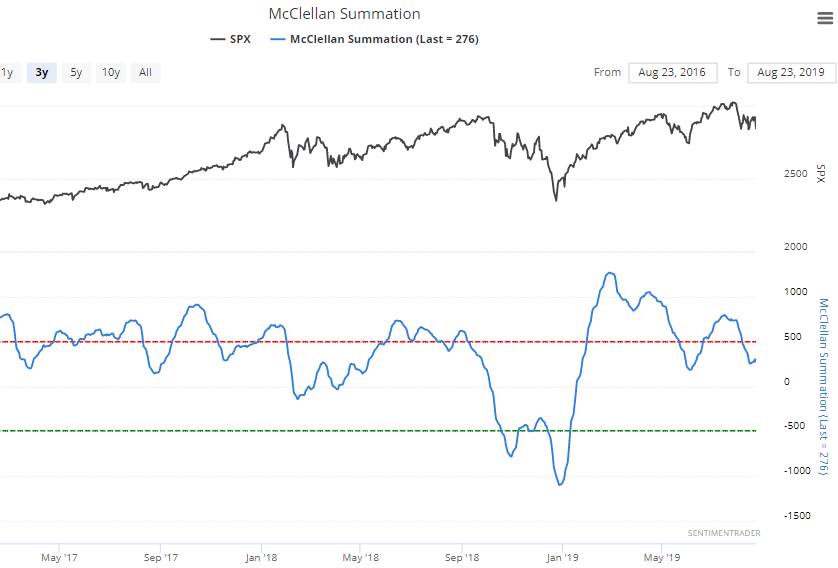
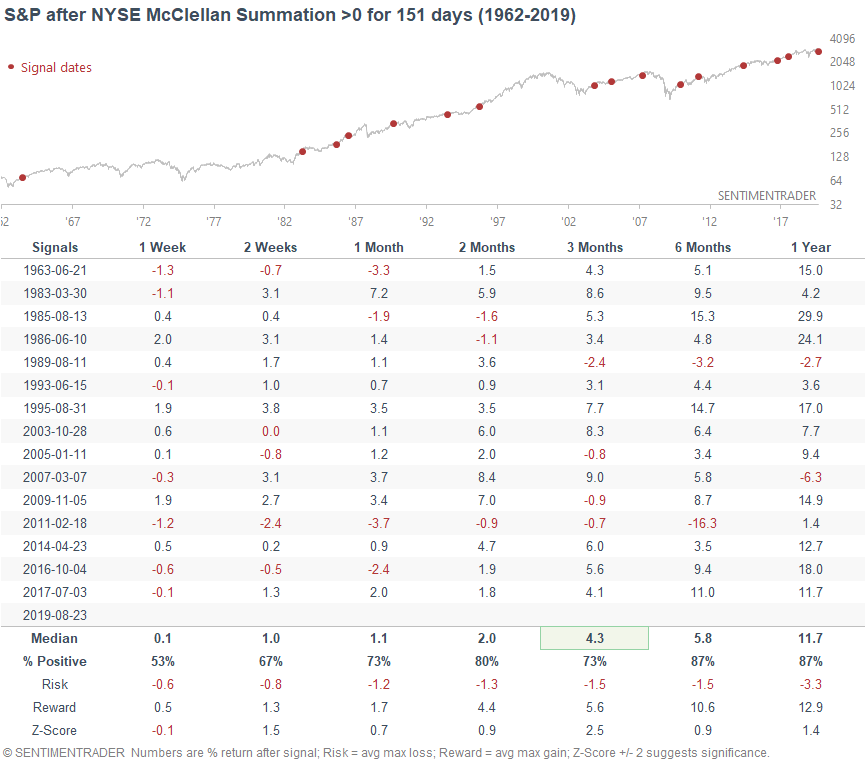
The NYSE McClellan Summation Index is a long term look at the momentum of the stock market's breadth. When it is above zero, momentum is positive. This indicator has been above zero for 151 consecutive days, which is a long streak. In the past, such long streaks were mostly positive for stocks over the next 2+ months.
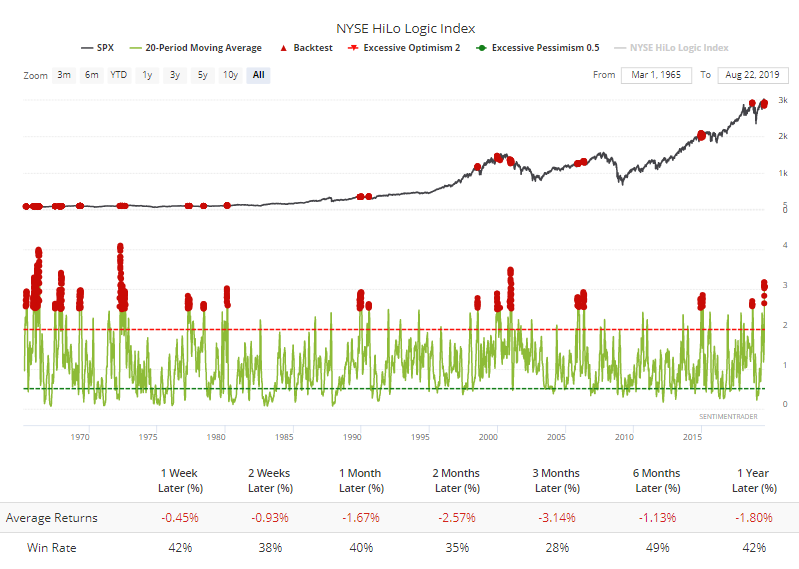
However, one of the few long term bearish factors from a technical perspective also comes from breadth. As Jason said "the NYSE is showing more than 100 securities that have hit a 52-week high, and also more than 100 hitting a 52-week low. So the HiLo Logic Index is soaring again, meaning that we're in the midst of a very split market. This was not good for stocks in the past"
Volatility
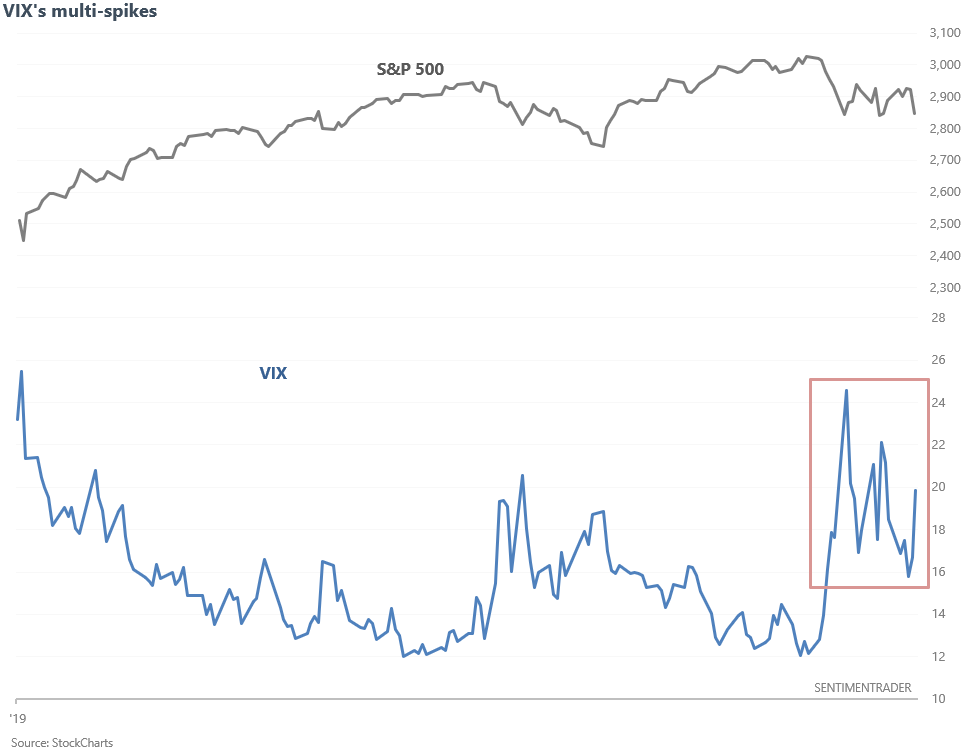
The stock market seems to panic once every few days. 6 of the past 20 days (4 weeks) have seen daily VIX spikes > 10%.
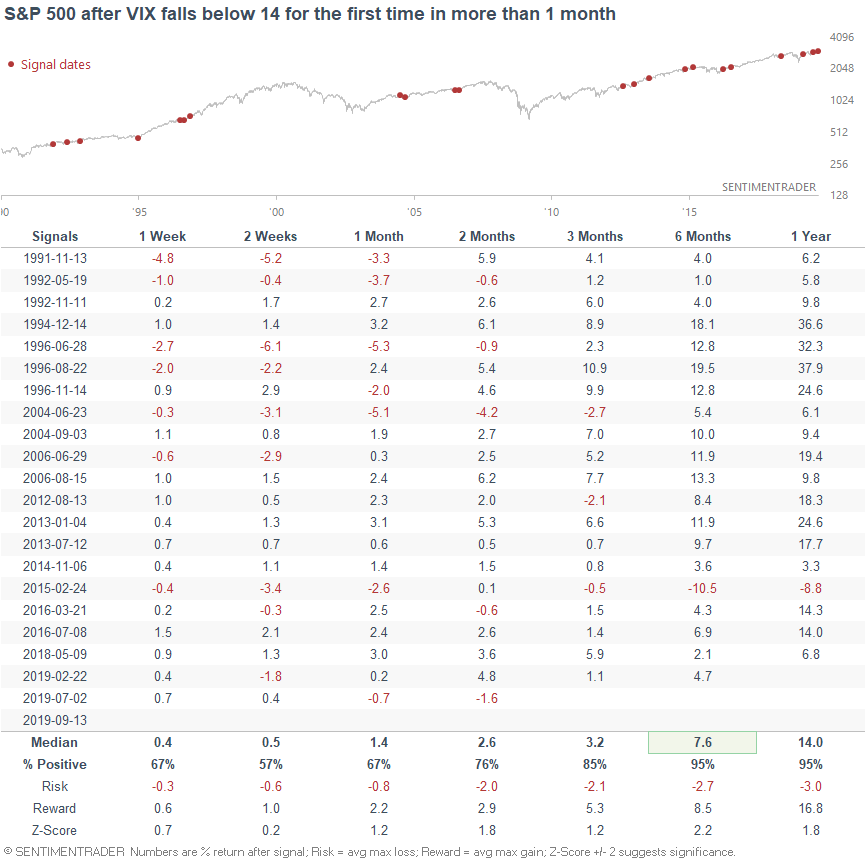
When this happened in the past, the S&P usually did well over the next 3 months. The one big exception was October 2008, which occurred during the middle of a mega-crash.
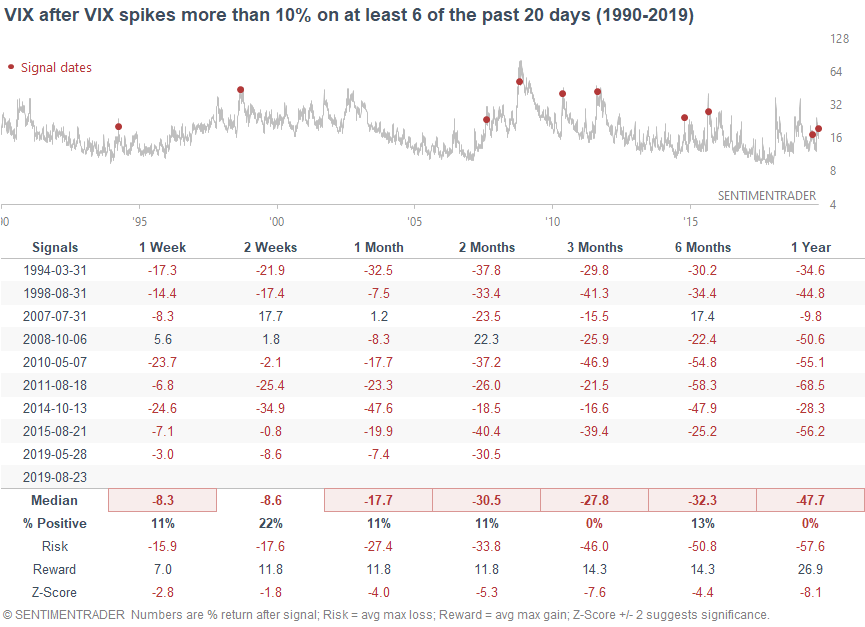
And as you would expect, this wasn't good for VIX itself in the past.
Sectors
Defensive sectors continue to outperform amidst the recent market turmoil. XLU (utilities ETF) has surged more than 20% in the past 8 months. Some market watchers may find this concerning, because it's often assumed that defensive sectors outperform at the end of a bull market or start of a bear market.
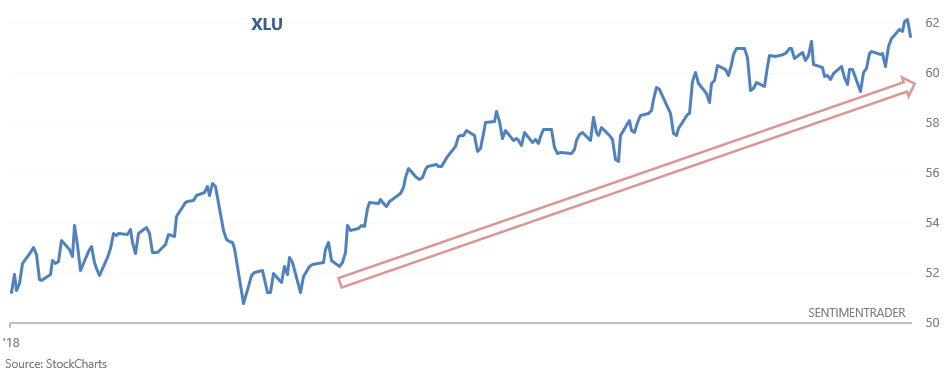
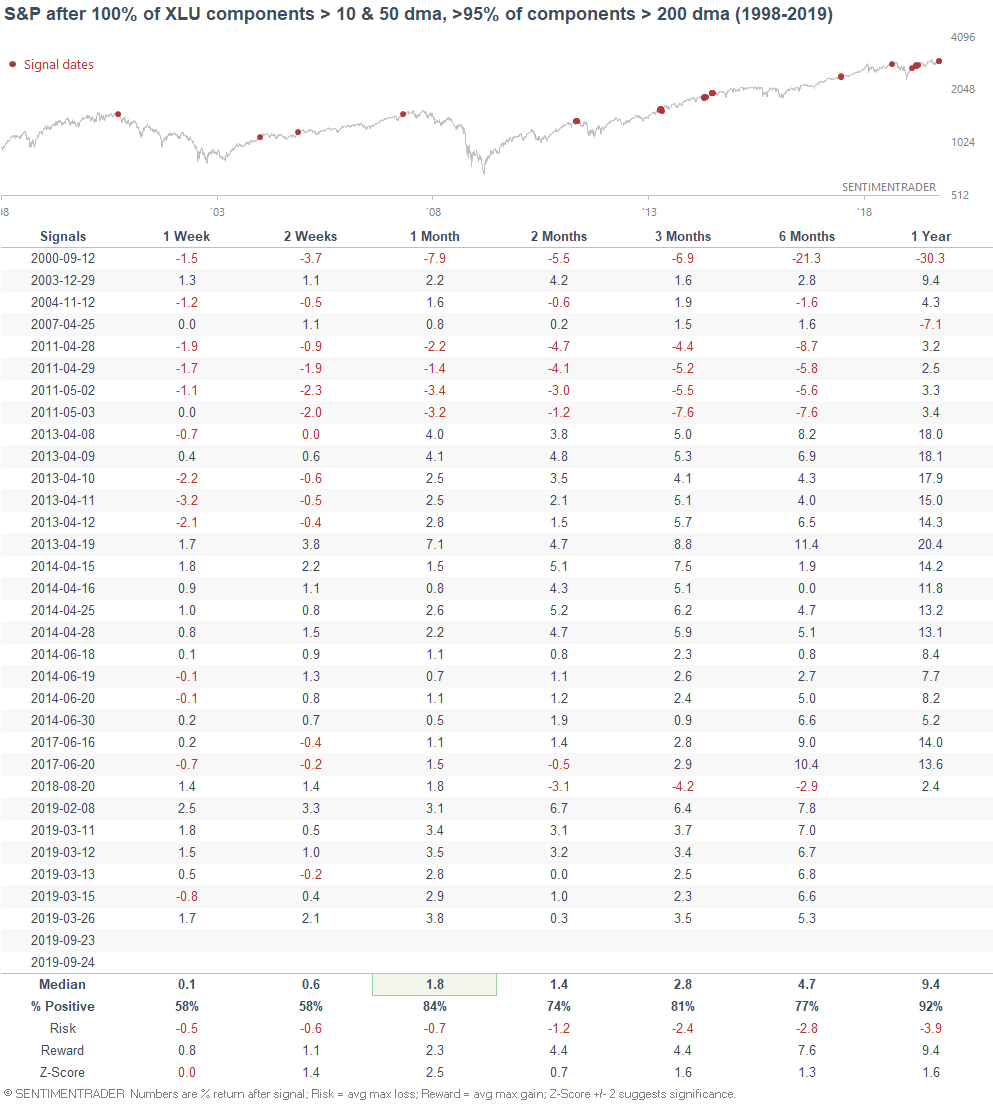
Defensive sectors did indeed outperform during the start of the 2000-2002 bear market. But aside from that, this theory didn't always play out. Here's what happened next to the S&P when XLU rallied more than 20% in the past 8 months.
Technicals (1-2 months)
I don't see a clear edge in either direction. It's usually pretty hard to predict the market a few weeks into the future, unless there is an extreme. There are a few extremes at the moment, but these are not conclusive. It's still relatively easy to find evidence for why stocks should fall a little more in the short term.
Volume
In another sign of nondiscriminatory selling, 3 of the past 15 days have seen NYSE Down/Up Volume ratios that exceeded 10 (i.e. 10x more volume flowing into declining issues than volume flowing into rising issues).
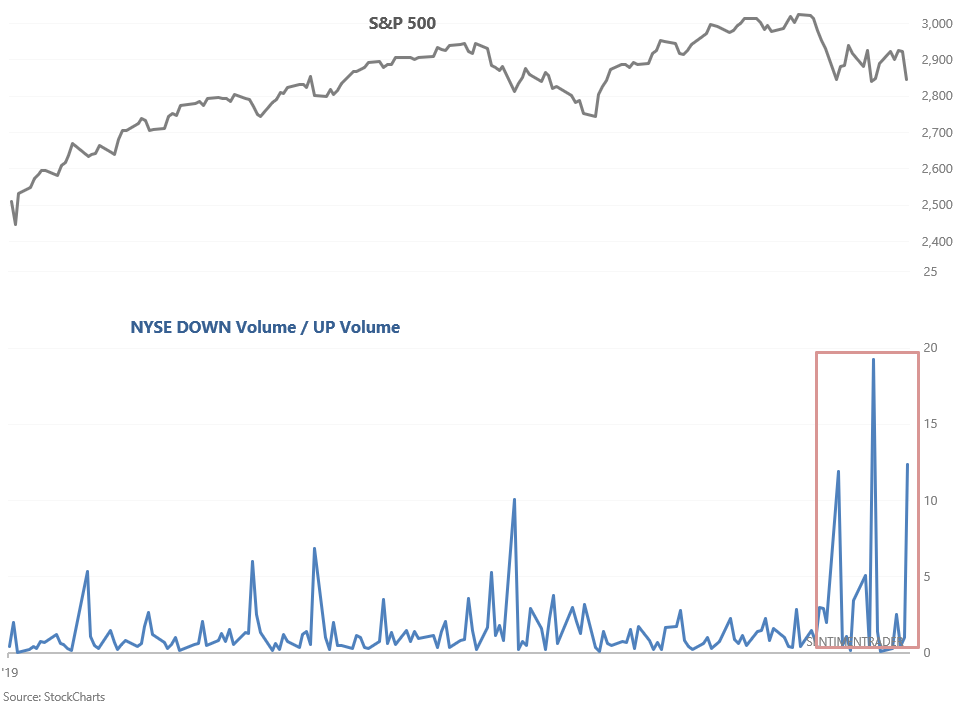
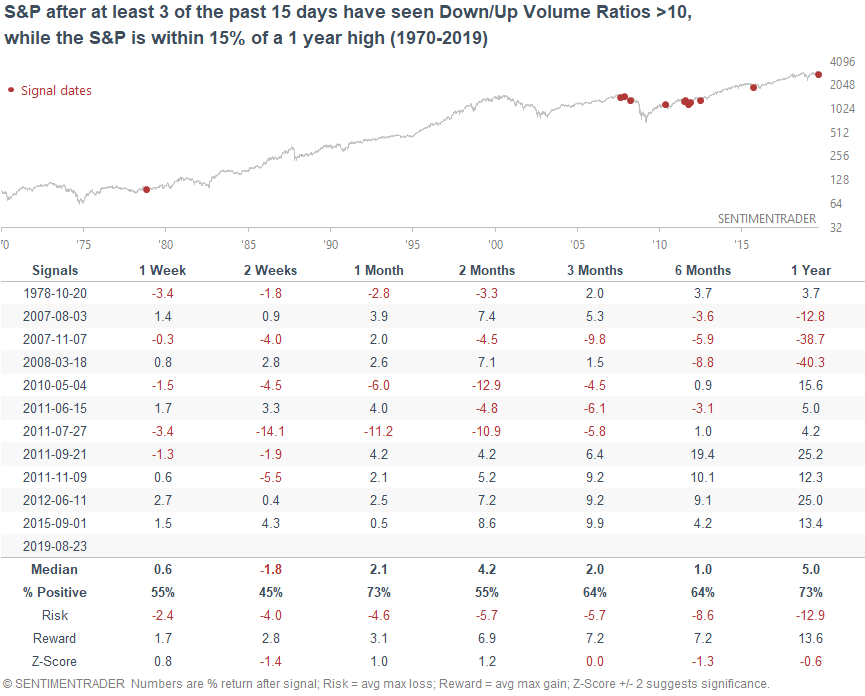
It's easy to assume that this is bullish for stocks when the S&P is close to an all-time high. However, that hasn't always been the case. This is sometimes how big -15% or -20% corrections began (e.g. 2010, 2011, 2015).
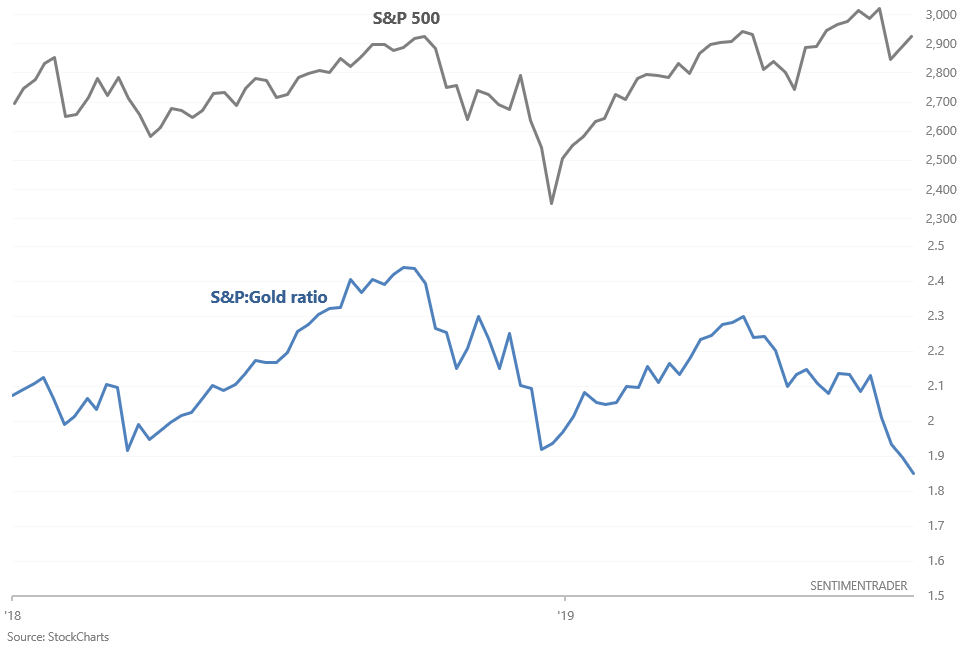
Stocks and gold
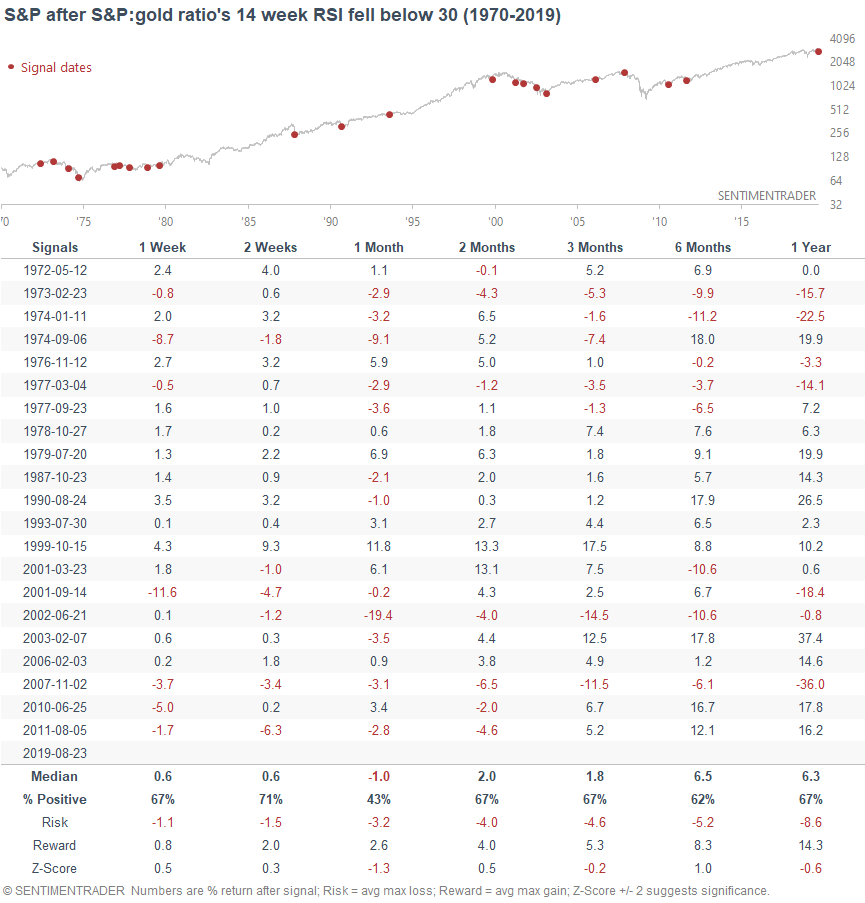
With stocks falling on trade war news again, gold continues to rally. The S&P:gold ratio, which usually moves inline with the S&P, continues to fall. Its weekly RSI (momentum) has now fallen below 30.
When this happened in the past, the S&P often rallied over the next 1-2 weeks and then went lower.
Recap
- Long term risk:reward doesn’t favor bulls. Valuations are high, but valuations can remain high for years.
- Fundamentals (6-12 months): still bullish because there is no significant U.S. macro deterioration
- Technicals (3-6 months): mostly bullish
- Technicals (1-2 months): no clear edge in either direction. If I had to guess, I think there’s a 60% chance that the S&P makes new lows. Not decisive.