Market overview: looking at the stock market from multiple angles
The stock market has been stuck in a range since August. Here's my market outlook:
- Long term risk:reward doesn’t favor bulls. Valuations are high, but valuations can remain high for years.
- Fundamentals (6-12 months): still bullish because there is no significant U.S. macro deterioration, but this could change IF macro data deteriorates over the next few months
- Technicals (3-6 months): mostly bullish
- Technicals (1-2 months): no clear edge in either direction.
Fundamentals (6-12 months)
The economy and the stock market move in the same direction in the long term. Hence, leading economic indicators are also long term leading indicators for the stock market.
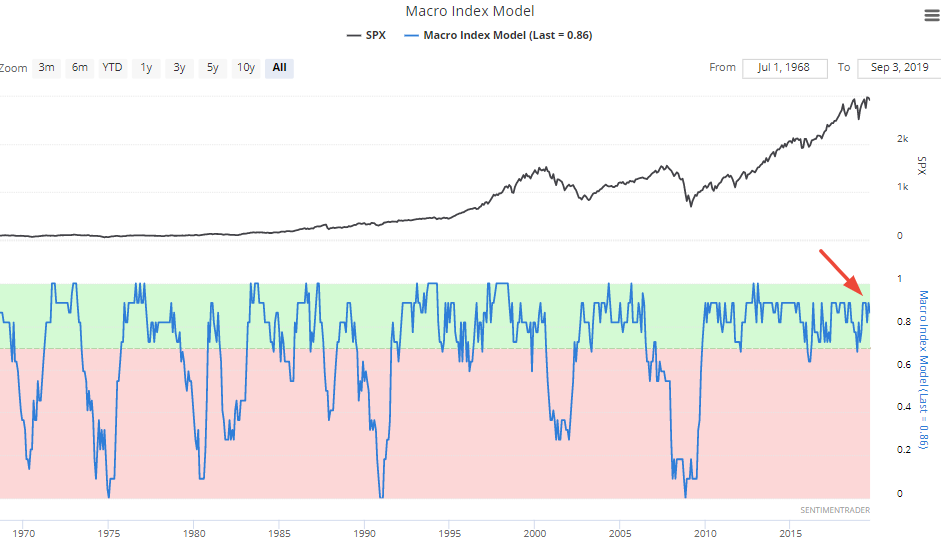
Here is our Macro Index, which aggregates 11 leading indicators. Overall, there is no significant U.S. economic deterioration right now. What will happen to macro in the future? I don't know. Instead of predicting the future, macro tells us how to react and trade day-by-day depending on what's happening right now.
The main weak points in U.S. macro revolve around trade, manufacturing, and the yield curve. Housing is semi-weak, but there is yet to be significant deterioration. Let's take a look at the data. (Please see the specified economic-data charts at the bottom of this post.)
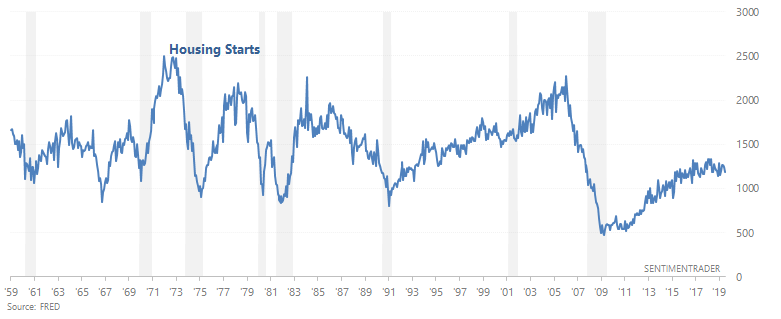
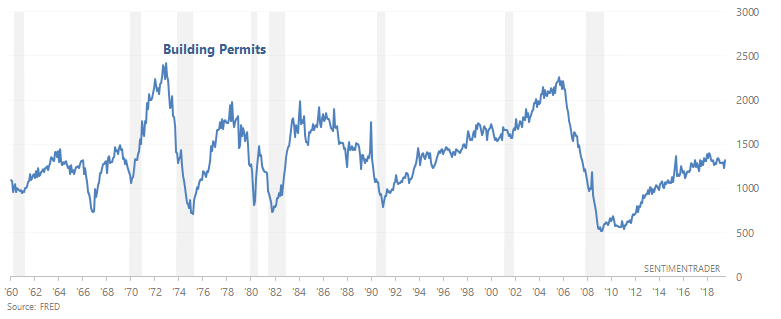
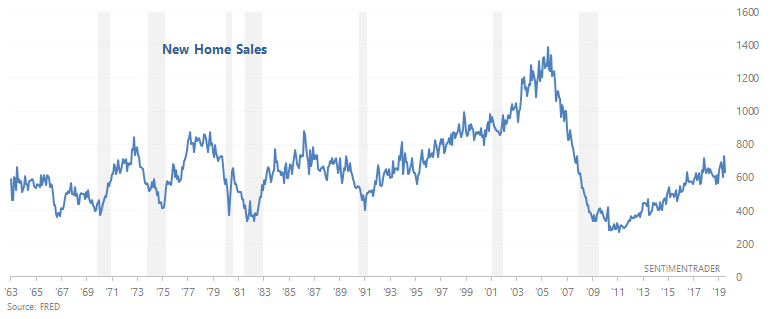
- Housing remains slightly weak, which makes this a slight negative for macro right now. In the past, Housing Starts, Building Permits, and New Home Sales trended downwards before recessions began. Housing Starts and Building Permits are trending sideways/downwards right now, while New Home Sales is trending sideways.
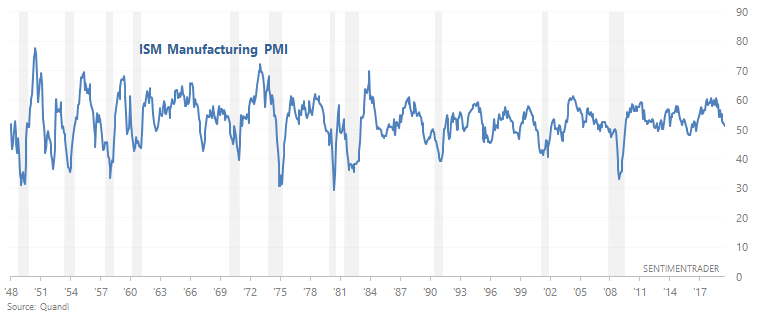
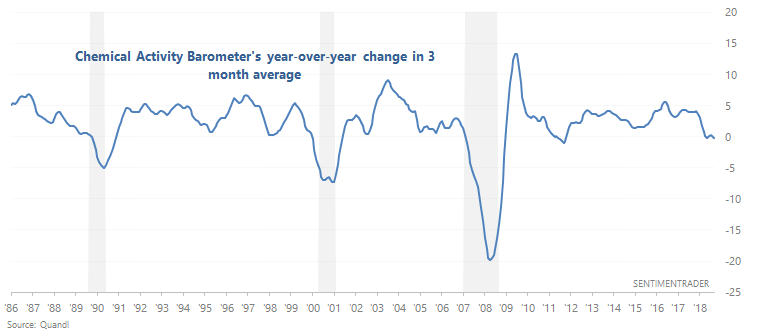
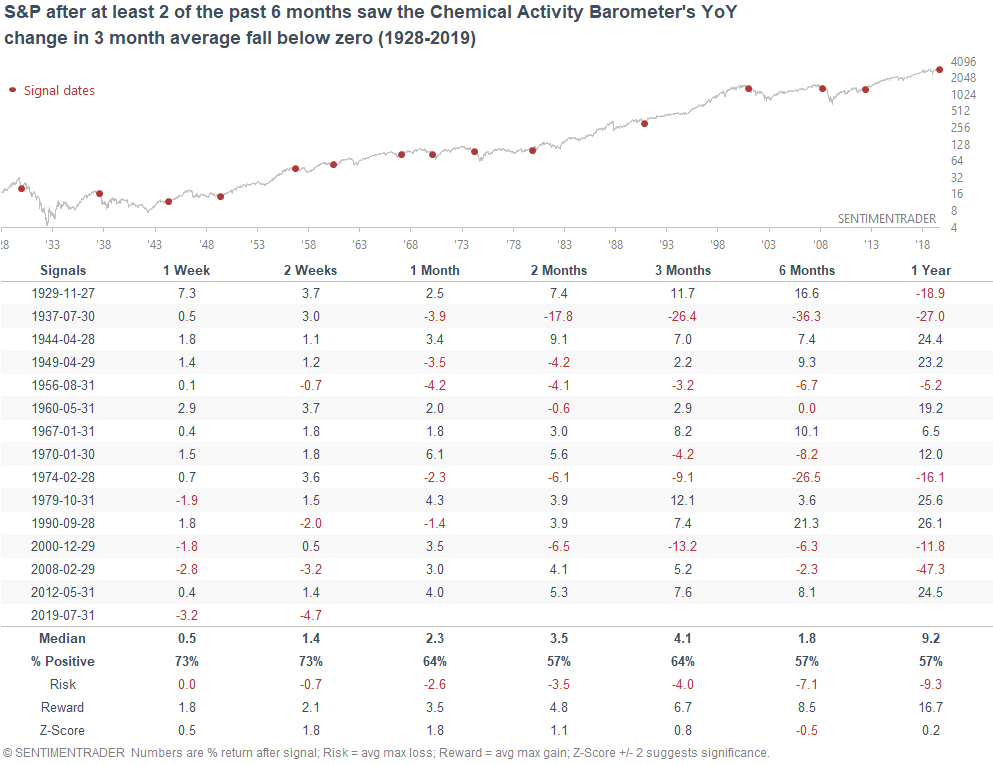
- Manufacturing-related data remains weak. The ISM manufacturing PMI is trending downwards, and if it falls below 50, will signal contraction.The Chemical Activity Barometer's year-over-year change in 3 month average has been below 0% for 2 of the past 6 months. This has sometimes led to recessions in the past.
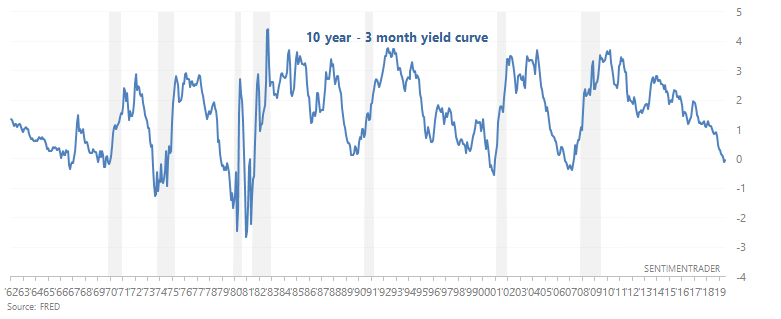
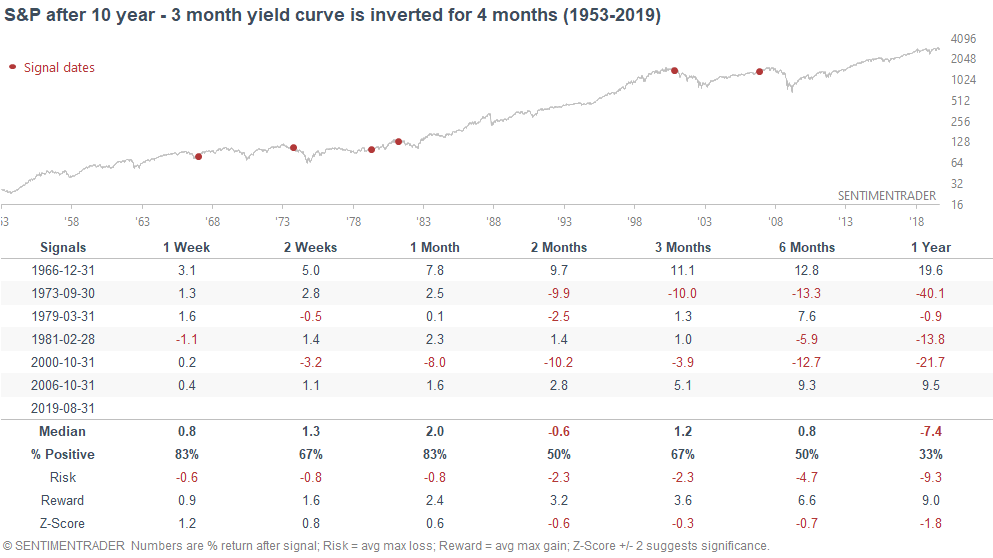
- The yield curve remains a long term bearish factor for stocks. As we've demonstrated many times here at SentimenTrader, yield curve inversions typically happen near the end of economic expansions and bull markets.
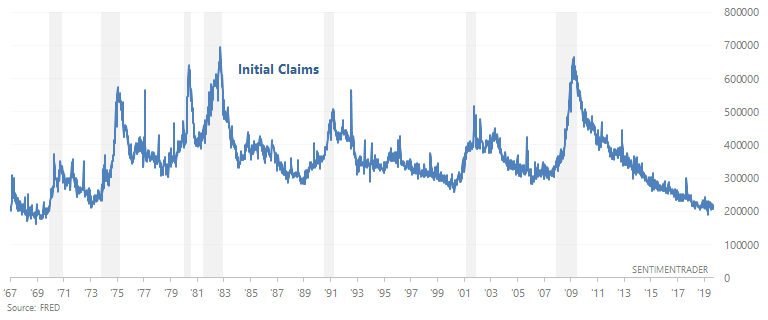
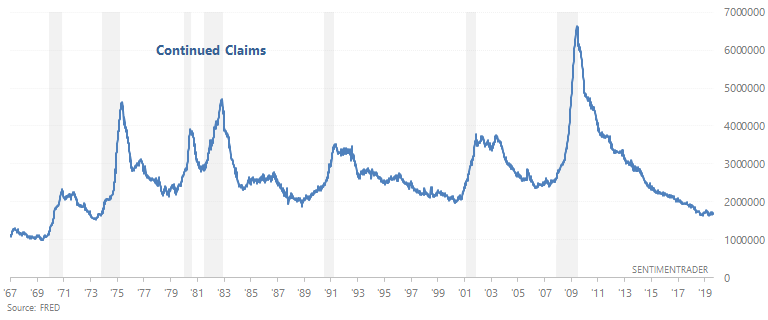
- The labor market is still a bullish factor for macro. 2 leading labor market indicators - Initial Claims and Continued Claims - continue to trend sideways. In the past, Initial Claims and Continued Claims trended upwards before recessions began.
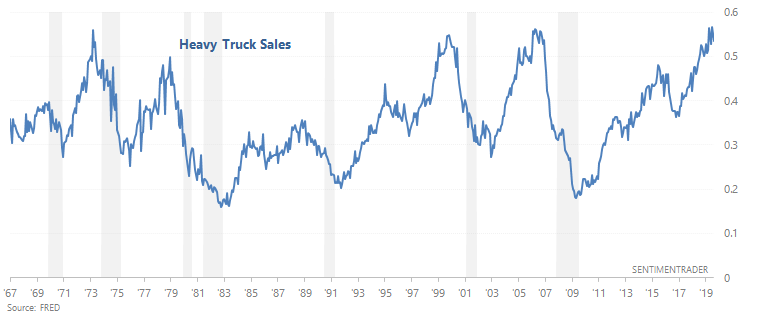
- Heavy Truck Sales is still a bullish factor for macro because this indicator is still trending upwards. In the past, Heavy Truck Sales trended downwards before recessions began.
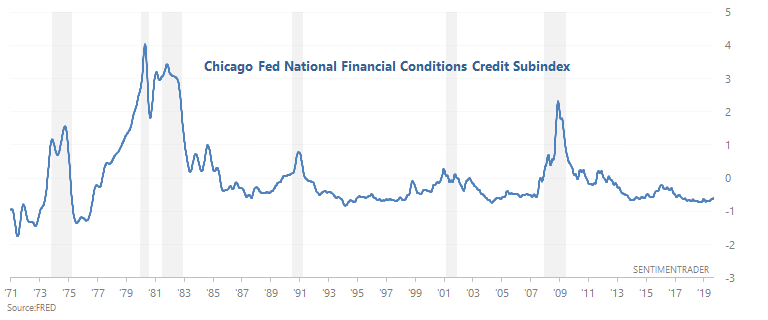
- The Chicago Fed Financial Conditions Credit Subindex is still a bullish factor for macro because it is not trending upwards. In the past, this leading indicator trended upwards before recessions began.
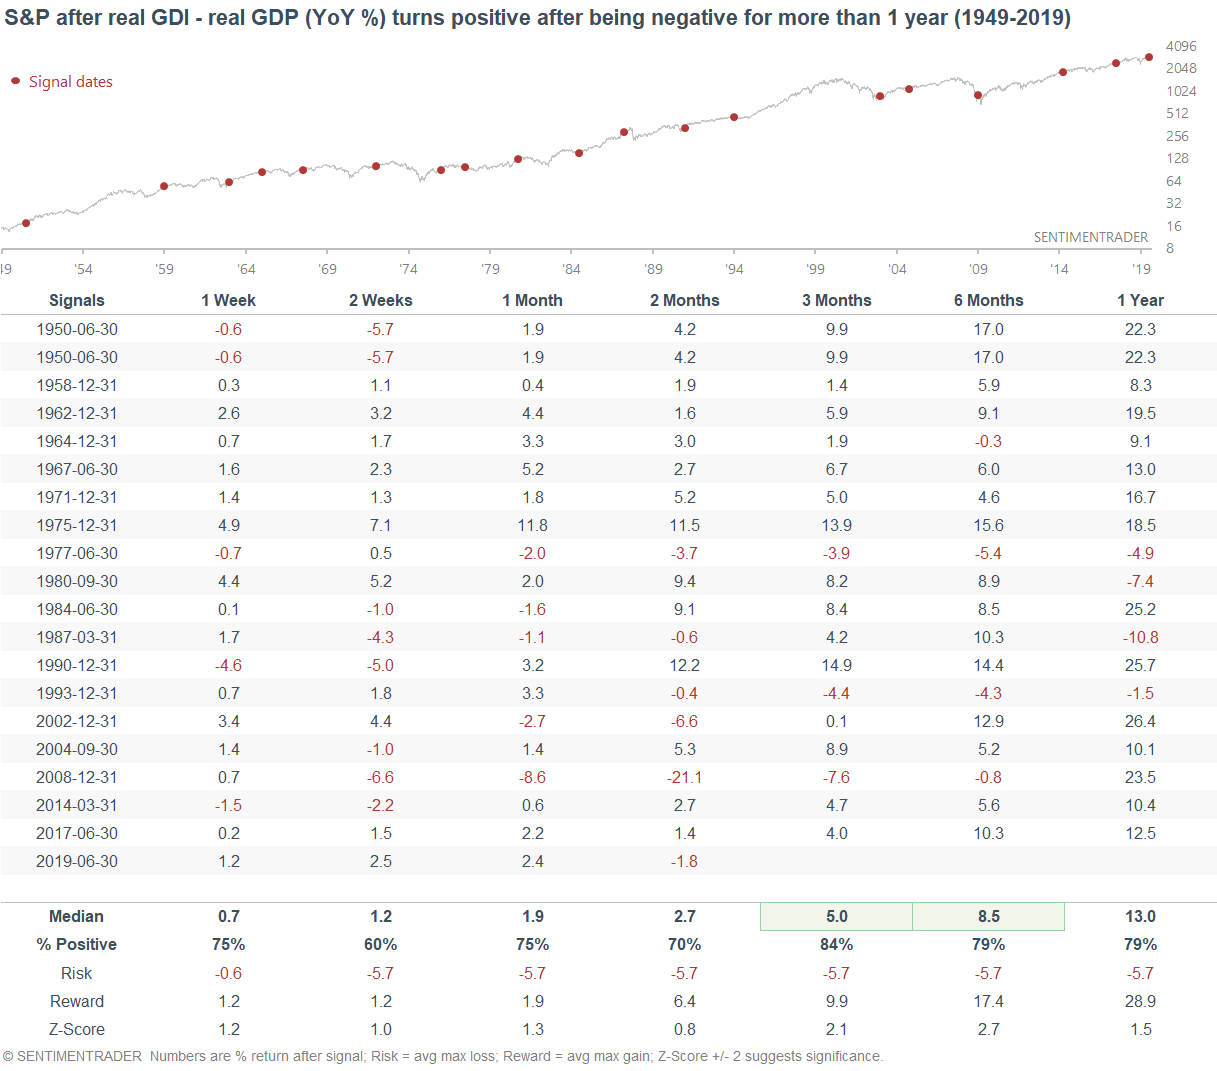
And as WSJ noted on Friday, the gap between real Gross Domestic Income and real Gross Domestic Product has closed.
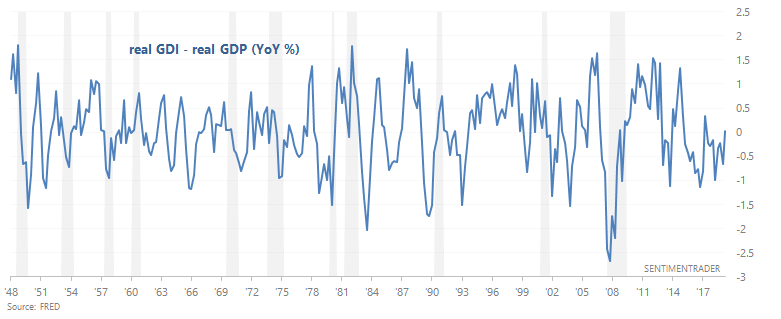
This is important because in the past, GDI tended to better capture economic weakness than GDP, so GDI-GDP would often turn negative before a recession began. Now that this gap has turned positive, it is no longer a concern.
Technicals (3-6 months)
The stock market is usually hard to predict on a 1-2 month forward basis, unless there is an extreme. There are a few extremes right now, but these are not decisive. So let’s focus on a 3-6 month forward basis.
Price Patterns
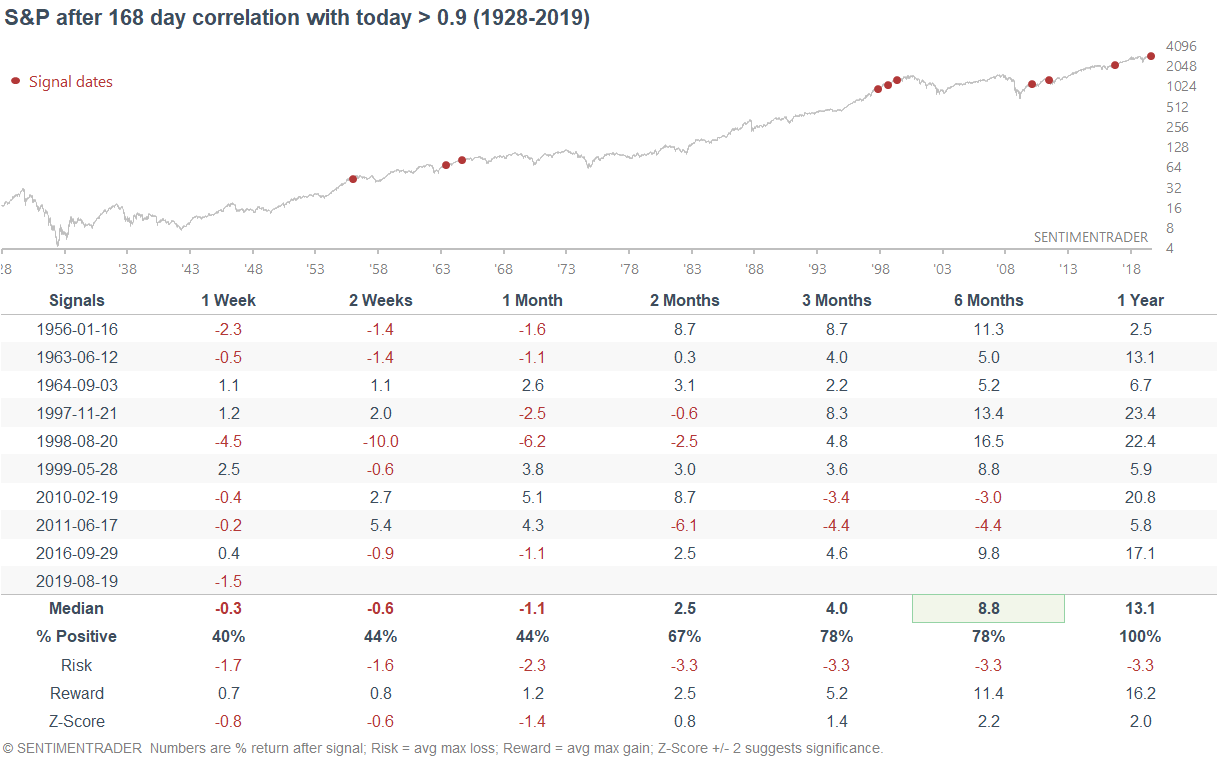
Many market watchers have been comparing the S&P's past 8 months to historical 8 month periods, and trying to find fractals. From a quantitative perspective, the S&P over the past 8 months has been quite similar to 9 other historical periods. All of these saw more gains for the S&P over the next 12 months.
Sentiment
Just looking at absolute levels, sentiment is low but not extreme. But given where stocks are (near an all-time high), sentiment has fallen quite rapidly despite a relatively small stock market decline. Our proxy for the popular CNN Fear & Greed Index's 20 day average fell below 30 on Tuesday.
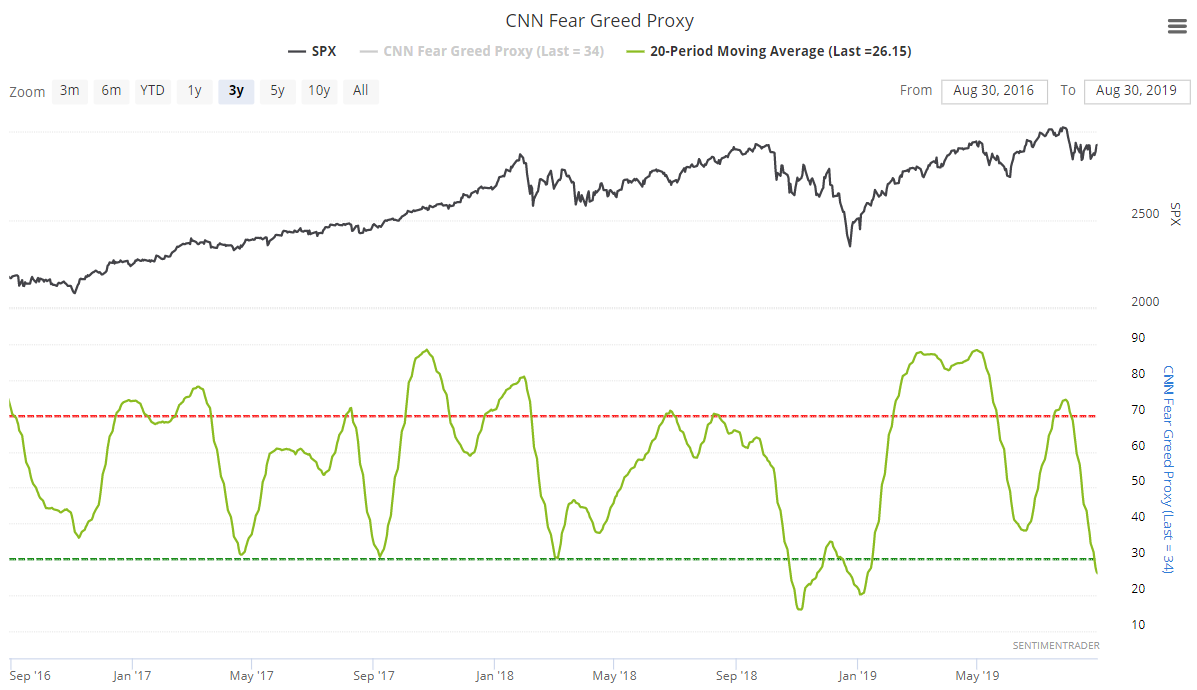
When this happened while the S&P was above its 200 dma in the past, the S&P often rallied over the next 3 months.
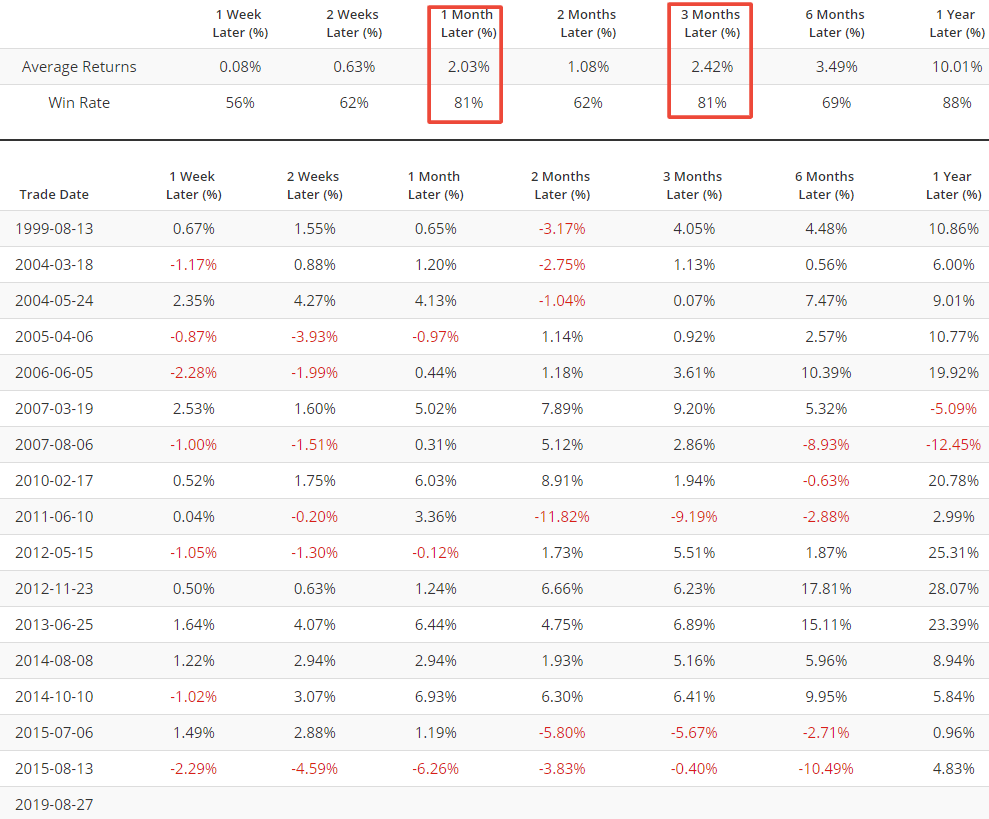
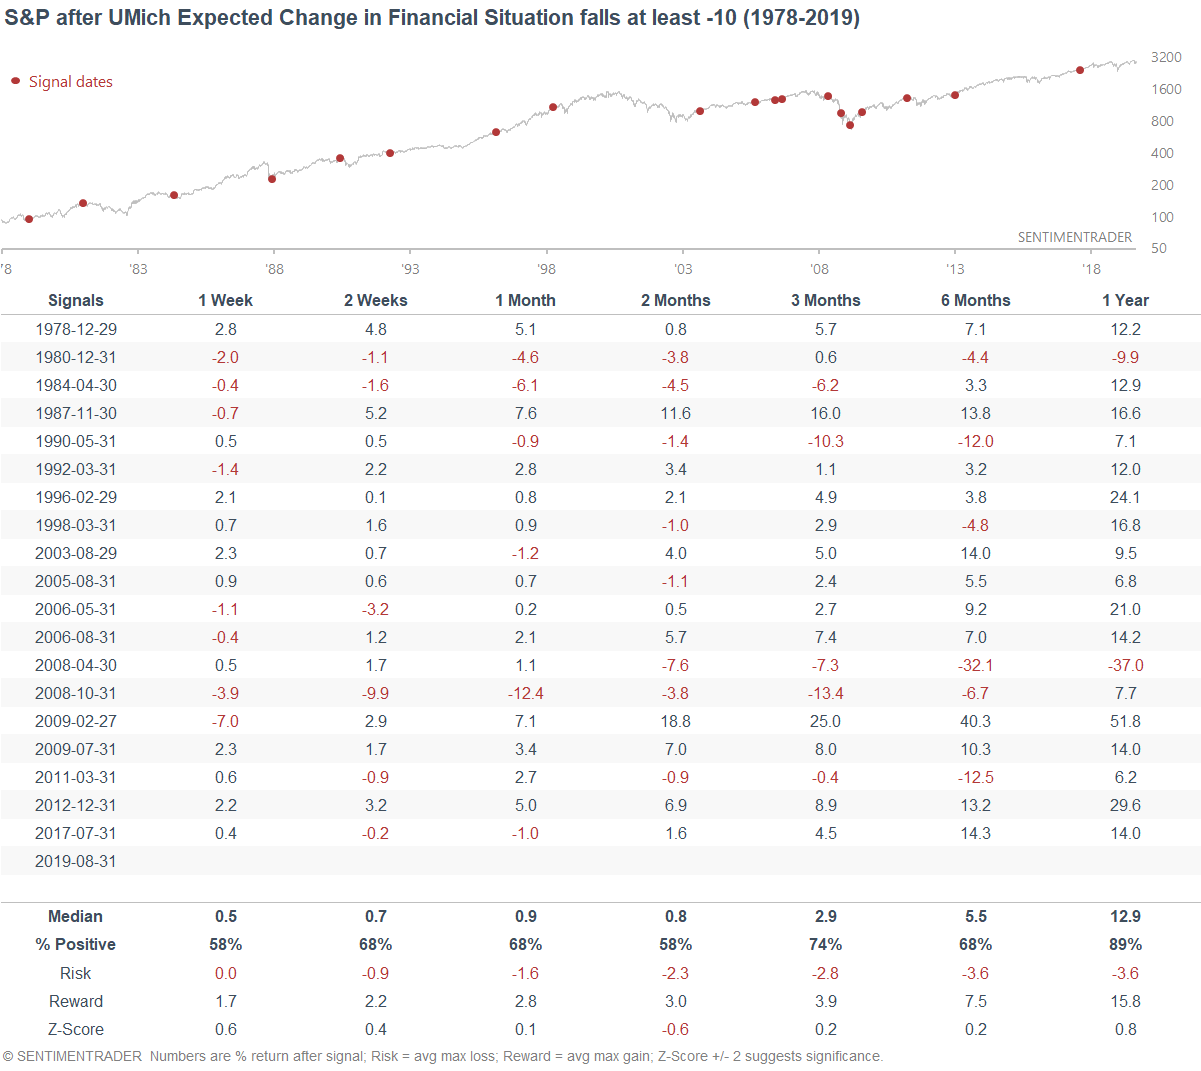
Meanwhile, the University of Michigan's household expectations for their finances tanked.
This tends to happen when a theme (e.g. trade war today, 1987 crash in October 1987, recession in 2008) is on everyone's minds. But more often than not, such fears were unfounded. Only 2 of the 19 historical cases saw losses over the next year.
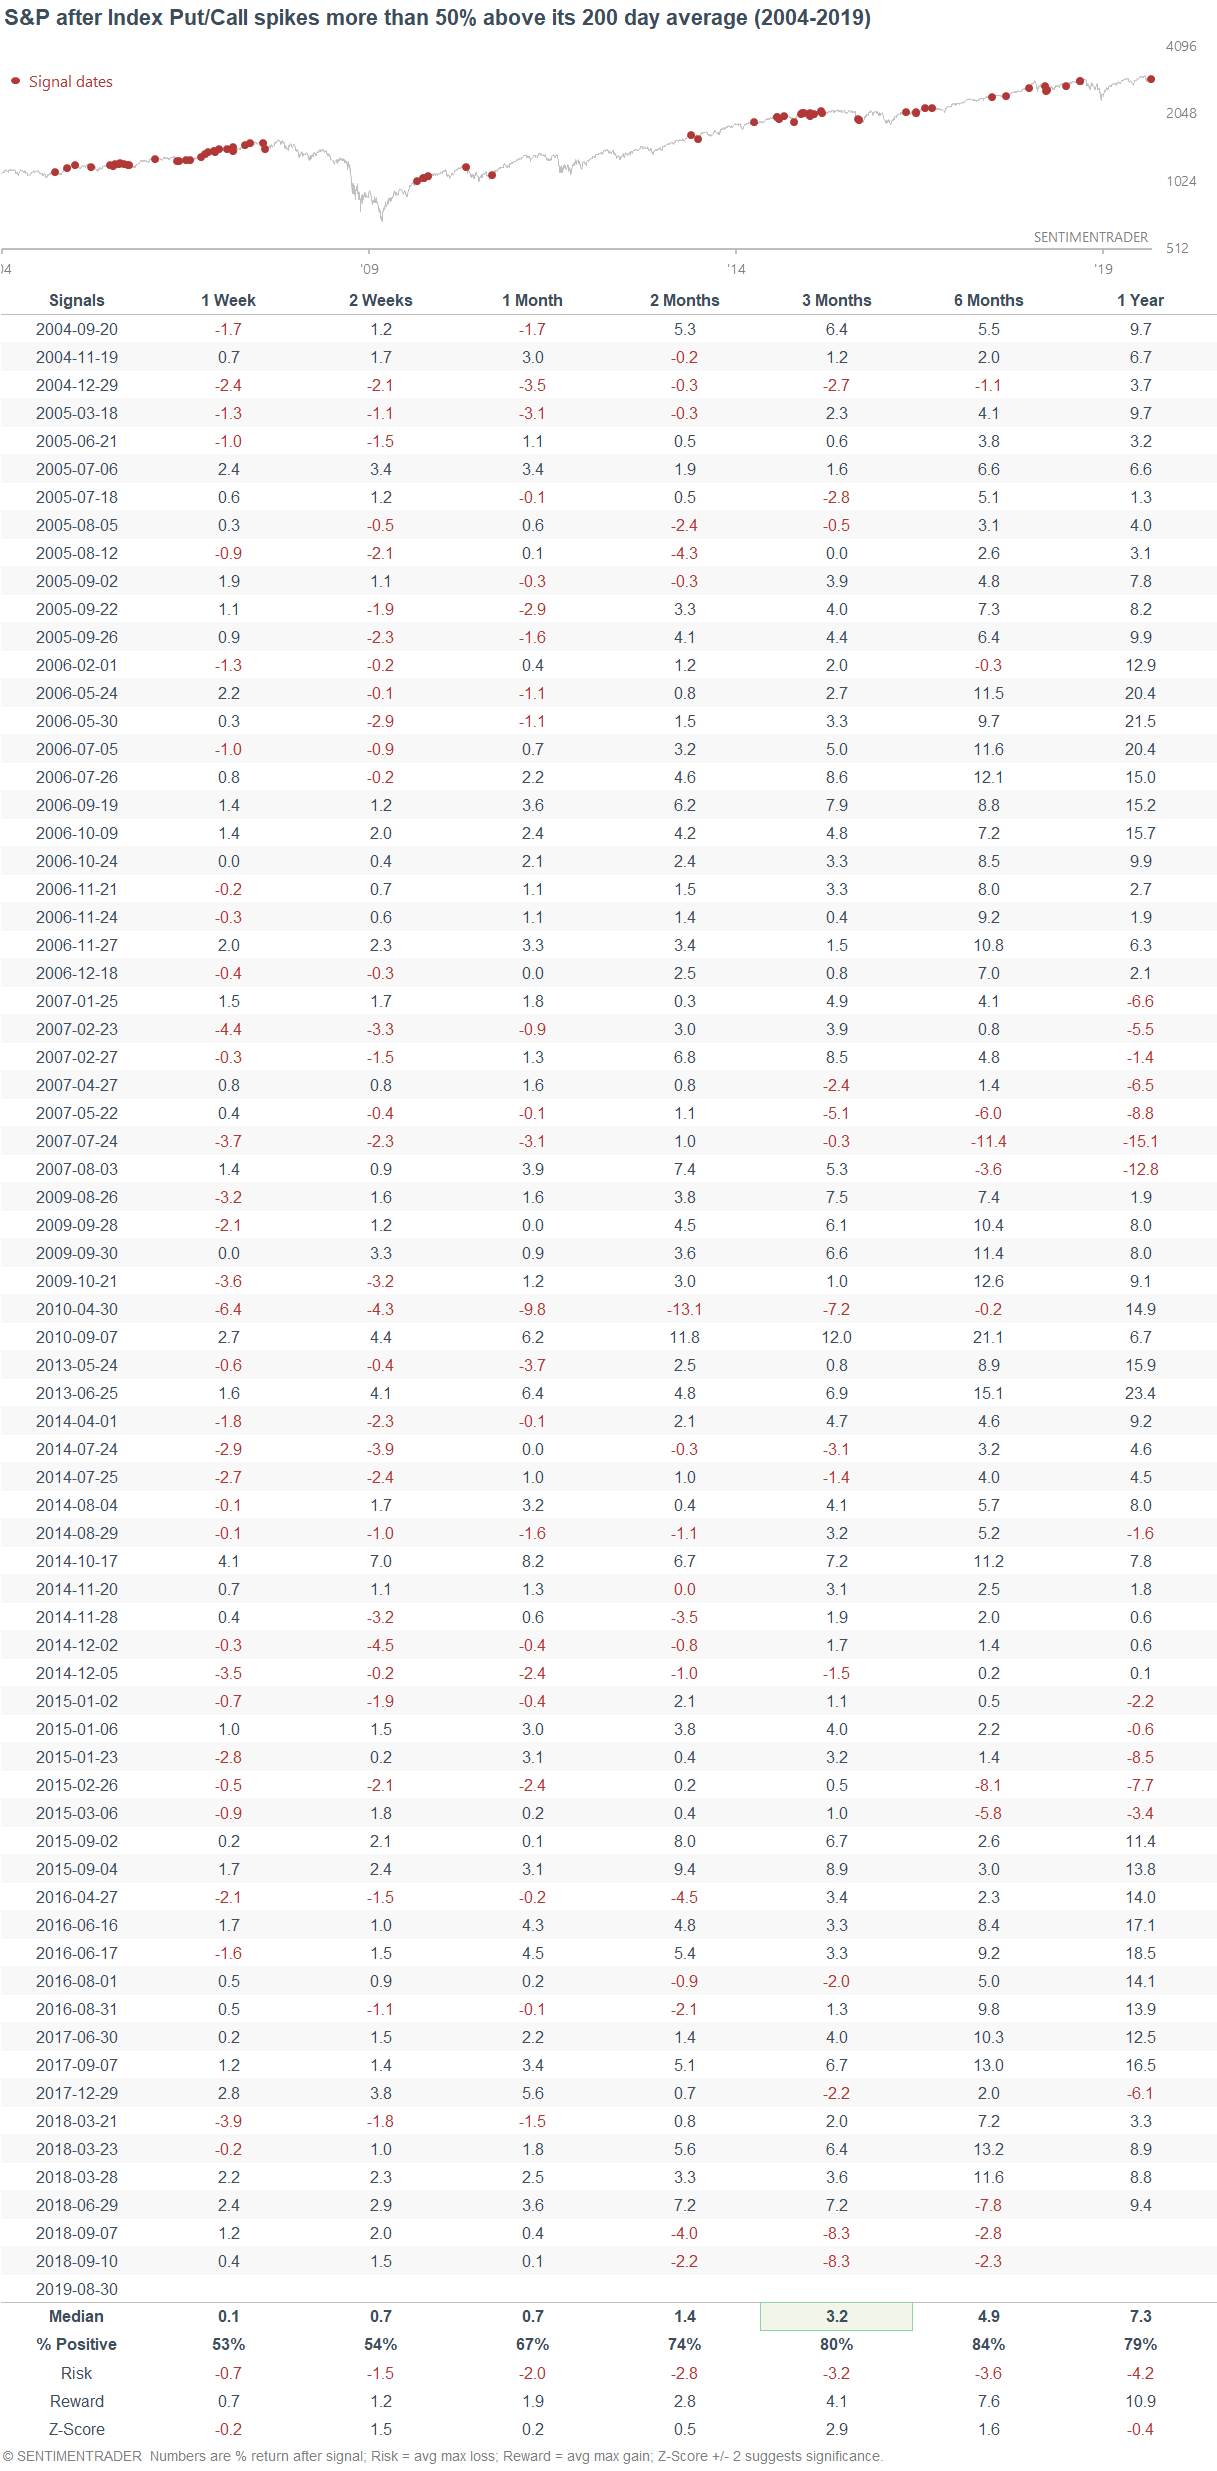
Put/Call
The Index Put/Call ratio spiked on Friday to more than 50% above its 200 day average.
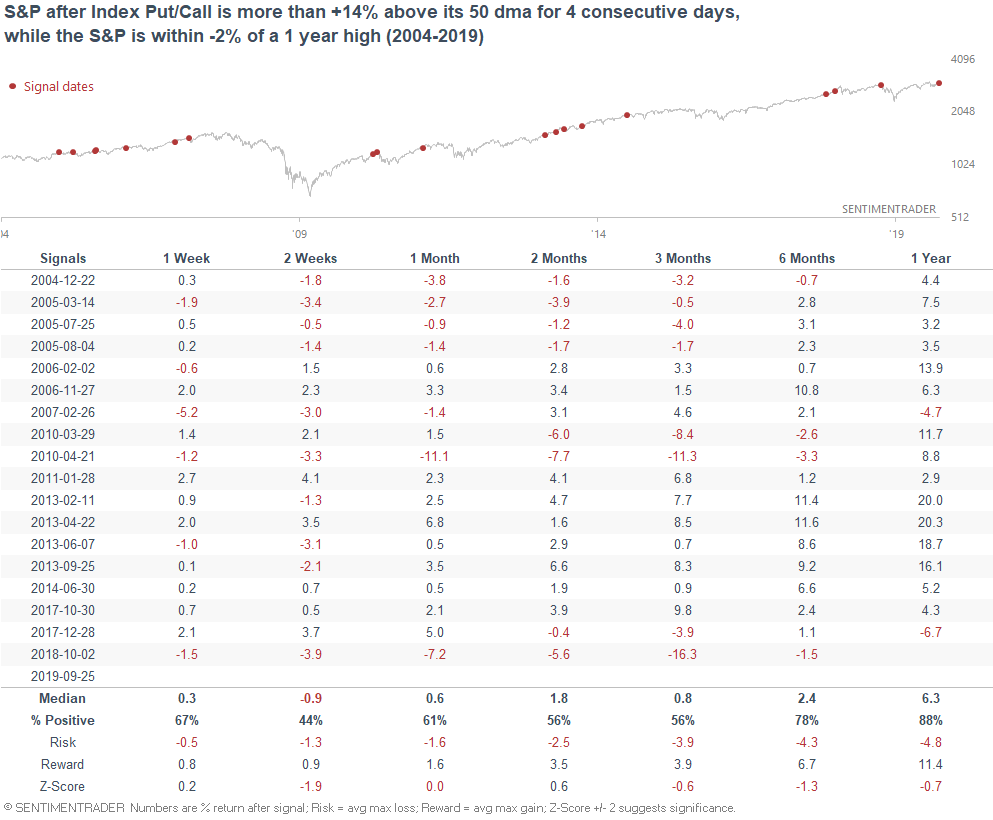
Such large Index Put/Call spikes historically were mostly bullish for the S&P over the next 3 months.
Breadth
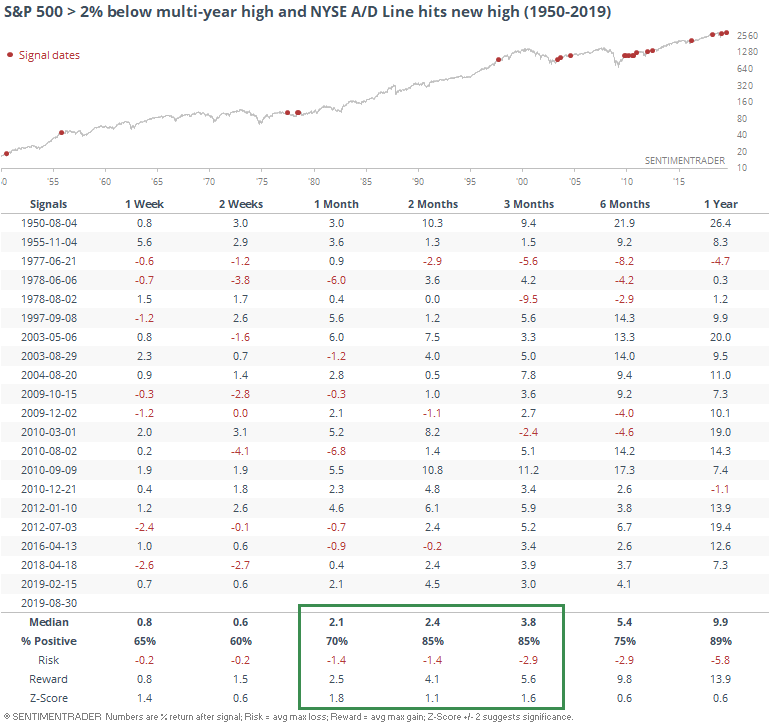
As Jason mentioned on Friday, the NYSE Advance-Decline Line has made a new high. This is important because in the past, the NYSE Advance-Decline Line peaked before big bear markets began.
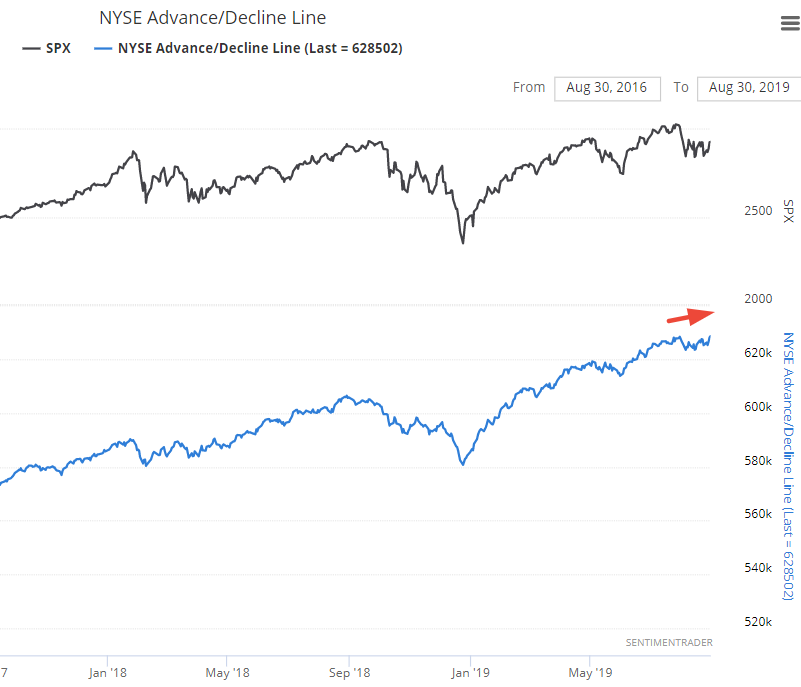
When the A/D Line made new highs in the past, it usually led the S&P higher over the next 2-3 months.
Correlations
As Jason mentioned on Thursday, more than half of this month' days have seen all 11 S&P sectors move in the same direction. This tends to happen when a widely followed theme (e.g. trade war) unnerves the markets, prompting one-directional daily swings.
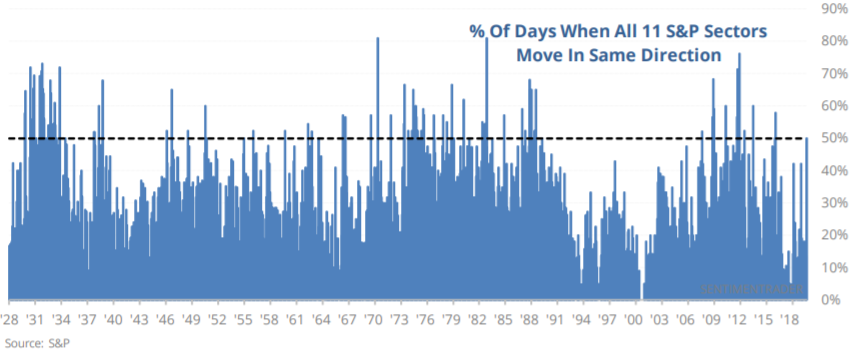
When this happened in the past, the S&P often rallied over the next 2-3 months, although the 1 year forward returns were less bullish than random because some of these concerns turned out to be very real and worse than expected (e.g. 2008 recession)

Uncertainty
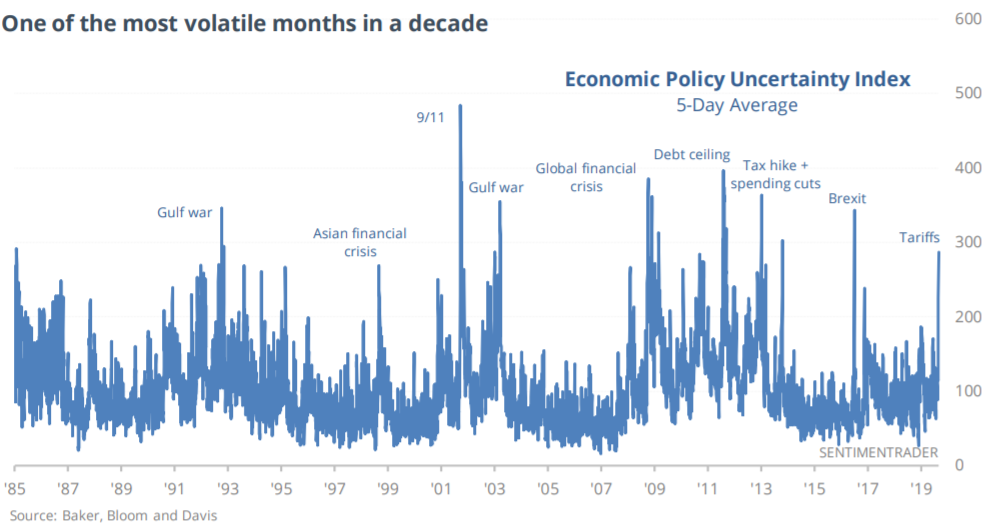
Speaking of uncertainty, Jason pointed out that the Economic Policy Uncertainty Index's 5 day average is extremely high. You can sense this even without data - just look at the endless talk about recessions, trade wars, tariffs, economic slowdown, yield curves...
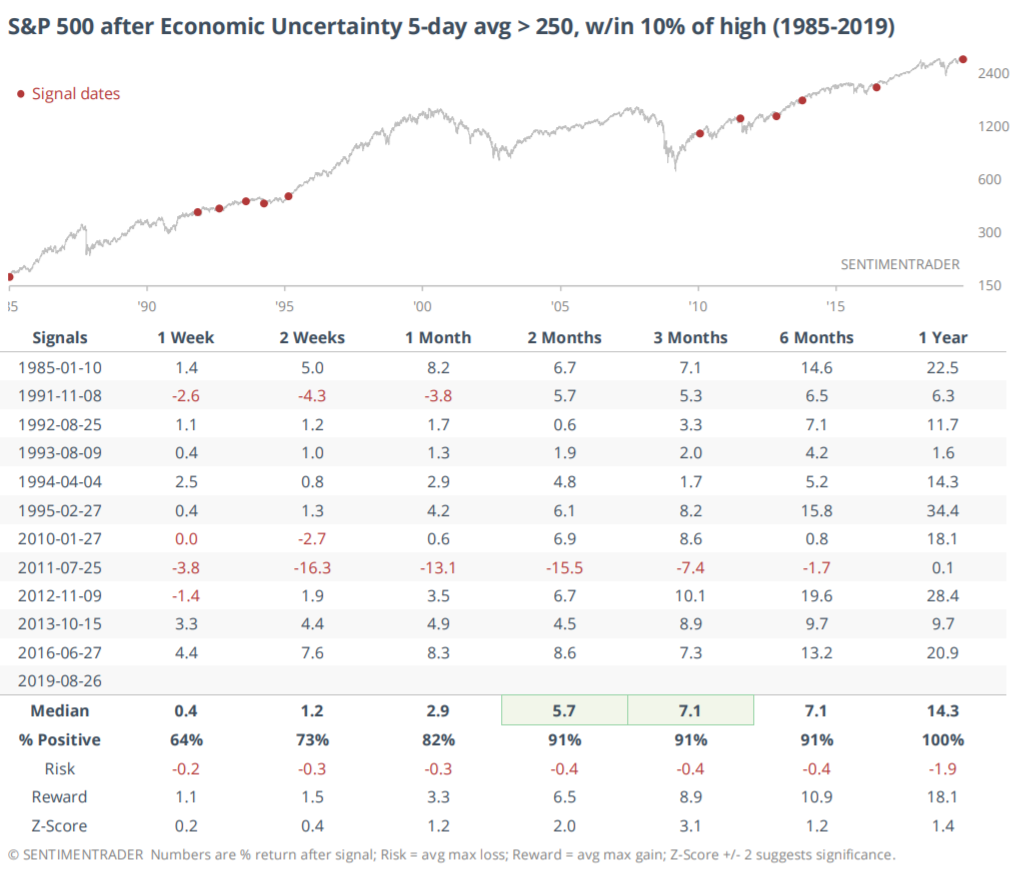
But as usual, it doesn't often pay to panic along with everyone else.
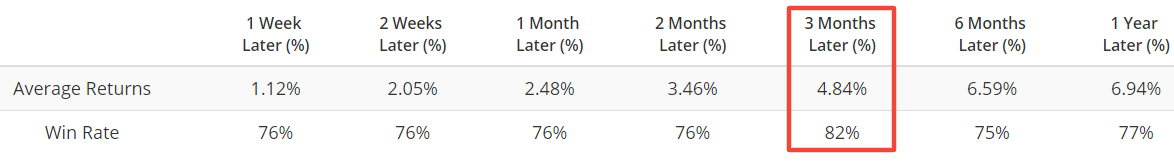
As a result of this uncertainty, small traders are paying a lot for puts. Our Small Trader Put/Call Premium has now risen above 0.7, while the S&P isn't far off from an all-time high.
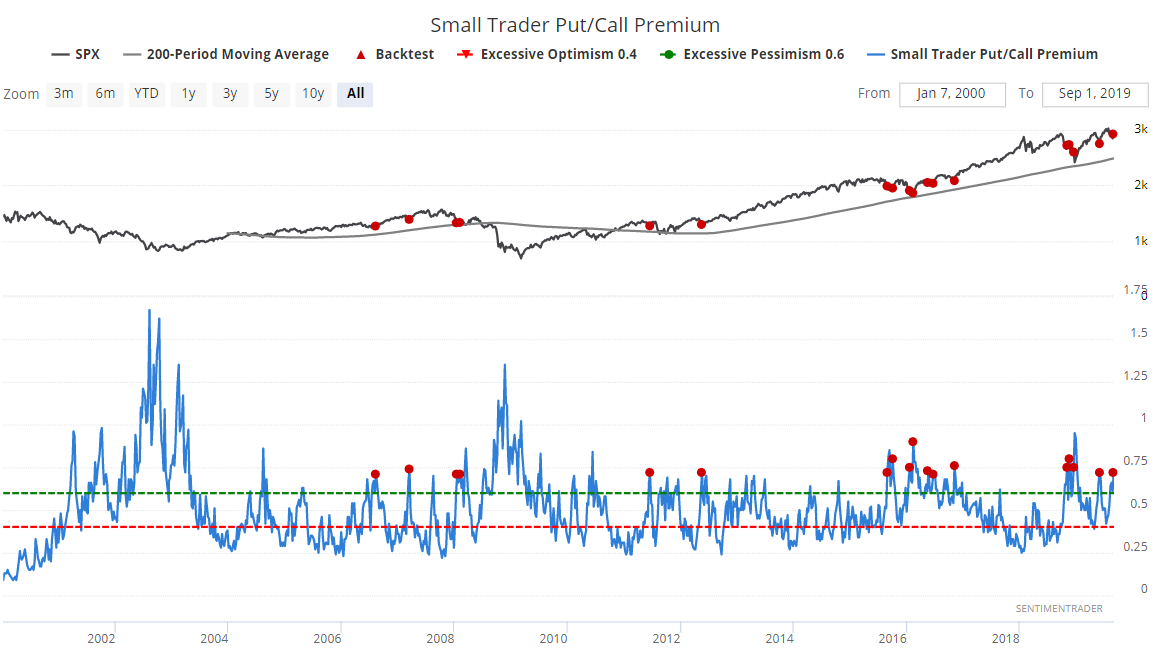
When this happened in the past, the S&P often rallied over the next 3 months.
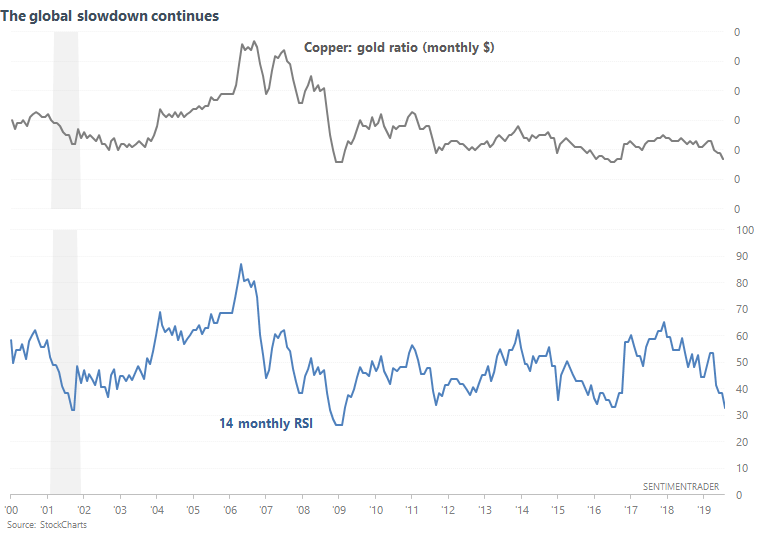
Copper vs. gold
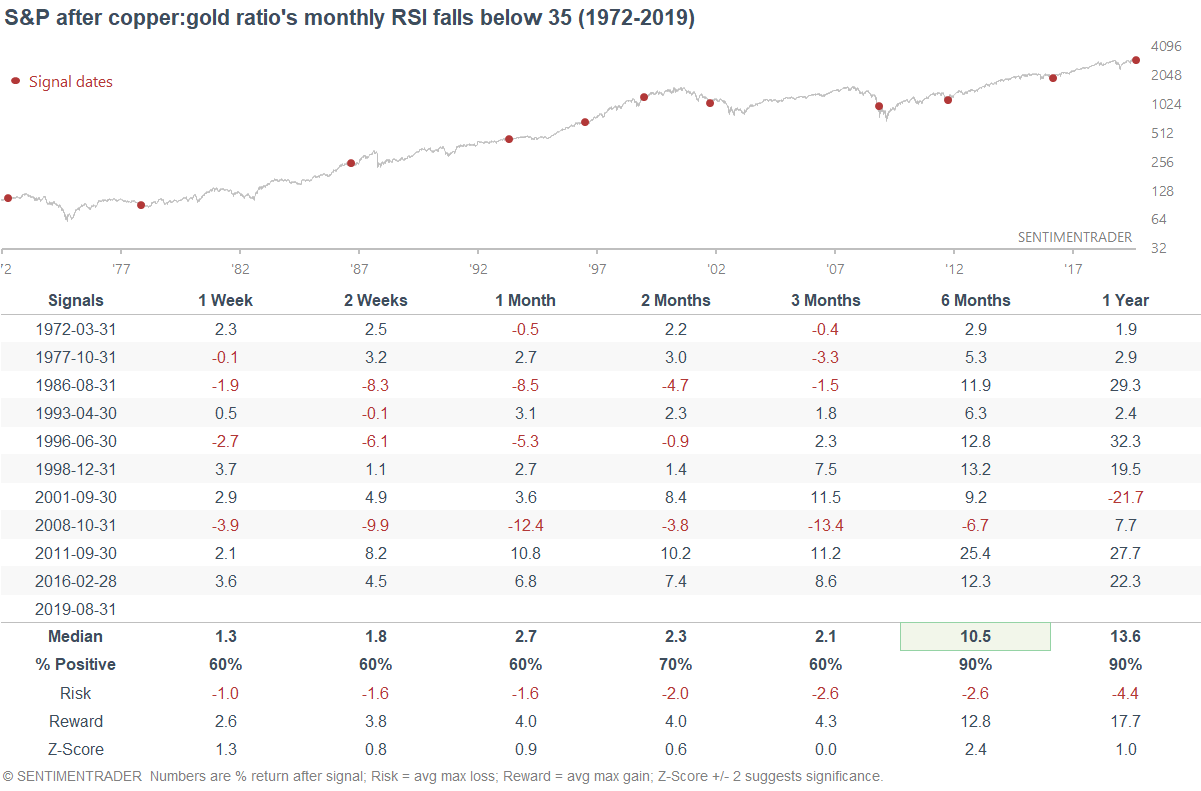
As the global economy slows down and trade war fears continue, the copper:gold ratio continues to sink. Hence, its monthly RSI has fallen below 35.
But by the time things were this bad in the past, the U.S. stock market often did quite well over the next 6 months.
To recap
- Long term risk:reward doesn’t favor bulls. Valuations are high, but valuations can remain high for years.
- Fundamentals (6-12 months): still bullish because there is no significant U.S. macro deterioration, but this could change IF macro data deteriorates over the next few months
- Technicals (3-6 months): mostly bullish
- Technicals (1-2 months): no clear edge in either direction.
*Economic Data charts (from "Fundamentals")
Housing Starts:
Building Permits:
New Home Sales:
ISM Manufacturing PMI:
Chemical Activity Barometer's year-over-year change in 3 month average:
10 year - 3 month yield curve:
Initial Claims:
Continued Claims:
Heavy Truck Sales:
Chicago Fed Financial Conditions Credit Subindex