
Market overview: pullback ahead?
With the U.S. stock market at all-time highs, sentiment increasingly frothy and breadth waning, here's my market outlook:
- Long term risk:reward doesn’t favor bulls. Valuations are high, but valuations can remain high for years before stocks crash.
- Fundamentals (6-12 months): still bullish because there is no significant U.S. macro deterioration, but this could change IF macro data deteriorates significantly over the next few months
- Technicals (3-6 months): neutral/bullish (various stock markets & sectors are breaking out, but some of our core indicators are showing excess optimism).
- Technicals (1-2 months): bearish.
Fundamentals (6-12 months)
The economy and the stock market move in the same direction in the long term. Hence, leading economic indicators are also long term leading indicators for the stock market.
Overall, there is no significant U.S. economic deterioration right now. This is bullish for the stock market on a 6-12 month time frame. The main weak points in U.S. macro revolve around trade, manufacturing, and the yield curve. For more details and charts, please see my weekly fundamentals post.
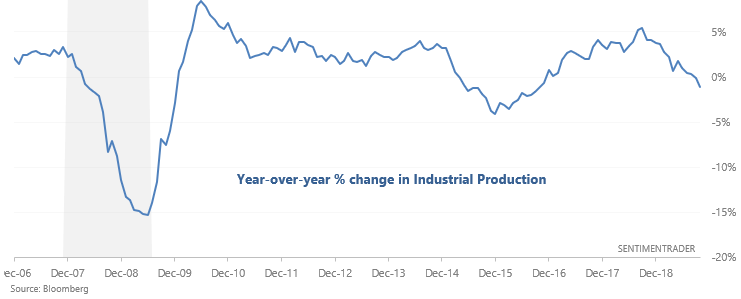
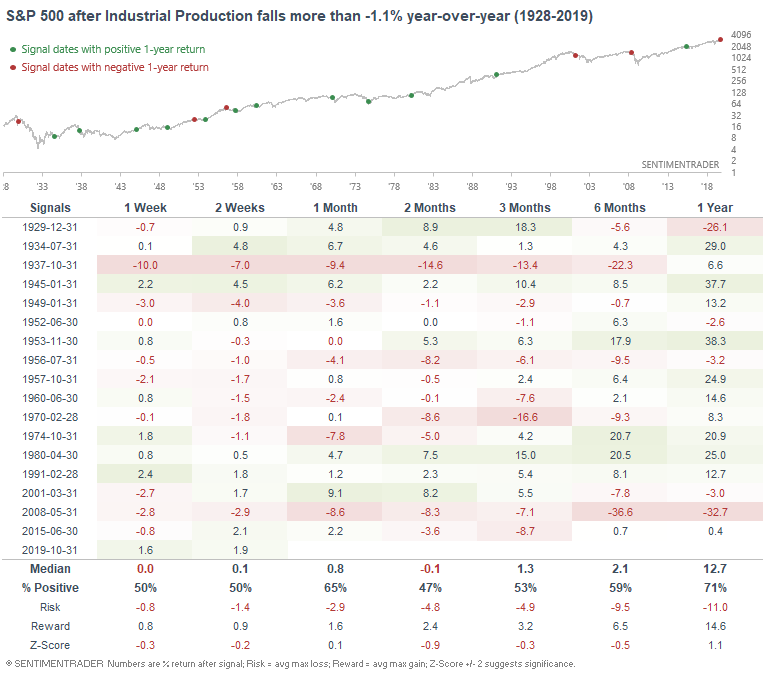
U.S. manufacturing continues to weaken. Industrial Production continues to fall, pushing its year-over-year % change below -1.1%:
When Industrial Production had fallen this much in the past, the S&P's returns over the next few months were mixed, with several large losses that coincided with recessions.
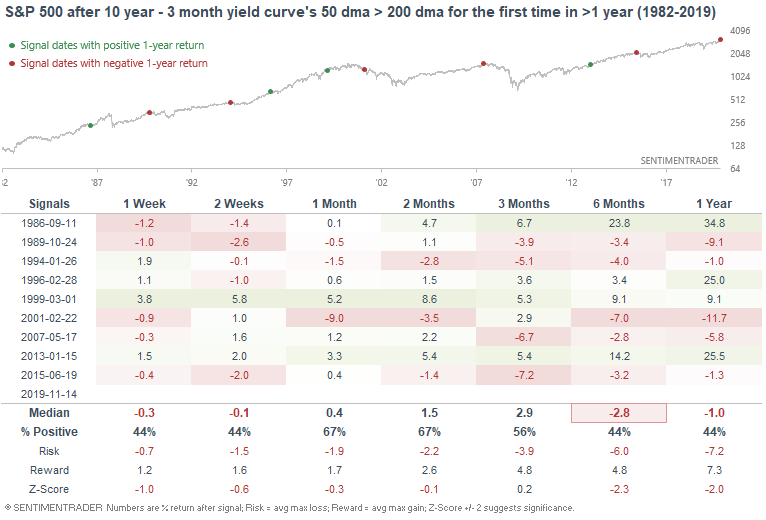
This week I once again looked at the steepening 10 year - 3 month Treasury yield curve, which formed a golden cross for the first time in more than a year:
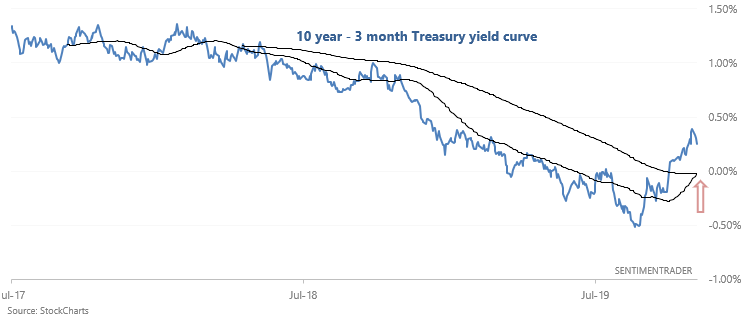
Steepening yield curves aren't great for the stock market, since this often happens during recessions:
Technicals (3-6 months)
The majority of our stats suggest that the stock market's 3-6 month outlook is bullish, although there are some bearish stats as well. Let's start with the bullish stats, and then we'll look at the bearish ones.
Bullish:
Trend
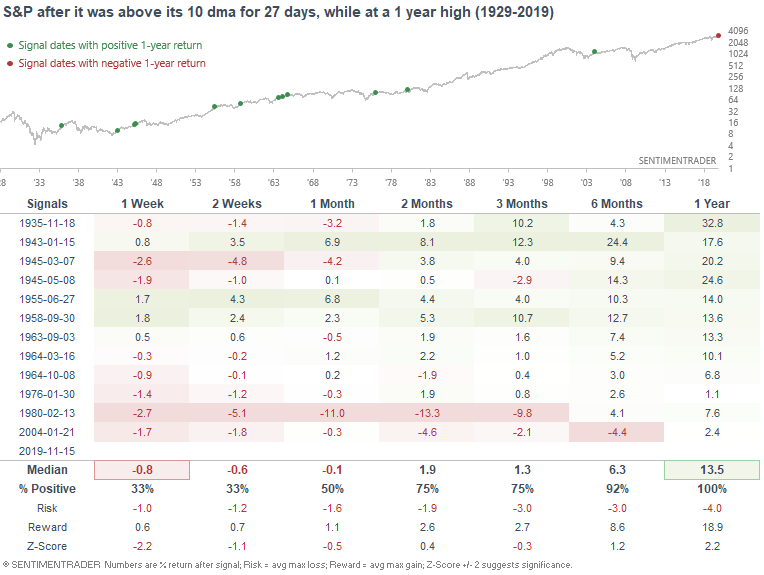
The stock market's rally over the past month has been consistent, with the S&P having remained above its 10 dma for 27 consecutive days:
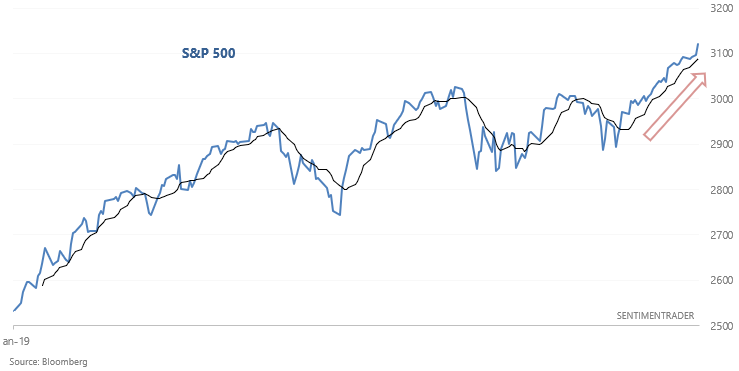
Such persistent rallies to new highs were typically short term bearish for stocks, but bullish over the next year.
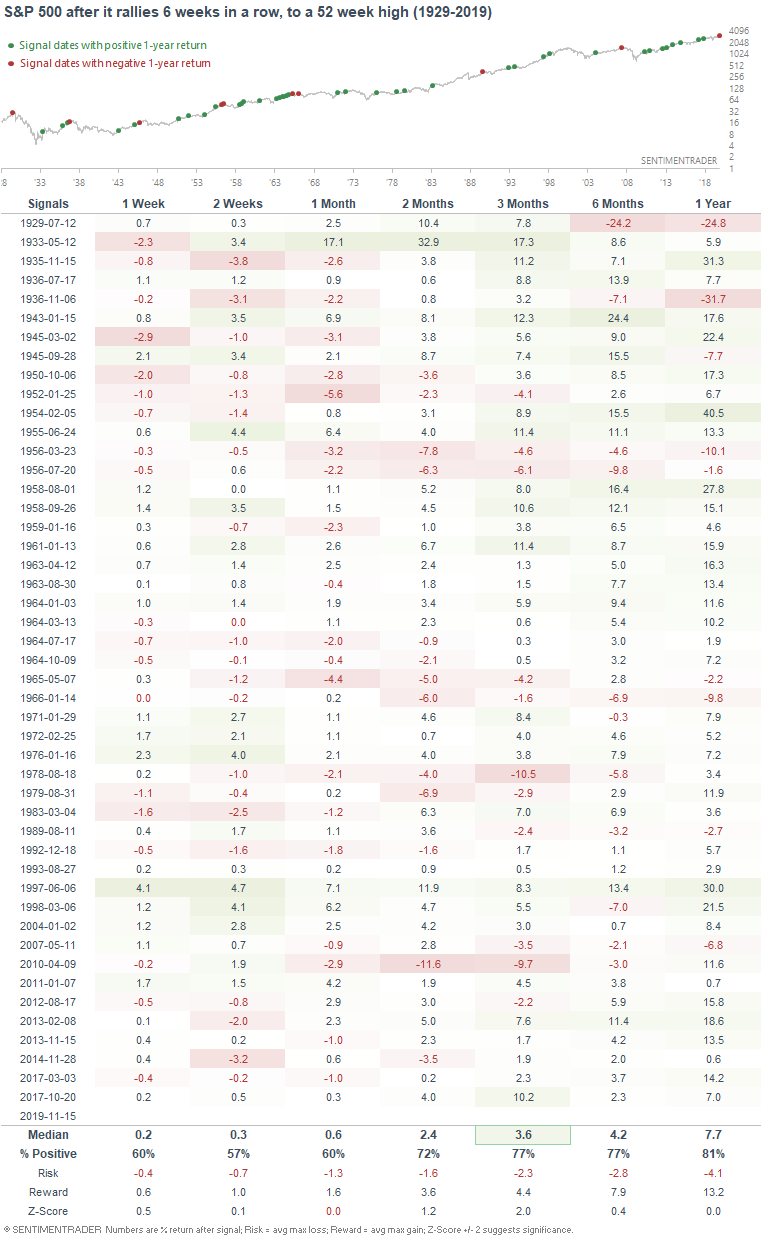
From another perspective, the S&P 500 has rallied 6 weeks in a row and sits at an all-time high. Momentum is hard to beat. When the S&P rallied 6 weeks in a row to a 52 week high in the past, it typically continued to rally over the next 3 months:
Breakouts
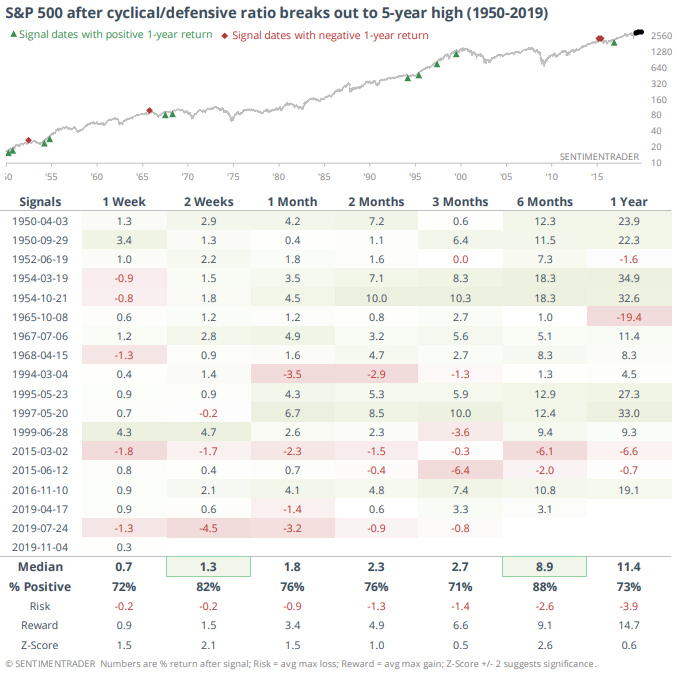
As Jason demonstrated on Tuesday, cyclicals have broken out to a 5 year high relative to defensive stocks:
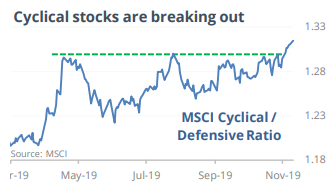
Such breakouts are typically bullish for stocks over the next 6 months:
Overseas markets
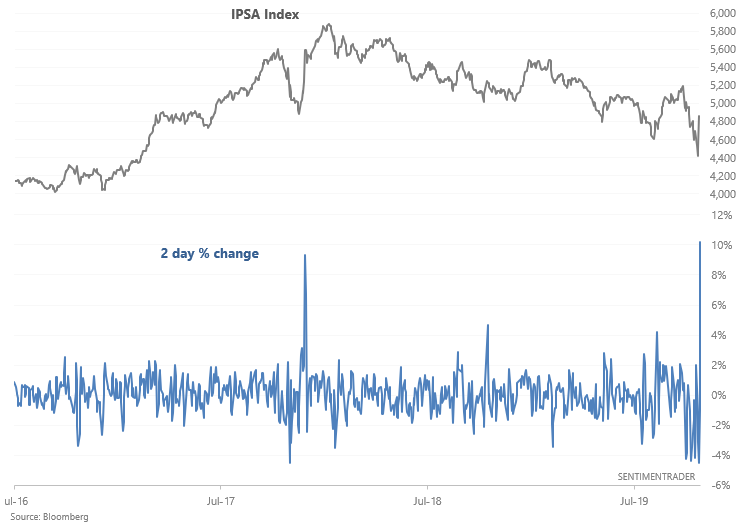
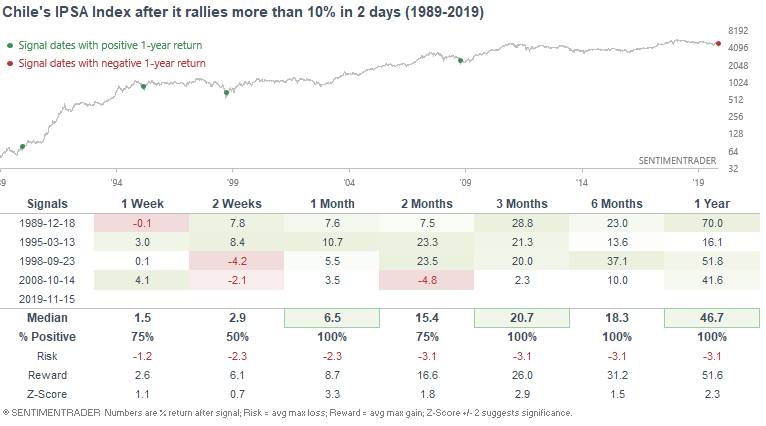
Continuing with our theme of breakouts and rallies in ex-U.S. markets, Chile's IPSA Index has surged more than 10% over the past 2 days from a multi-year low:
Such strong rallies are rare, with the last 3 signals occurring near multi-year bottoms:
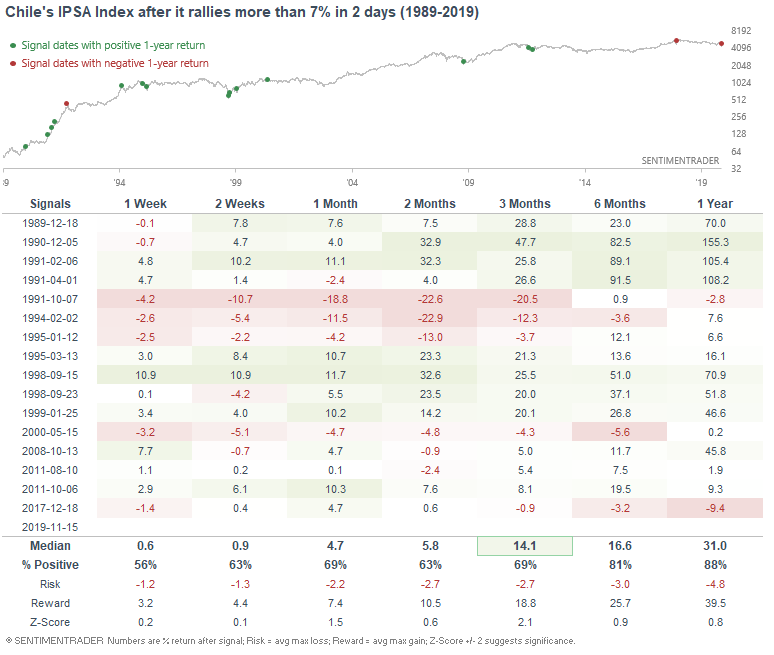
Loosening the study's parameters (2 day rally >7% instead of 2 day rally >10%) is still mostly bullish for Chilean stocks over the next 6-12 months:
Bloomberg TV had an interesting chart which demonstrated the strong shift away from emerging markets and into gold over the past 6 months. The following is a 120 day correlation (approximately half a year) between the MSCI Emerging Markets Currency Index and gold:
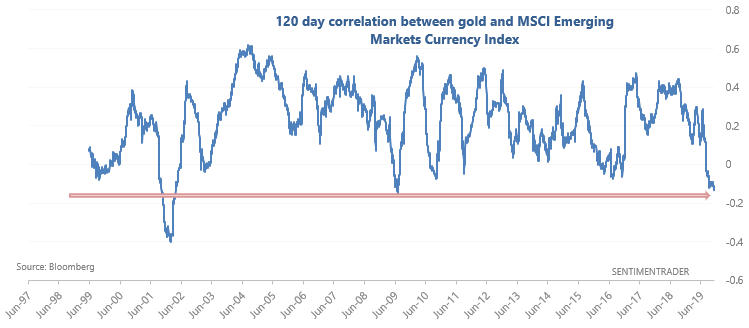
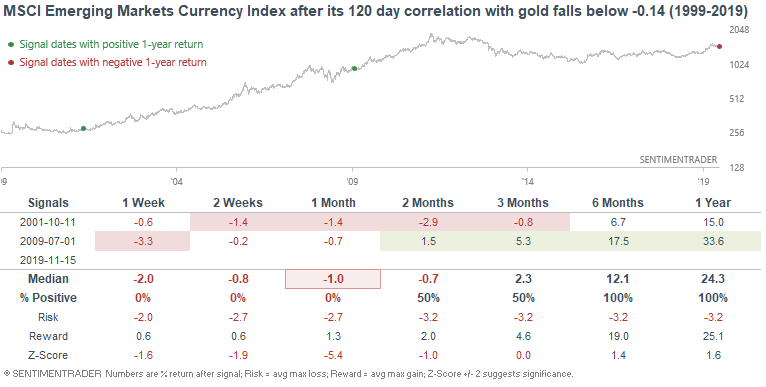
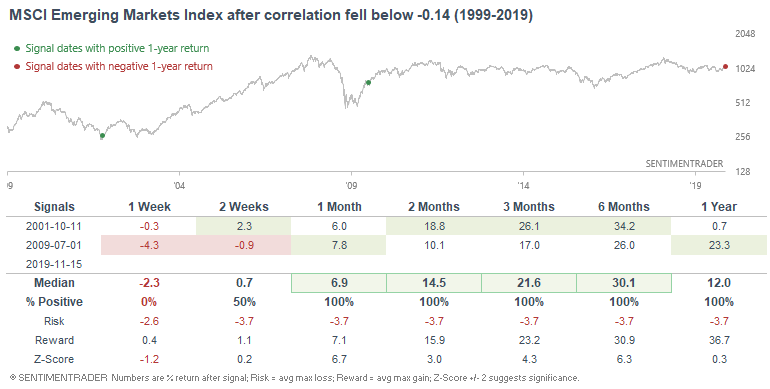
Such shifts away from emerging markets and into safe havens marked multi-year lows in emerging market currencies and equities:
Neutral/bearish:
Breadth & sentiment
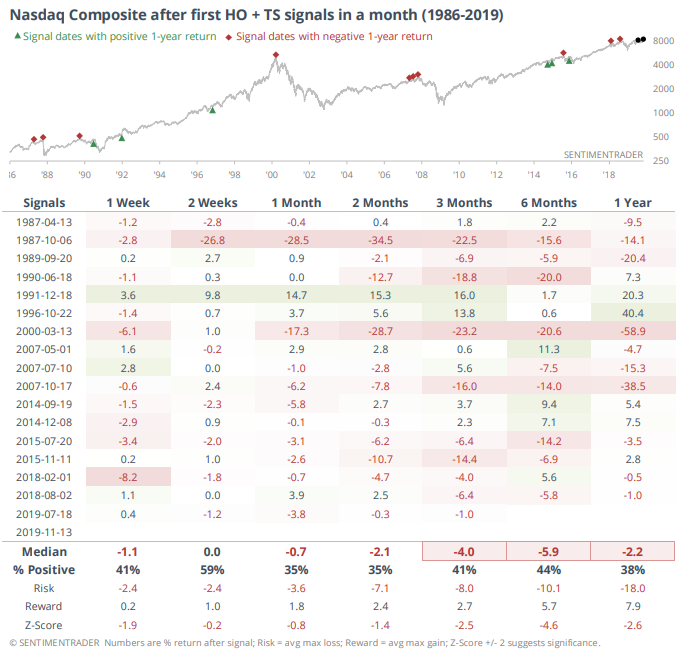
As Jason noted on Wednesday & Thursday, the Hindenburg Omen and Titanic Syndrome triggered for the NASDAQ this week:
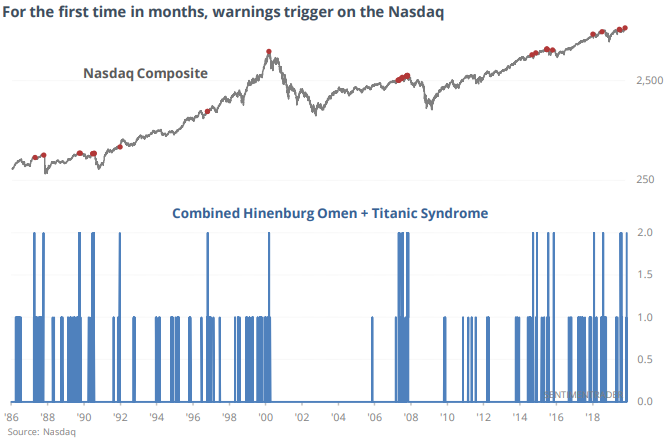
When these were triggered in the past, the NASDAQ often performed poorly over the next few months:
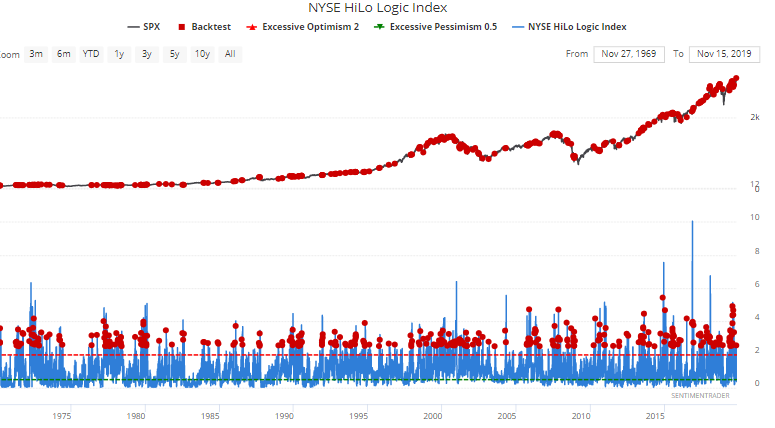
Other breadth indicators also suggest that stocks will struggle in the weeks/months ahead. I noted on Thursday that the NYSE HiLo Logic Index had exceeded 2.5 (i.e. a split market):
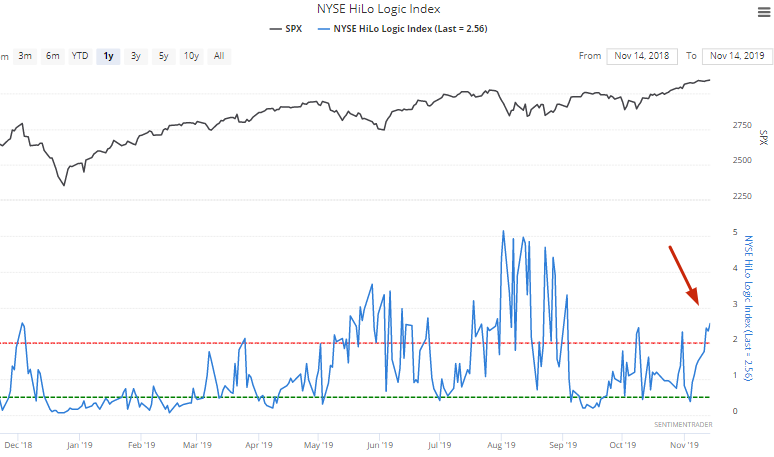
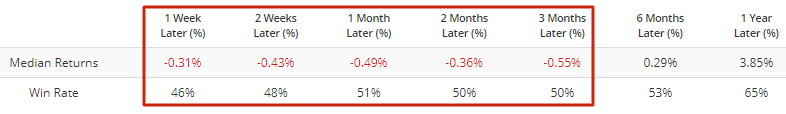
This wasn't a great sign for stocks in the past:
For more examples of frothy sentiment, see my post on Tuesday.
Technicals (1-2 months)
Various stats suggest that the stock market is about to go through a rough patch (either pullback or consolidation) over the next few weeks and months. As always, I have more confidence in higher time frame predictions than shorter time frame predictions. The shorter the time frame, the more random and unpredictable events (e.g. a trade war tweet) can impact the markets.
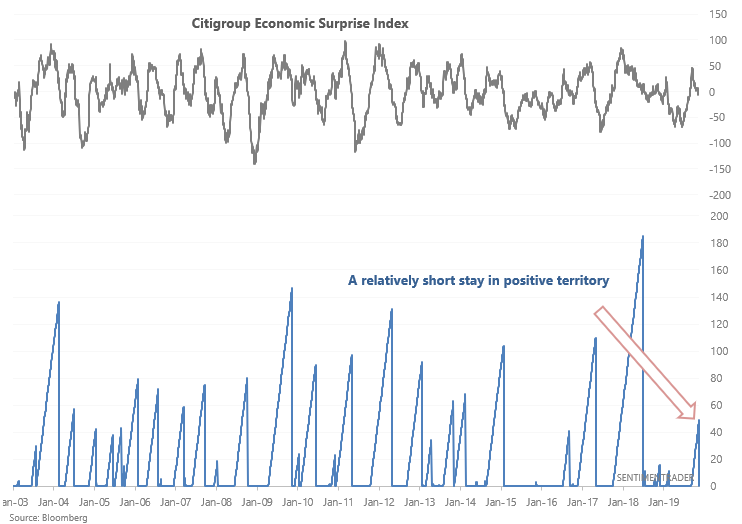
Economic Surprise
After being negative for many months this year, the Citigroup Economic Surprise Index had a brief spike, and is now back down in negative territory. This is uncommon. When the Economic Surprise Index is positive, it tends to stay positive for many months before turning negative. Perhaps this suggests that economic data does not have the strength to consistently outperform expectations, which could be a short term negative for stocks:
The following table demonstrates what happened next to the S&P when the Economic Surprise Index was positive for more than 10 days (a material positive streak), but less than 50 days (relatively short):
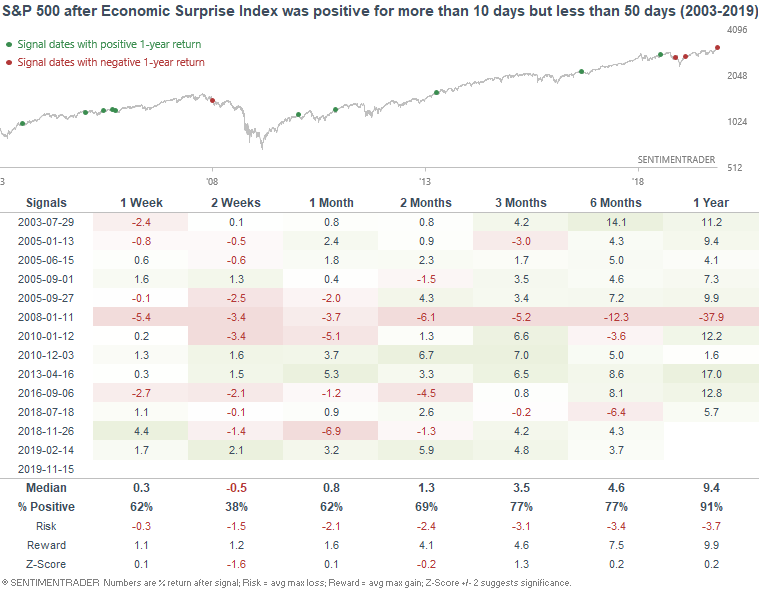
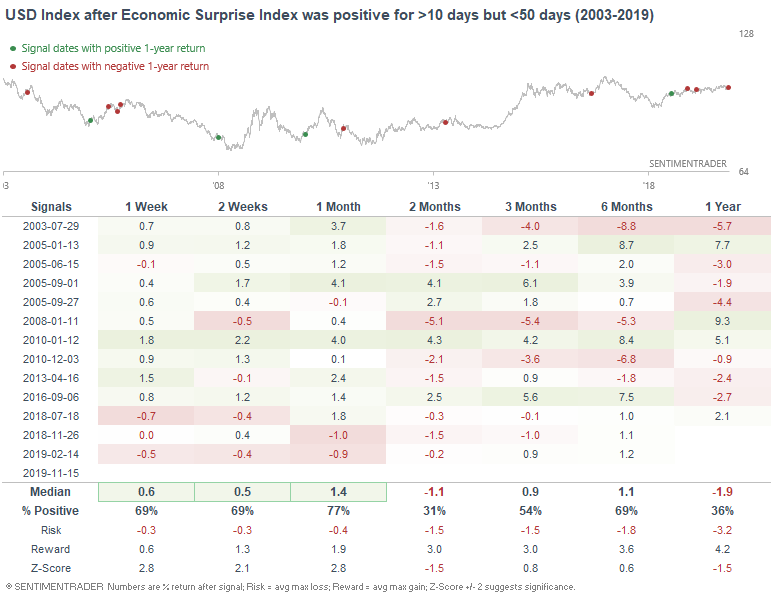
As you can see, the S&P's returns over the next 2 weeks were weak, with risk:reward skewed towards the bears. Meanwhile, this was mostly bullish for the U.S. Dollar Index over the next month:
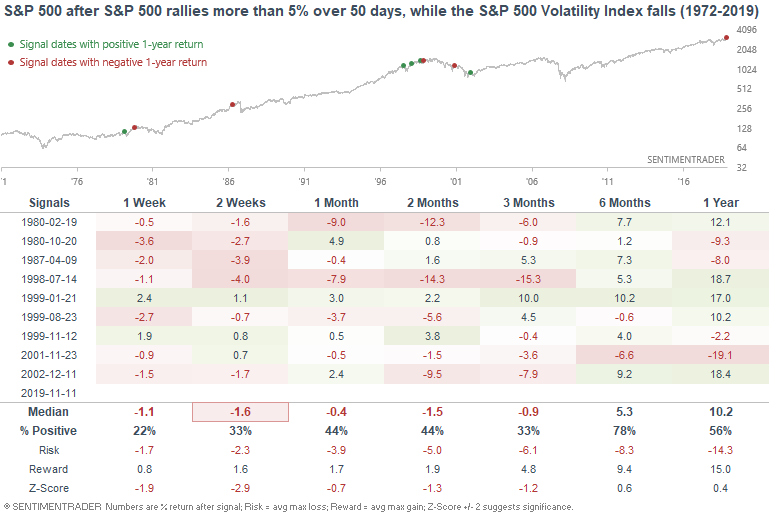
Low volatility
The lack of volatility remains concerning for stocks in the short term. For example, I noted on Tuesday that the S&P 500 Low Volatility Index has lagged the S&P significantly over the past 50 days:
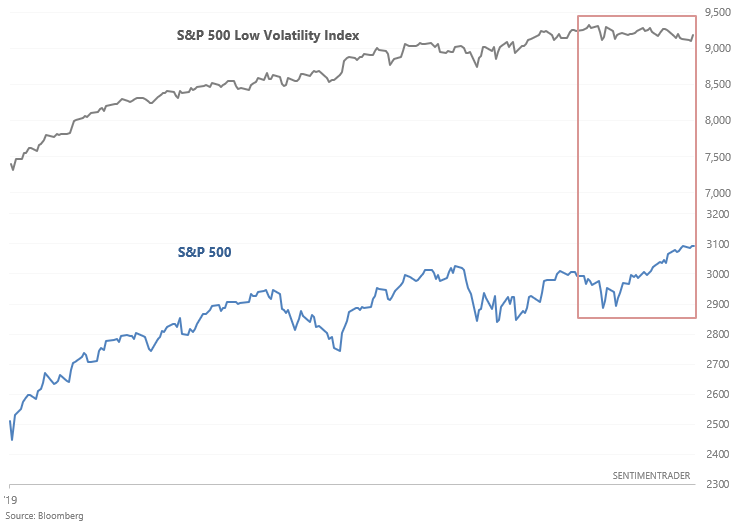
Such rapid shifts away from defensive assets weren't great for stocks over the next few weeks:
To recap
- Long term risk:reward doesn’t favor bulls.
- Fundamentals (6-12 months): still bullish because there is no significant U.S. macro deterioration.
- Technicals (3-6 months): neutral/bullish
- Technicals (1-2 months): bearish