
Market overview: some more signs of macro weakness
The stock market appears to have broken out from its August range during a shortened week. Here's my market outlook:
- Long term risk:reward doesn’t favor bulls. Valuations are high, but valuations can remain high for years.
- Fundamentals (6-12 months): still bullish because there is no significant U.S. macro deterioration, but this could change IF macro data deteriorates significantly over the next few months
- Technicals (3-6 months): mostly bullish
- Technicals (1-2 months): no clear edge in either direction.
Fundamentals (6-12 months)
The economy and the stock market move in the same direction in the long term. Hence, leading economic indicators are also long term leading indicators for the stock market.
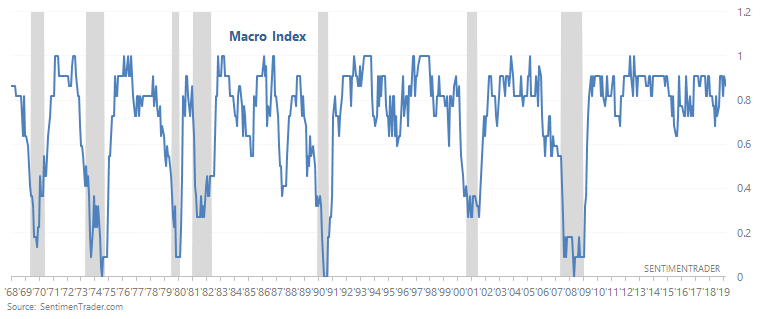
Here is our Macro Index, which aggregates 11 leading indicators. Overall, there is no significant U.S. economic deterioration right now. What will happen to macro in the future? I don't know. Instead of predicting the future, macro tells us how to react and trade day-by-day depending on what's happening right now.
The main weak points in U.S. macro revolve around trade, manufacturing, and the yield curve. Housing and financial conditions are semi-weak, but there has yet to be significant deterioration. Let's take a look at the data. (Please see the specified economic-data charts at the bottom of this post.)
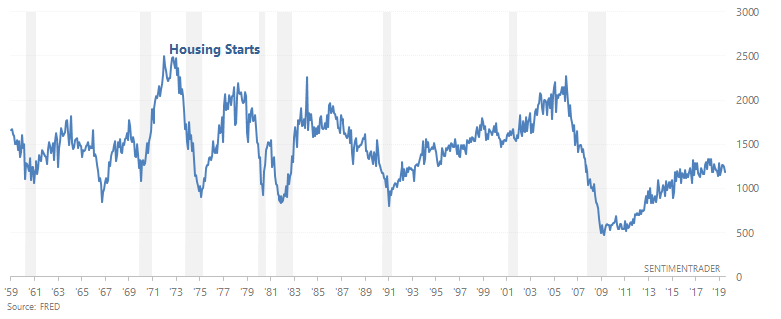
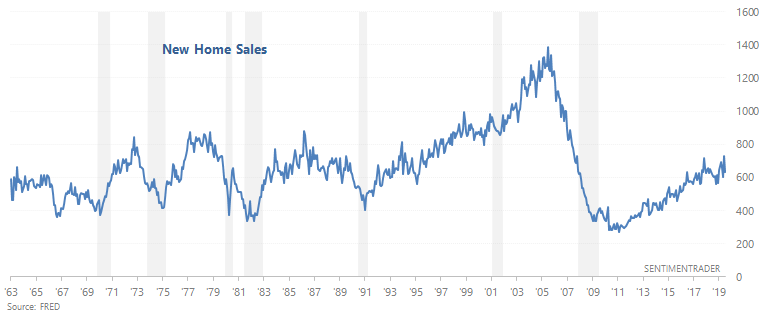
- Housing remains slightly weak, which makes this a slight negative for macro right now. In the past, Housing Starts, Building Permits, and New Home Sales trended downwards before recessions began. Housing Starts and Building Permits are trending sideways/downwards right now, while New Home Sales is trending sideways.
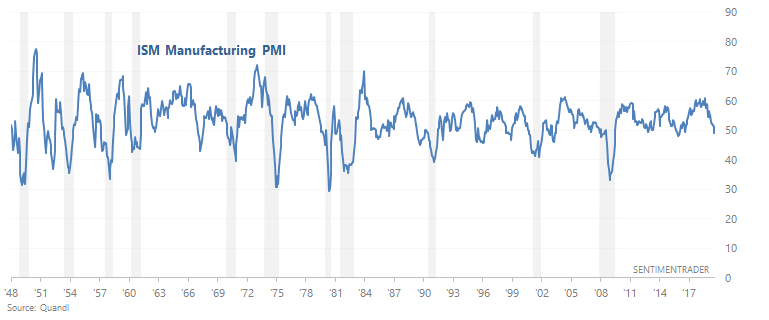
- Manufacturing-related data remains weak. The ISM manufacturing PMI has fallen below 50, signalling contraction.
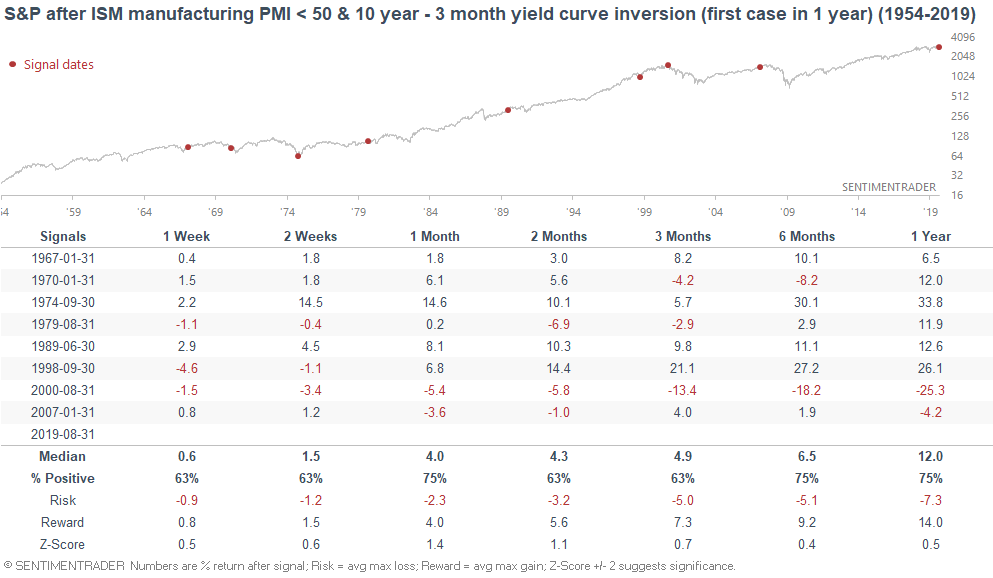
- The yield curve remains a long term bearish factor for stocks. As we've demonstrated many times here at SentimenTrader, yield curve inversions typically happen near the end of economic expansions and bull markets.
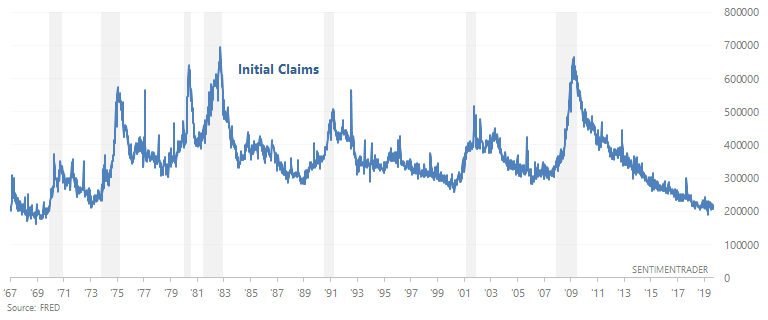
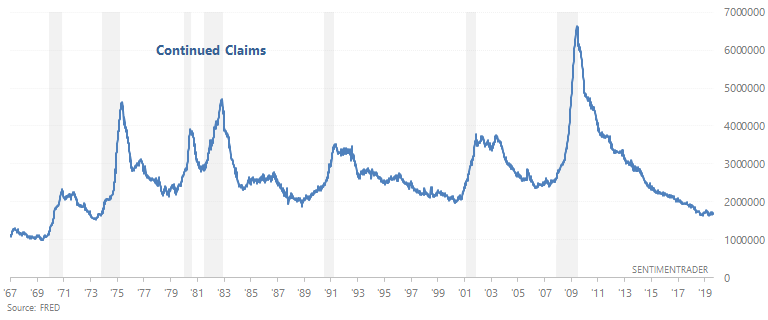
- The labor market is still a bullish factor for macro. 2 leading labor market indicators - Initial Claims and Continued Claims - continue to trend sideways. In the past, Initial Claims and Continued Claims trended upwards before recessions began.
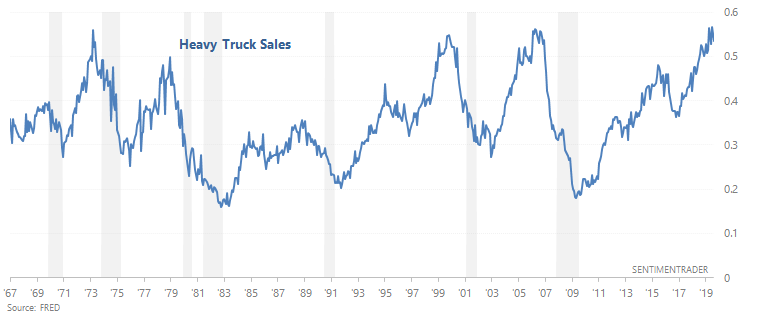
- Heavy Truck Sales is still a bullish factor for macro because this indicator is still trending upwards. In the past, Heavy Truck Sales trended downwards before recessions began.
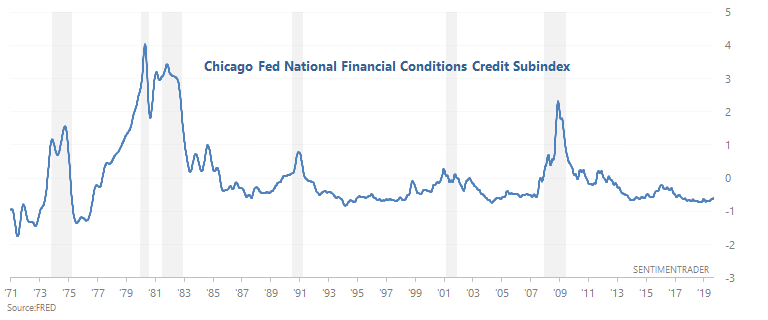
- The Chicago Fed Financial Conditions Credit Subindex is starting to trend upwards and recently hit a 2 year high. In the past, this wasn't great for stocks in the long run because it often happened during periods of economic weakness, some of which turned into big stock market declines. I'm not too concerned about this yet, but will be if the Credit Subindex continues to trend higher over the next few weeks and months.
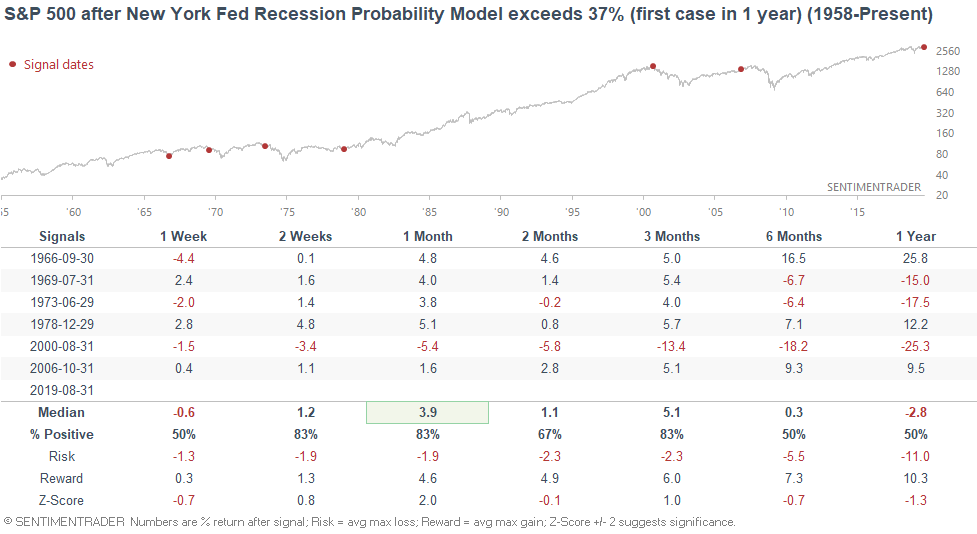
As we noted on Thursday, the popular Citigroup Economic Surprise Index has finally turned positive after being negative for a long time.
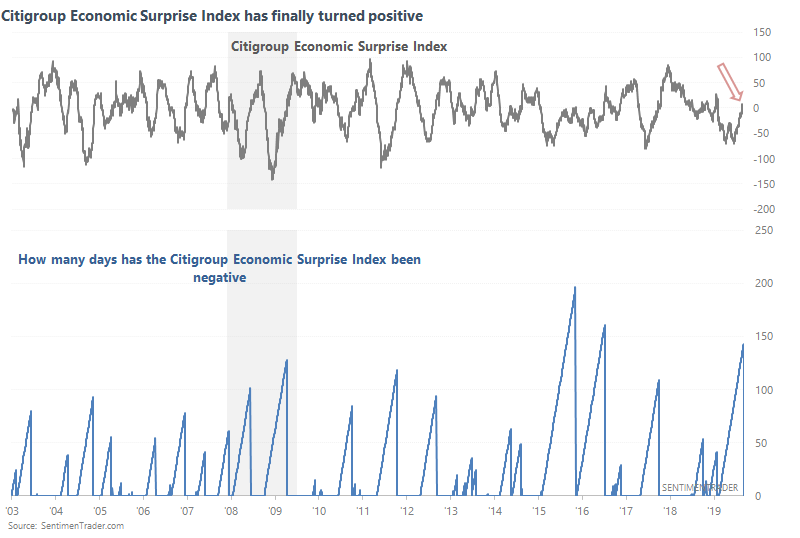
The first positive reading was mixed for the S&P over the next few months, but generally positive over the next year. The one big exception was June 2008, when the economy was in a worsening recession.

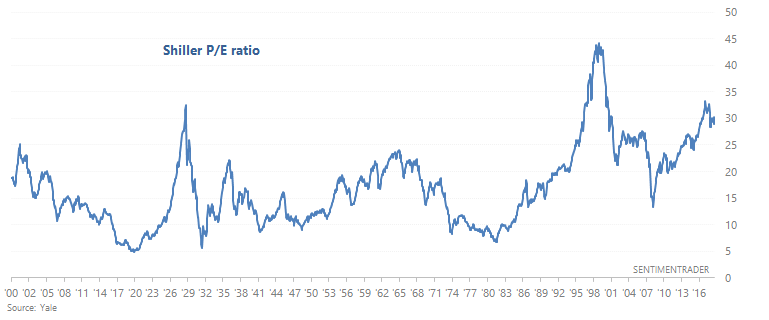
And lastly, long term risk:reward does not favor bulls right now. Valuations are high, which suggests that the stock market's returns on a 5-10 year forward basis will be worse than random. But whereas increasing valuations provide the powder for a stock market "explosion" (i.e. big bear market), recessions provide the spark. And a recession right now is unlikely. In general:
- High valuations + recession = big bear market (e.g. -40% decline)
- Low valuations + recession = small bear market (e.g. -20% or -30% decline)
Technicals (3-6 months)
The stock market is usually hard to predict on a 1-2 month forward basis, unless there is an extreme. There are few decisive short term extremes right now. So let’s focus on a 3-6 month forward basis.
Sectors
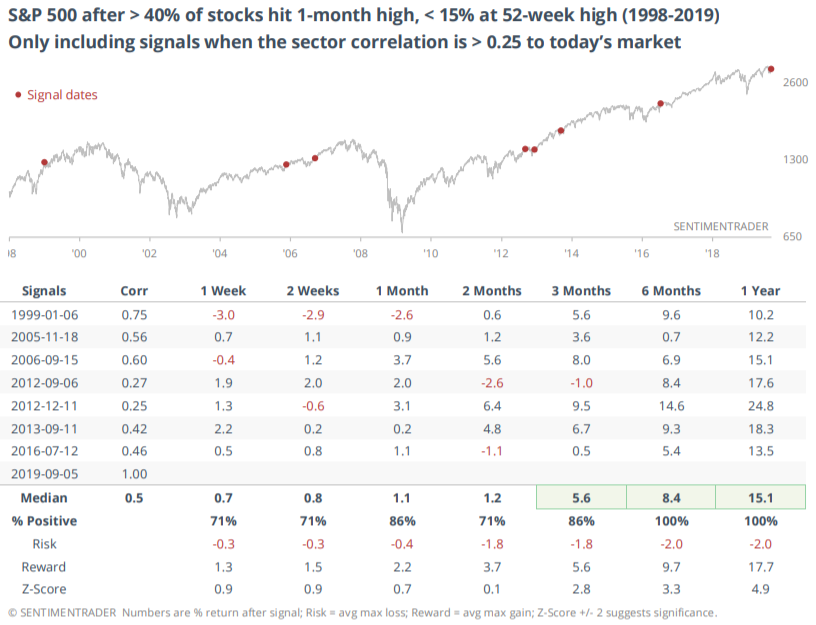
As Jason noted on Friday, more than 40% of S&P stocks have hit a 1 month high but fewer than 15% have hit a 52 week high. "This shows good shorter-term momentum in what has been a cautious longer-term market." But more importantly, cyclical sectors are leading the jump in new highs.
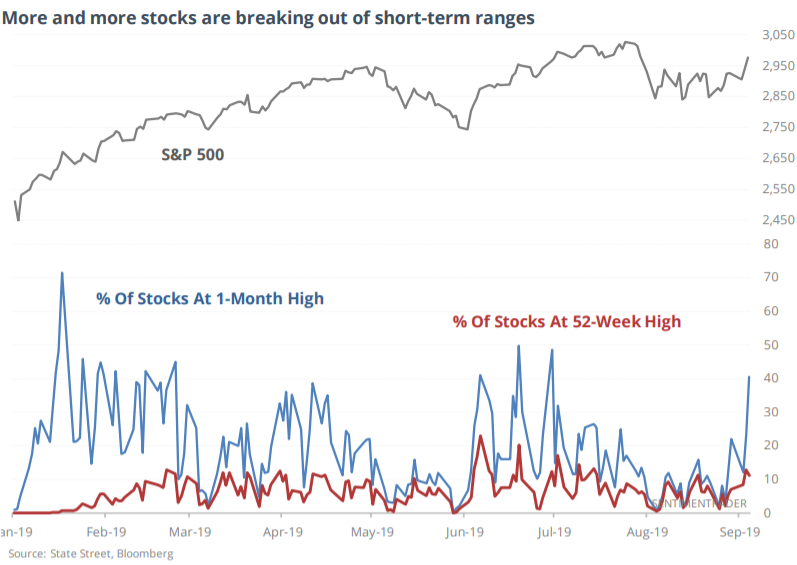
While the sample size is small, this was mostly good for stocks over the next 3-12 months, and the risk:reward ratio was decent.
Meanwhile, semiconductors continue to outperform the S&P 500, with the Semiconductor:S&P ratio going up.
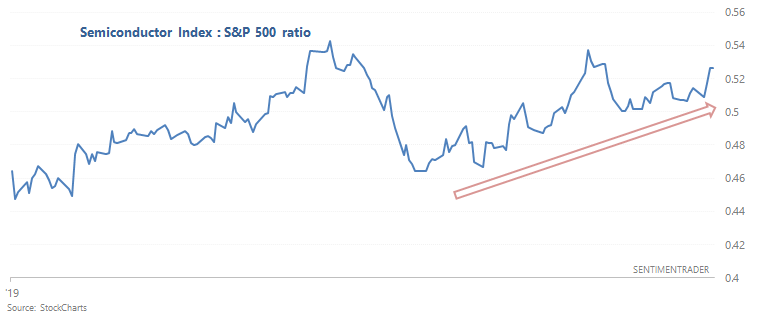
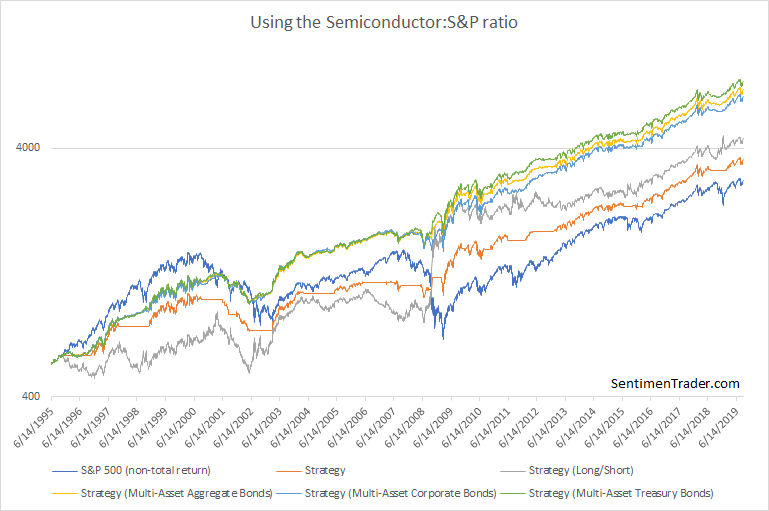
In general, it's better to buy stocks when the Semiconductor:S&P ratio is trending up (e.g. right now) than when the ratio is trending down. The following charts looks at what happens if you buy and hold the S&P when the Semiconductor:S&P ratio is above its 200 dma, otherwise SELL. You can do 1 of 5 things when you SELL:
- Shift into 100% cash
- Short the S&P 500 (buy and inverse ETF)
- Shift to the Bloomberg Barclays U.S. Aggregate Bond Index
- Shift to the Bloomberg Barclays U.S. Corporate Bond Index
- Shift to the Bloomberg Barclays U.S. Treasury Bond Index
Small caps
While the S&P 500, Dow, and NASDAQ rally towards all-time highs, small caps (Russell 2000) continue to lag significantly. As of Thursday's surge, the S&P, Dow, and NASDAQ were all able to recover their 50 dma and 200 dma (2 popular moving averages), whereas the Russell is still beneath both moving averages.
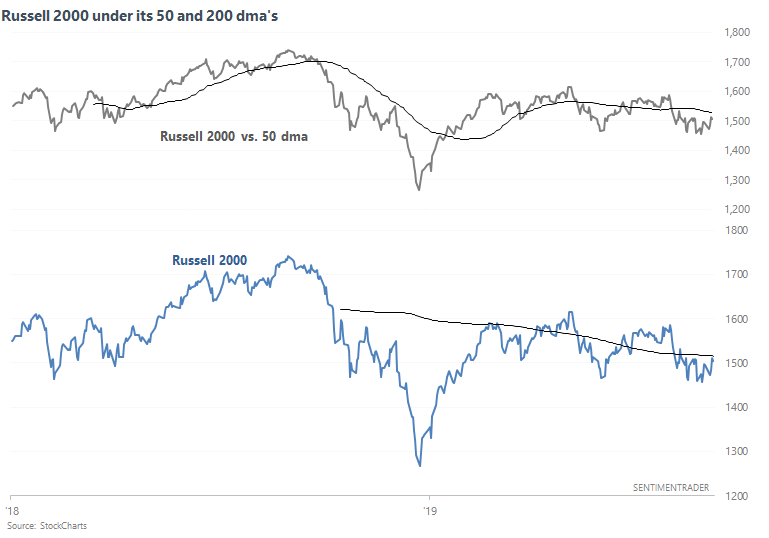
We've looked at small caps' underperformance in the past, and usually concluded that while this is a slight worry (it did happen before the 2007 and 2000 tops), it isn't a disastrous warning sign. There are plenty of false bearish signals.
The following table looks at what happens next to the S&P when the Russell is below its 50 dma and 200 dma, while the S&P, Dow, and NASDAQ are all above these key moving averages.
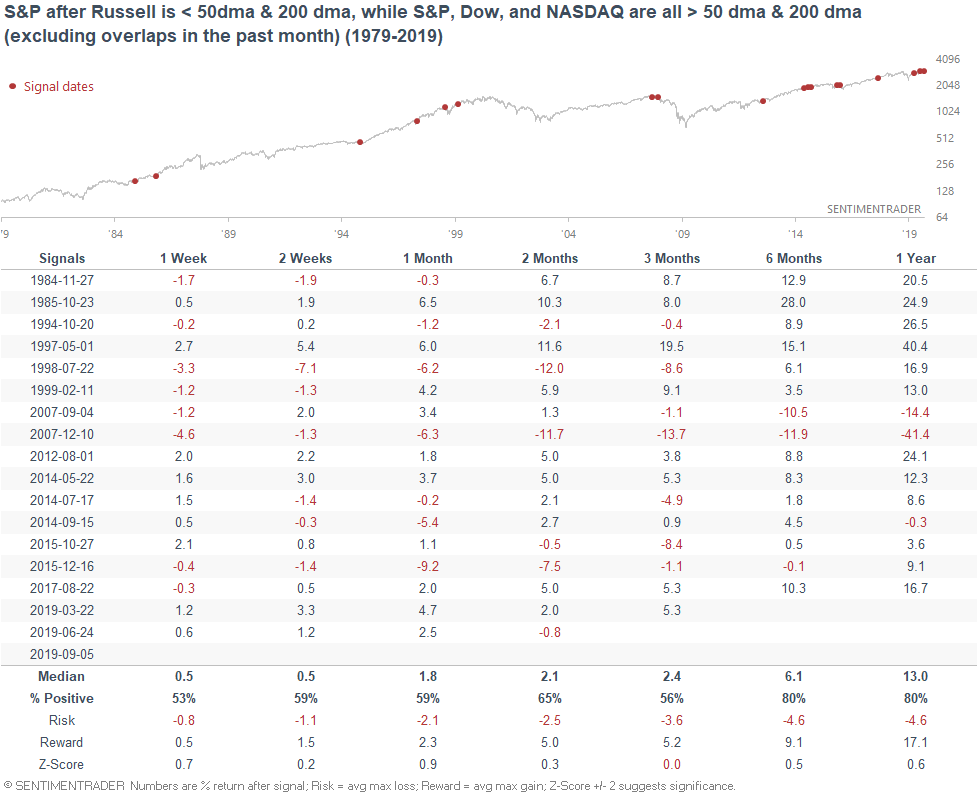
Forward returns are mixed. This did happen before the 2000 top, 2007 top, and early-2016 selloff, but there were plenty of other bullish dates in here as well.
Breadth
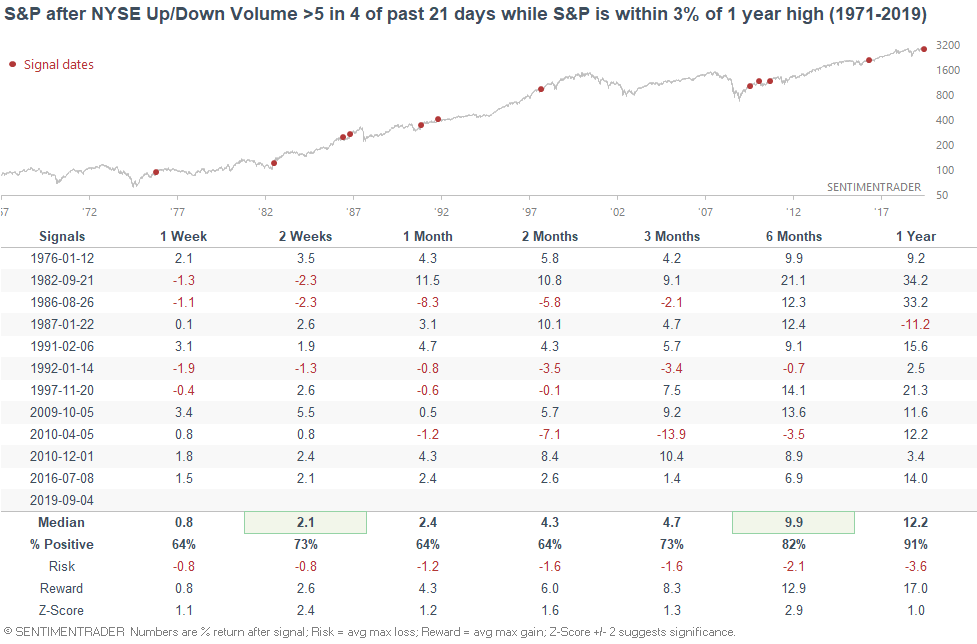
As of Wednesday, there had been four days of 5-to-1 surges over the past month (5x more NYSE Up Volume than NYSE Down Volume). This is rare when the S&P is so close to an all-time high. In other words, volatility is high, but it's going in the right direction (upwards).
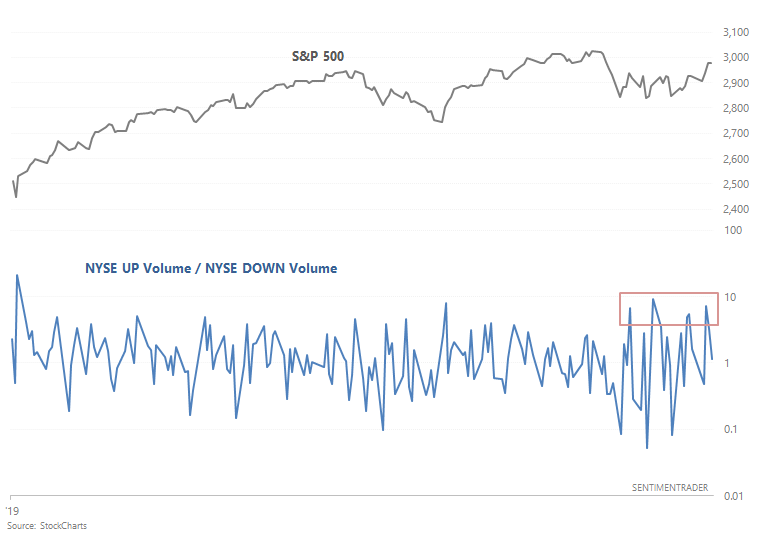
When this happened in the past, the S&P often did well over the next 6-12 months.
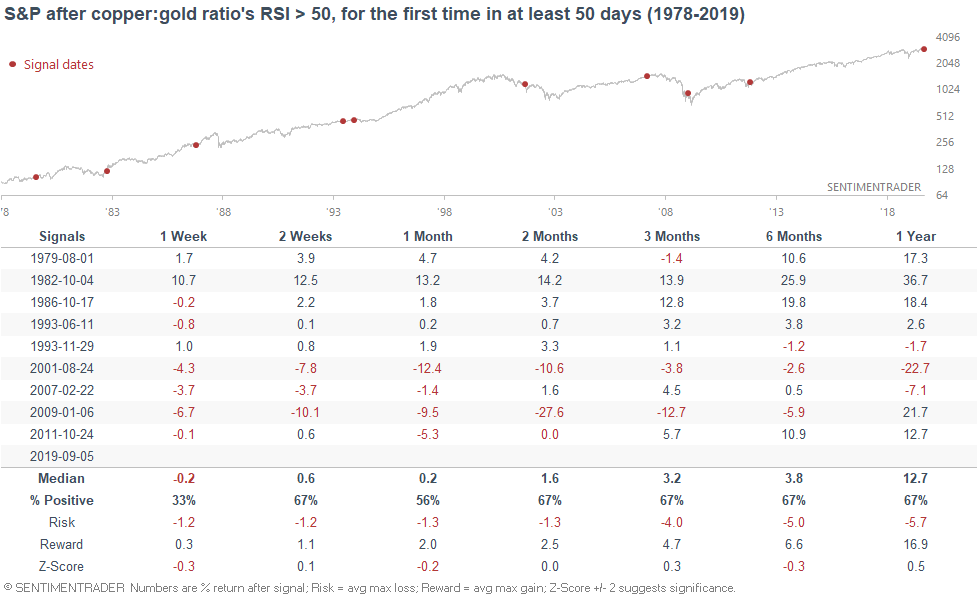
Copper:gold
As Bloomberg noted, copper has finally started to outperform gold after underperforming for a long time. The copper:gold ratio is watched because copper is often seen as a market-based economic indicator whereas gold is often seen as a safe haven. So when this ratio falls, it implies that the economy is not doing well vs. the demand for a safe haven.
Although RSI is often used as a contrarian indicator, it can also be used as a momentum/trend indicator. I.e. readings above 50 indicate that the market is in an uptrend, whereas readings below 50 indicate that the market is in a downtrend.
After being below 50 for 88 consecutive days (long downtrend), the copper:gold ratio's 14 day RSI is finally above 50.
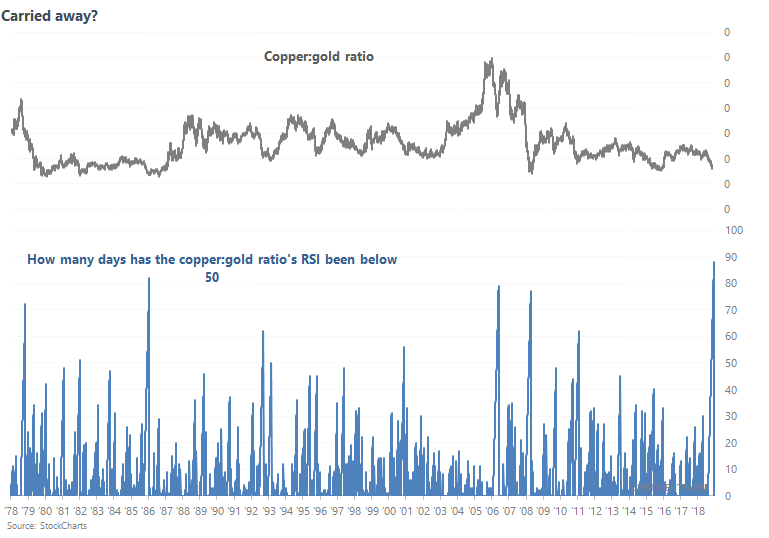
When similar streaks ended in the past, the S&P sometimes performed poorly over the next month, particularly over the past 20 years. As I said, the short term is hard to predict right now. There is no strong edge in either direction.
Sentiment
Most sentiment indicators are not registering an extreme right now (hard to have an extreme with the S&P so close to an ATH), but the AAII survey remains pessimistic. As Jason pointed out on Thursday, the 5 week average of AAII % Bulls is still very low.
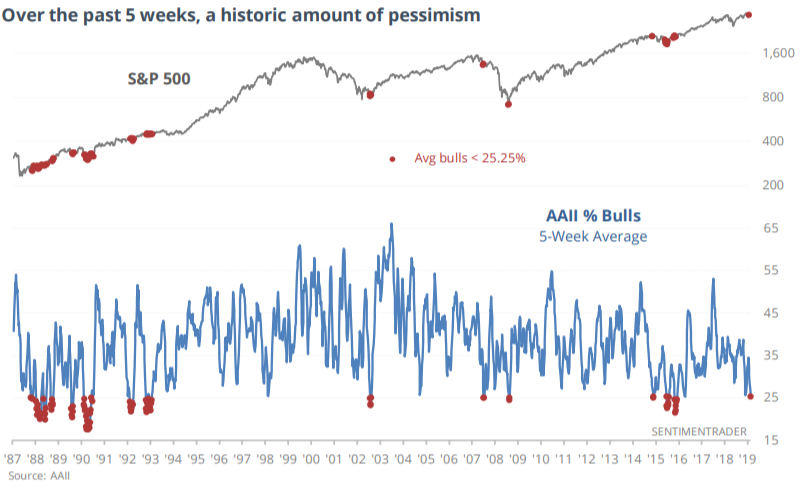
This was mostly positive for stocks over the next 3 months.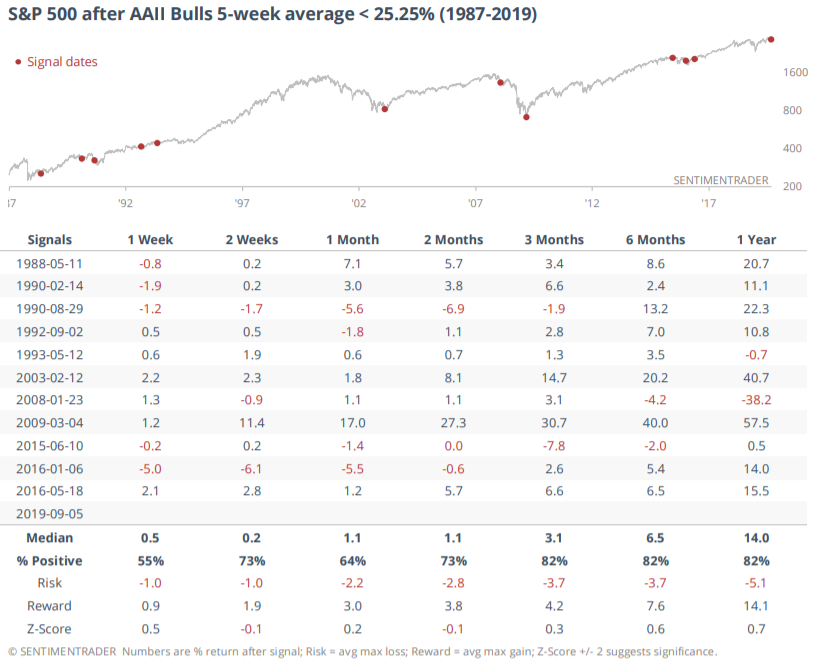
Momentum
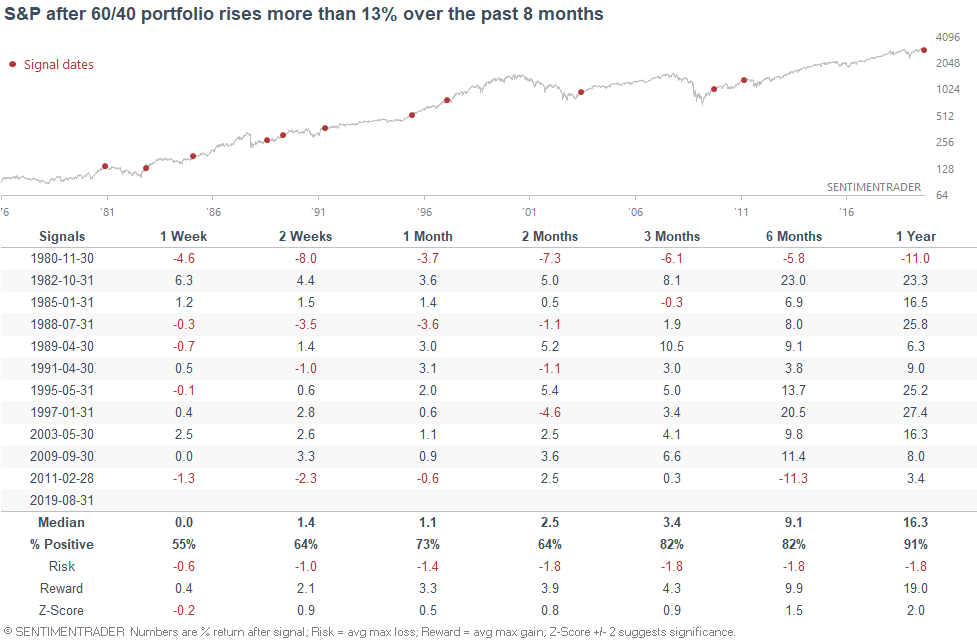
Despite the stock market's weakness in August, a 60/40 portfolio maintained its value due to a surge in bonds.
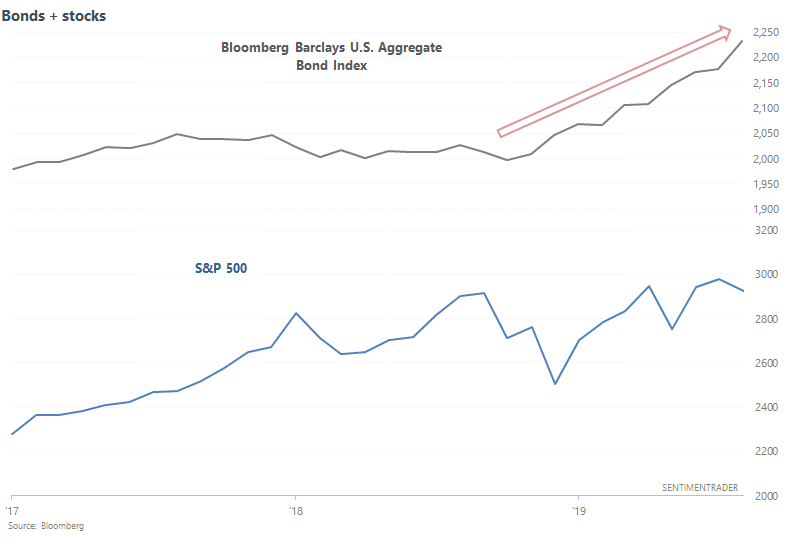 A portfolio that's split 60/40 between the S&P 500 and the Bloomberg Barclays U.S. Aggregate Bond Index (rebalanced monthly) is up more than 13% over the past 8 months. From a momentum perspective, this was mostly bullish for the stock market over the next year.
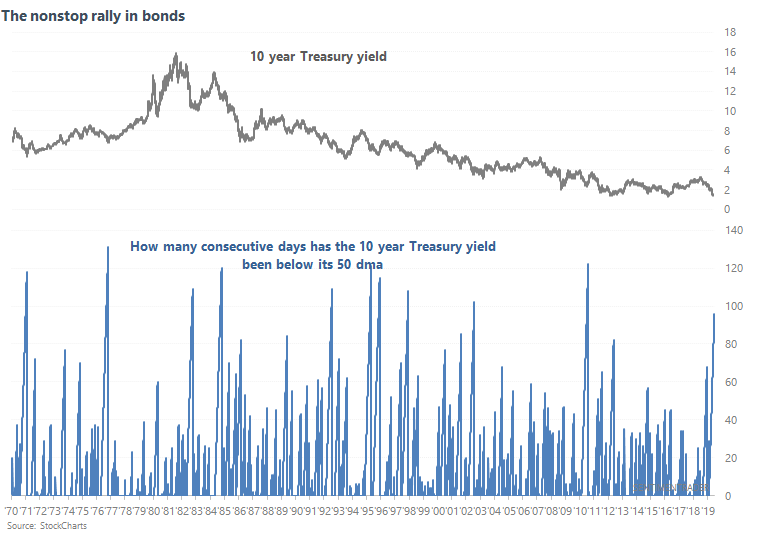
Bonds
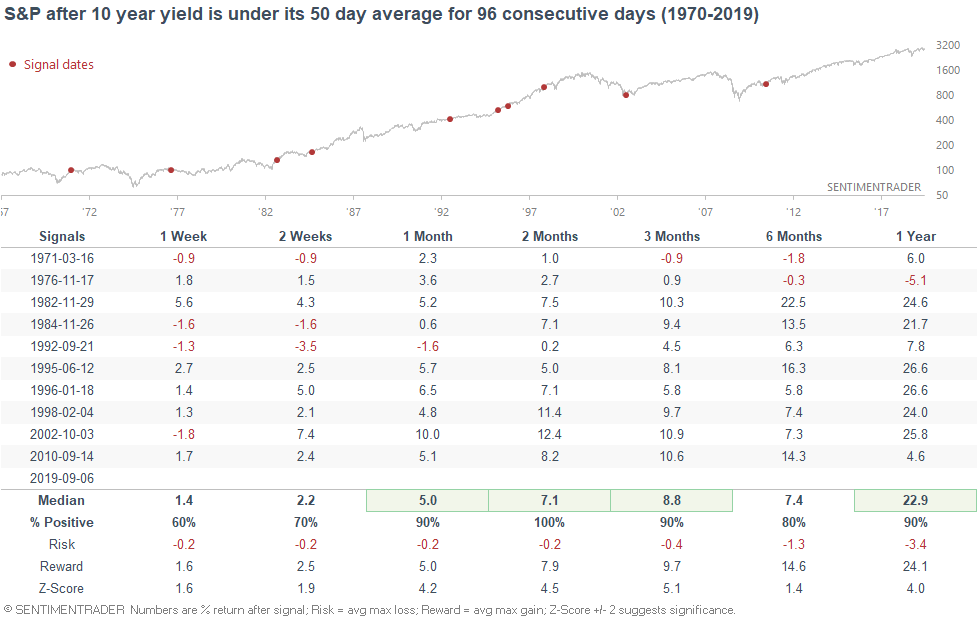
Speaking of the surge in bonds, bond yields have been unable to maintain a sizable rally. As a result, the 10 year Treasury yield has been below its 50 dma for 96 consecutive years.
This is an incredibly long streak, and was mostly bullish for stocks on a 2+ month basis.
To recap
- Long term risk:reward doesn’t favor bulls. Valuations are high, but valuations can remain high for years.
- Fundamentals (6-12 months): still bullish because there is no significant U.S. macro deterioration, but this could change IF macro data deteriorates significantly over the next few months
- Technicals (3-6 months): mostly bullish
- Technicals (1-2 months): no clear edge in either direction.
*Economic Data charts (from "Fundamentals")
Housing Starts:
Building Permits:

New Home Sales:
ISM Manufacturing PMI:
10 year - 3 month yield curve:

Initial Claims:
Continued Claims:
Heavy Truck Sales:
Popular valuation indicator Shiller P/E:
Here's an interesting chart from Guggenheim which demonstrates the relationship between the size of a recession-driven bear market and the stock market's valuations before the bear market:
