Markets' red-headed stepchild

Certain rivalries in the financial markets sort of take on a life of their own: stocks vs. bonds, bold vs. silver, growth versus value and of course large-cap vs. small-cap.
Large vs. small is one that a lot of investors pay close attention to, and understandably so. It is sort of the David vs. Goliath of the stock market. Some investors look to large-cap stocks as a known quantity – big, established companies who generally speaking, can be relied upon to generate steady, if not spectacular growth. Others are pulled toward small-cap stocks, often in hopes of finding the "next Apple" or Microsoft, etc. And in the midst of this never-ending debate, smack dab in the middle lies a potentially significant opportunity that many investors rarely if ever consider – the mid-cap space.
I am fond of saying that success in the markets typically comes from finding an edge and then exploiting it. While the majority analyze large and small caps with a fine-tooth comb, a much smaller slice of the investment population ever gives mid-caps much consideration as an asset class.
Is this a mistake?
The S&P 400 MidCap Index was first calculated in January 1981, so we will test from January 1981 through December 2020, a period of fully 40 years. We will use total monthly return data for the following indexes as a proxy for each asset class:
- Mid-cap: S&P 400 MidCap Index
- Large-cap: S&P 500 Index
- Small-cap: Russell 2000 Index
Our first test involves simply buying and holding each index over the fully 40-year period. The chart below displays the cumulative % +(-) for each index from 1981 through 2020.
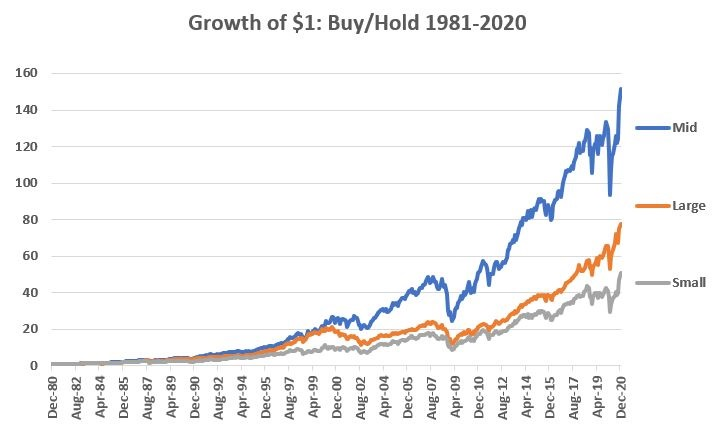
There is little question as to which index performed the best overall on a buy-and-hold basis over the past 40 years.
But looking at rolling 5-year periods, mid-cap stocks are showing one of the most extreme divergences from large-caps on record.
What else we're looking at
- A more thorough look at mid-cap stocks versus small- and large-cap
- What an extreme 5-year rolling divergence might mean, and why
- Our Weekly Wrap shows an argument between market environment and sentiment
- What happens in XLE and XOP when oil rig counts do what they've done over the past 6 months

| Stat Box Last week, the smallest of options traders bought to open 22.1 million equity and ETF call option contracts, a record amount dating back more than 20 years. They spent $11.3 billion on those speculative upside bets, just under the record from the end of August - beginning of September. |
Sentiment from other perspectives
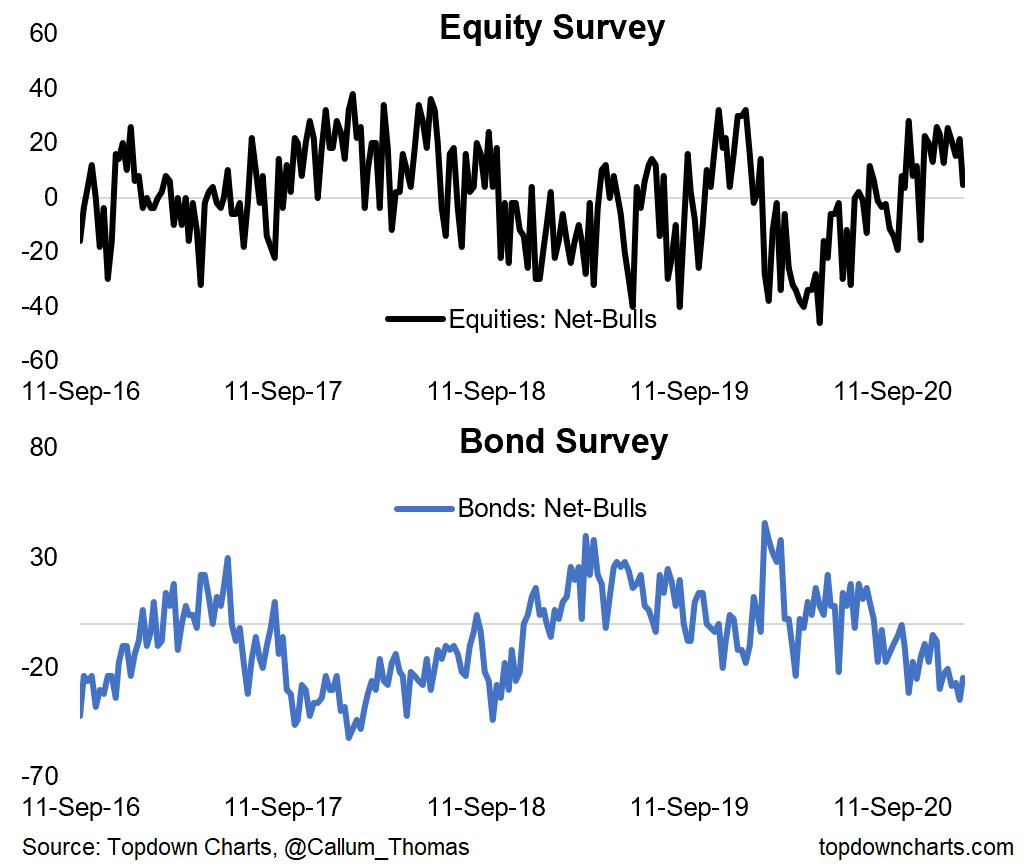
People still mostly believe stocks = good and bonds = bad. Source: Topdown Charts
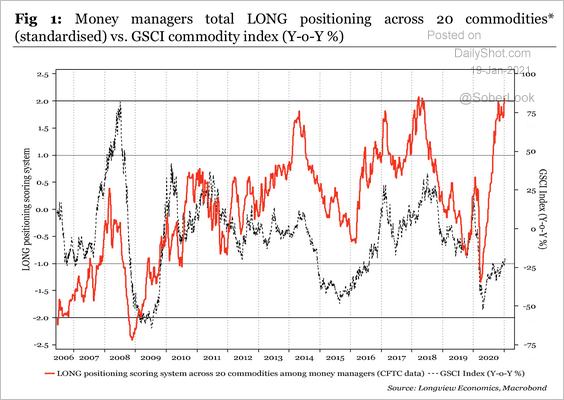
Where else are investors optimistic, besides stocks? Commodities! It's been a long while since we've been able to say that. Money managers, for one, are betting heavily that "stuff" will continue to rally. Source: Longview Economics via Daily Shot
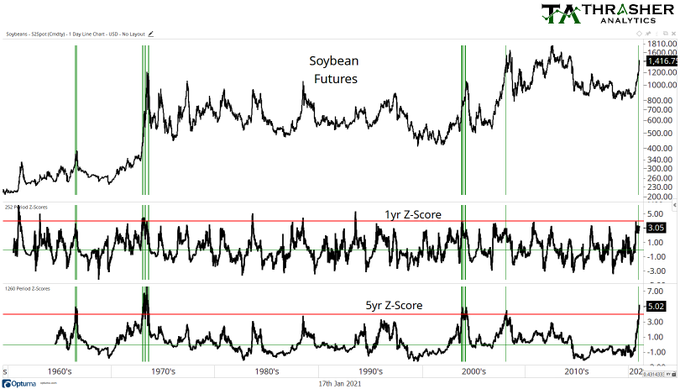
Futures traders tend to be trend-followers, and those commodities trends have been something. Comparing their current move to historical norms, they're well outside the normal range. Source: Thrasher Analytics