
McClellan indicators show negative momentum is easing

During bear markets, the best returns are typically found by buying into bouts of periodic panic and then getting out on violent snapbacks. The trouble with that strategy is several-fold, including that most people are not quick-fingered traders, it's a gut-wrenching thing to do, and it doesn't always work. Witness energy stocks from a couple of weeks ago.
Those looking for a less ulcer-inducing strategy usually wait for some green shoots - evidence that markets are moving from bad to less bad. That helps avoid the "extreme can be more extreme" scenarios but it also means markets have already rebounded, and short-term volatility (and losses) are more likely, even while longer-term gains should become more consistent.
So, investors have been looking for signs that the panic has run its course and we've neared an inflection point. So far this month, we've seen selling pressure so intense that it rivals or exceeds anything in the past 60 years. Now, there has been a thaw.
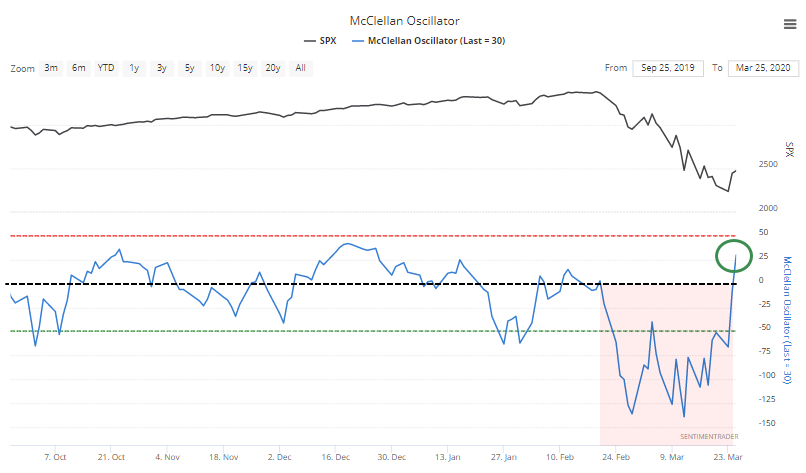
For the first time in over a month, the McClellan Oscillator has turned positive.
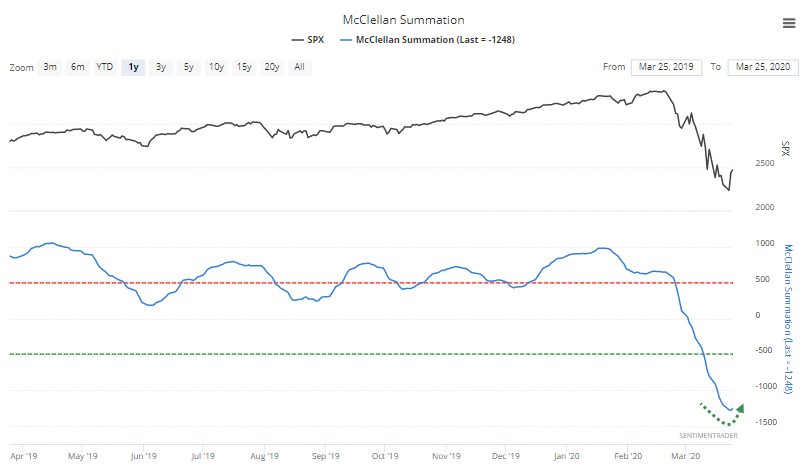
You have to squint to see it, but the positive Oscillator means the long-term Summation Index has curled higher after hitting an extremely low value.
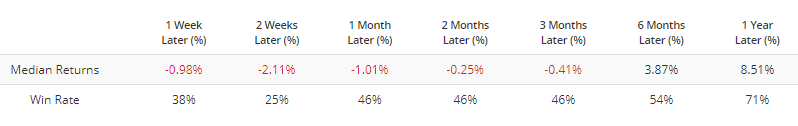
The Backtest Engine shows us that since 1962, there have been 24 times when the Summation Index has curled higher after falling below -1250. It's not a big surprise that short-term returns were bad, while longer-term ones were significantly better.
Some of those poor returns came during markets when breadth was very bad, but the indexes hadn't suffered heavy losses, unlike now. So if we stipulate that the S&P 500 must have lost at least 25% of its value at some point over the past couple of weeks, then we get the following.
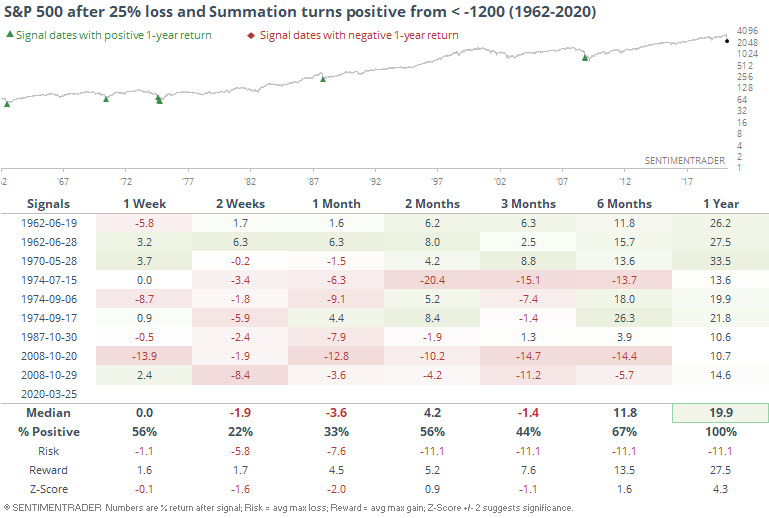
Shorter-term returns were still horrid, because this triggers after markets stage an initial rebound. And rebounds in bear markets tend to get hit by selling pressure as knife-catchers see a chance to get out.
But this also signified longer-term recoveries. When losses had been so bad, and breadth so horrid, these green shoots indicated that it was getting near a point when the final puke phase was either done or getting close.
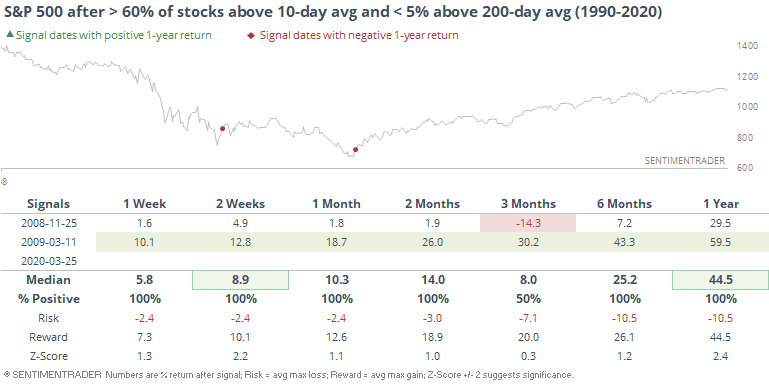
There has also been signs of a recovery in the percentage of stocks trading above their short-term moving averages. It jumped above 60% by Wednesday, even though the percentage trading above their long-term 200-day averages hasn't budged and remains extremely low.
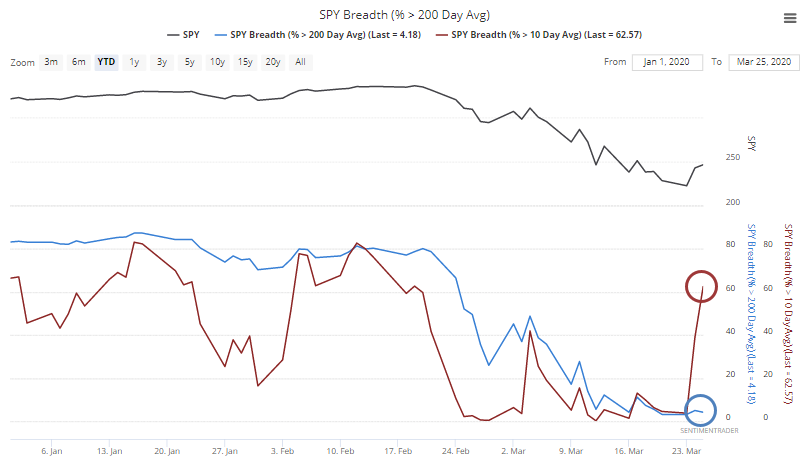
That's only happened twice since 1990, in November 2008 and March 2009.
The massive up volume days on Monday and Tuesday should go a ways to furthering that point and may limit the shorter-term losses that some of the previous signals witnessed.