Mixed price action
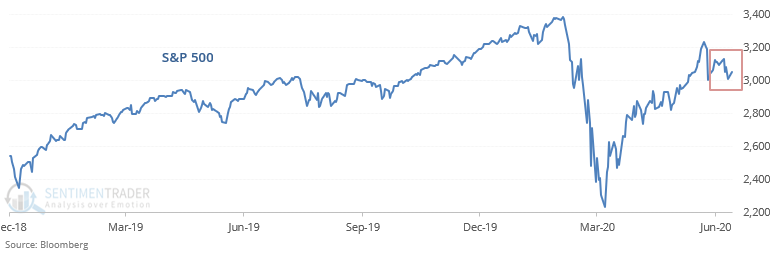
The U.S. stock market has gone through a period of calm after experiencing extreme volatility. The S&P has gone nowhere over the past 12 days, swinging in a relatively narrow range (at least compared to the type of movements we saw over the past few months):
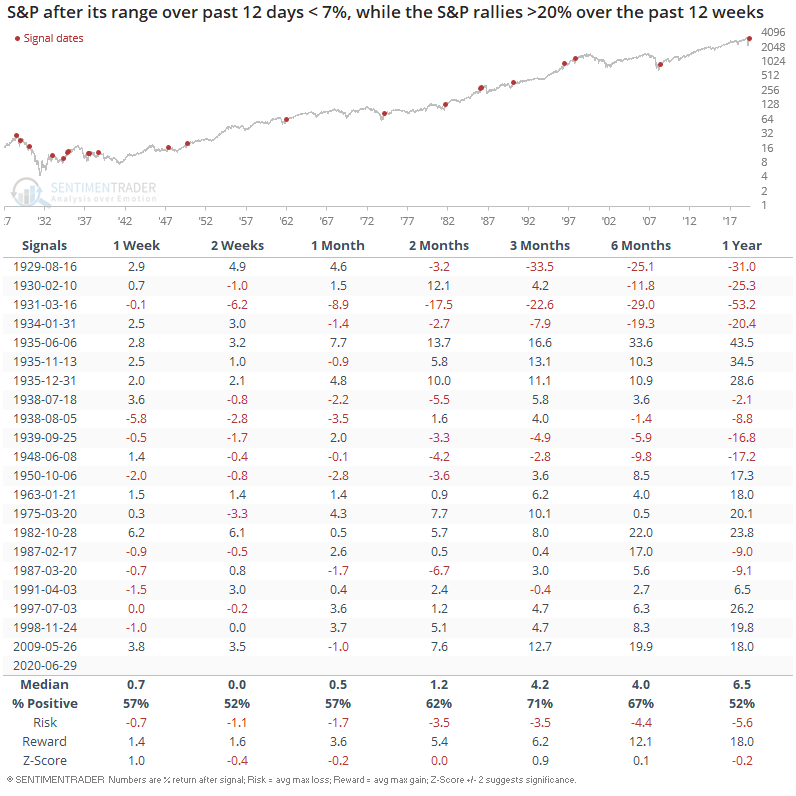
This could potentially be interpreted as the S&P's momentum losing steam, but historically, this wasn't always the case. When the S&P's daily CLOSE over the past 12 days swung within a 7% range, while the S&P rallied at least 20% over the past 12 weeks, this wasn't a consistently short term bullish or bearish factor for the stock market.
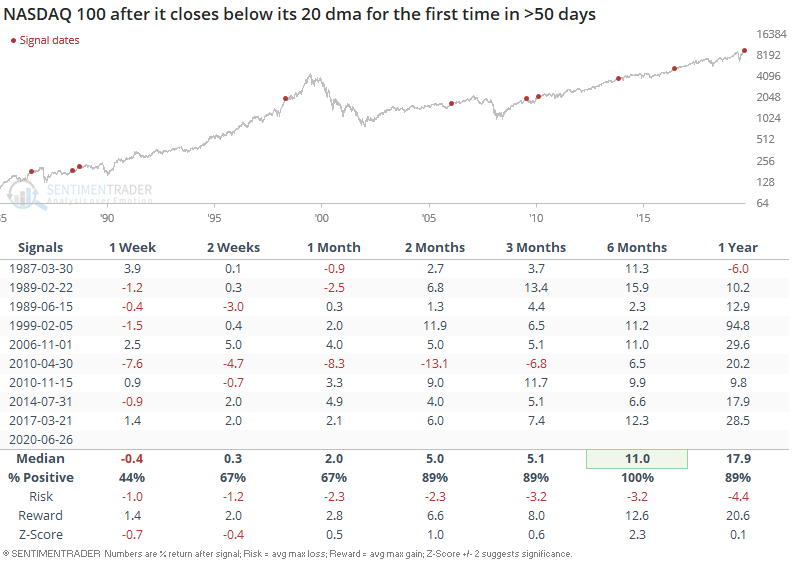
The stock market's dip on Friday pushed the NASDAQ 100 below its 20 day moving average (short term uptrend) for the first time in 58 days, ending one of the longest streaks in history:
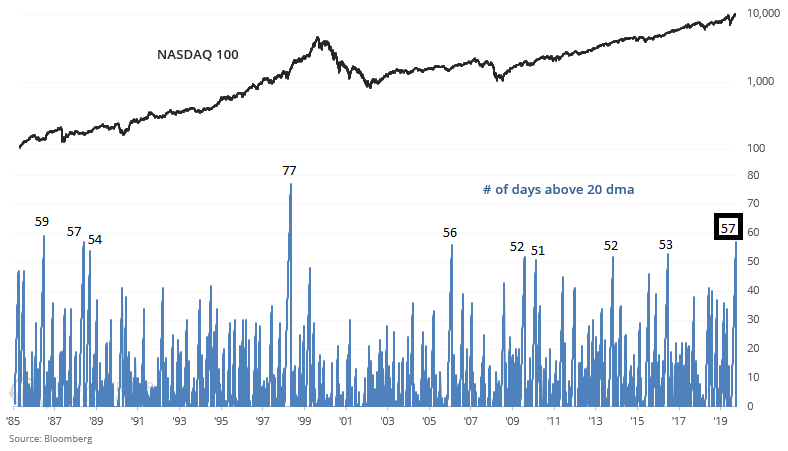
Historically, this was a minor bearish factor for tech stocks over the next 1-2 weeks, and such strong momentum always led to more gains for the NASDAQ 100 over the past 6-12 months:
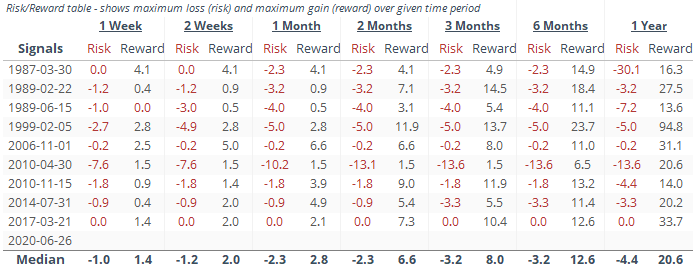
Here's the risk:reward table:
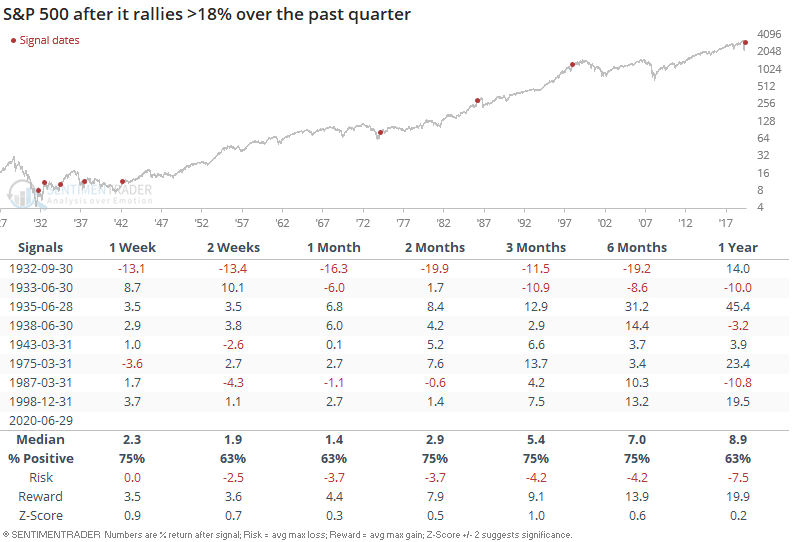
And lastly, this quarter (Q2 2020) saw the S&P's largest quarterly gain in more than 2 decades. Investors have swung from panic selling in Q1 to panic buying in Q2.
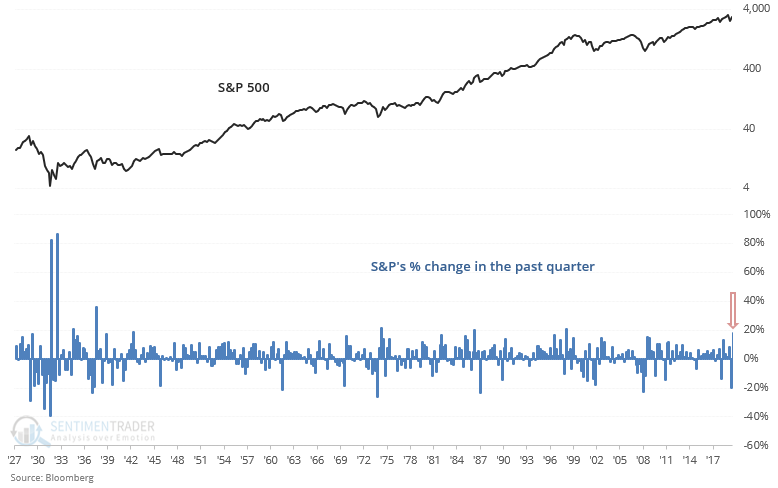
While it's tempting to think that large quarterly gains must mean revert, that wasn't always the case. Eventually there is a pullback/correction, but it's hard to pinpoint exactly where that pullback/correction begins.