
Modest internal Nasdaq selling triggers leveraged bets

The driving force of much of the rally over the past few months has been big tech stocks, driving the Nasdaq higher. We've seen that momentum there is wobbling, and yet traders continue to place record bets that it's going to continue higher.
One of the knocks against the idea that the Nasdaq has suffered damage is that there hasn't been any "real" selling pressure despite the drop over the past week. On the Nasdaq exchange, the 10-day Up Volume Ratio is below 50%, but there hasn't been any single day with heavily lopsided selling.
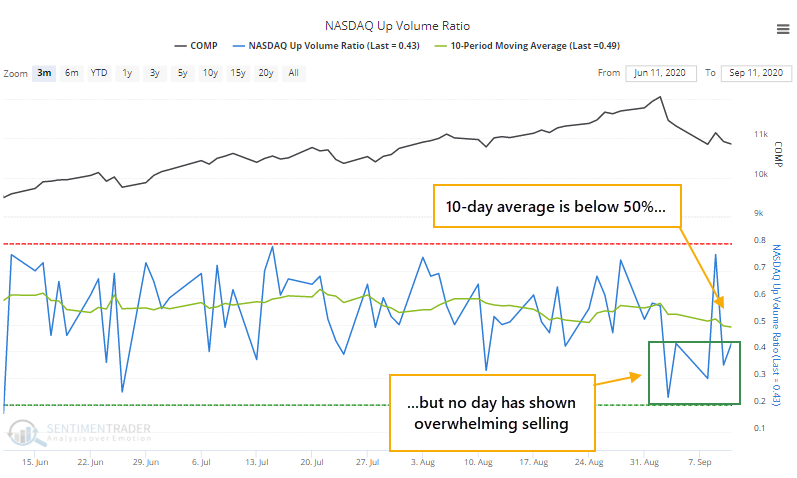
Because there haven't been any days with overwhelming selling, perhaps that calls into question that sentiment has truly soured. If we were seeing a regime change, then it makes sense to believe that we should see some days with a total get-me-out mentality. That hasn't happened.
Let's go back and look at every time the Nasdaq hit a 52-week high, then saw at least 6 days of selling with at least a 5% pullback. We'll separate out the instances between those with the best breadth and the worst, to see if it made any difference for forward returns.
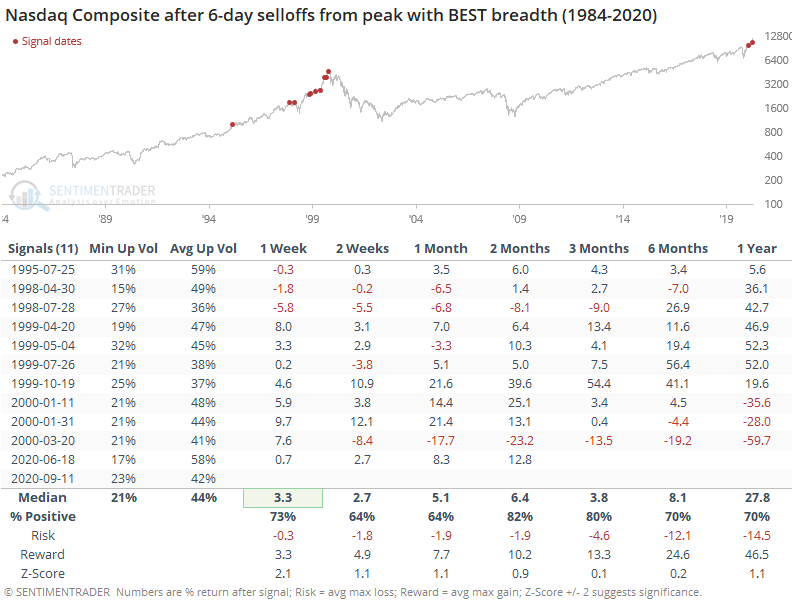
During the selloffs that held up best internally, the Up Volume Ratio averaged 44% during the 6-day selling sprees, with no day dropping below 21% on average. Forward returns were quite good, especially over the next 2-3 months. There were 2 big losses, 1998 and 2000, but most of them triggered during the last gasps of the bubble, and momentum carried the Nasdaq higher (for a while).
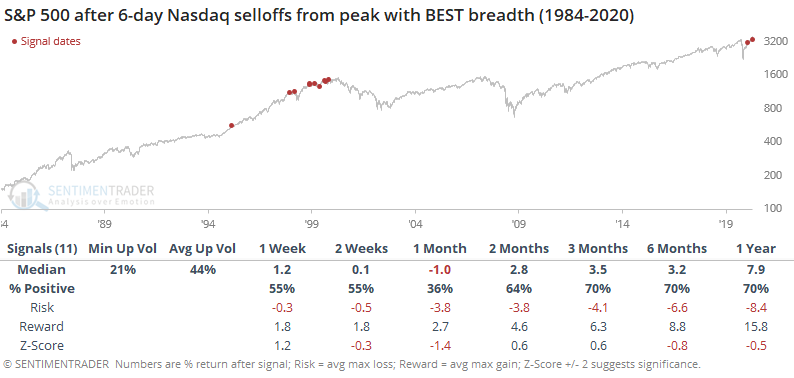
For the broader market, represented by the S&P 500, returns were worse over the shorter-term, with the index showing a positive return a month later only 36% of the time. It mostly recovered over the medium-term.
Contrast this to the 6-day selloffs with the worst selling pressure after the initial peak.
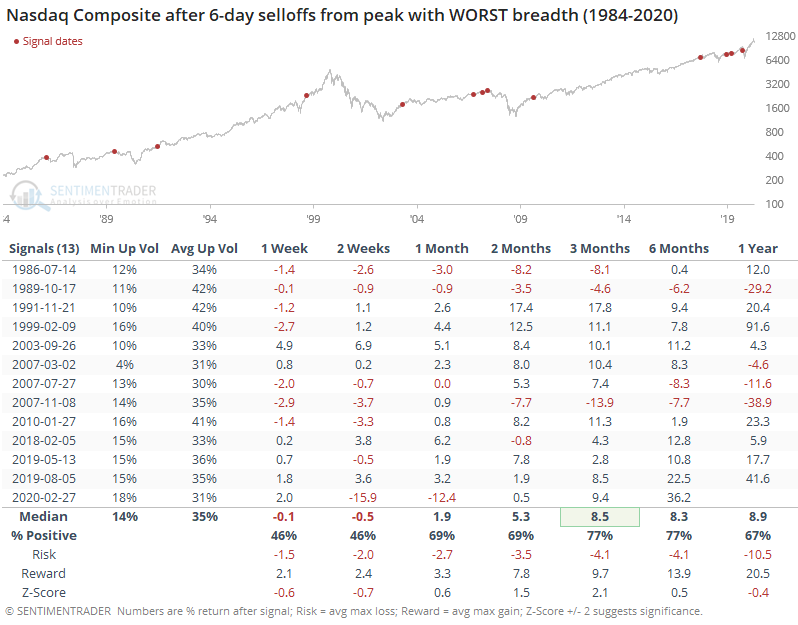
These showed worse performance shorter-term, but better relative returns over the next 3 months. Surprisingly, there wasn't a huge difference between them. Probably the most interesting data point is that the worst-breadth signals were spread out across the entire study period; the best-breadth ones were clustered in the year or two leading up to the peak of the bubble.
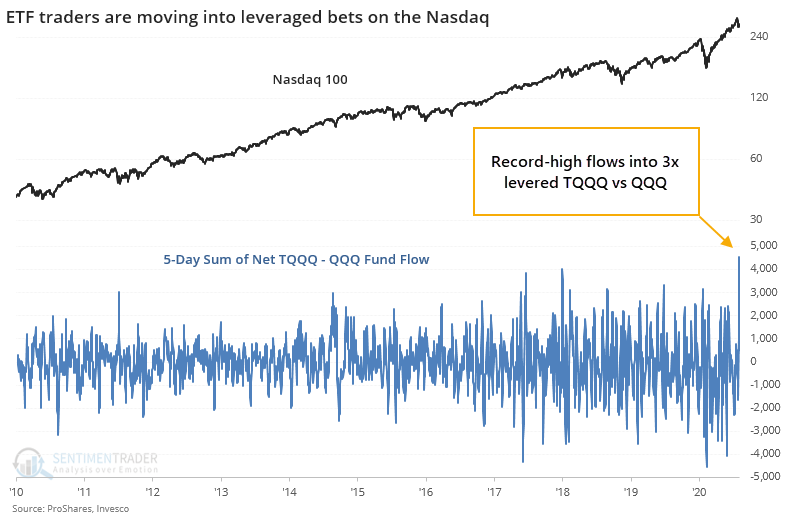
We saw earlier that despite catastrophic losses in some of the options on big tech stocks, traders are still diving in. Sarah Ponczek of Bloomberg notes that we can see this behavior in ETF flows as well. Go-to funds like QQQ are seeing outflows, while triple-leveraged long funds like TQQQ are seeing inflows.
The 5-day difference in flows between the two funds has never been greater.
Whether this actually means anything is questionable. Forward returns after other big relative inflows to TQQQ were mixed, with some short-term weakness but longer-term strength due to the study period being dominated by a bull market.
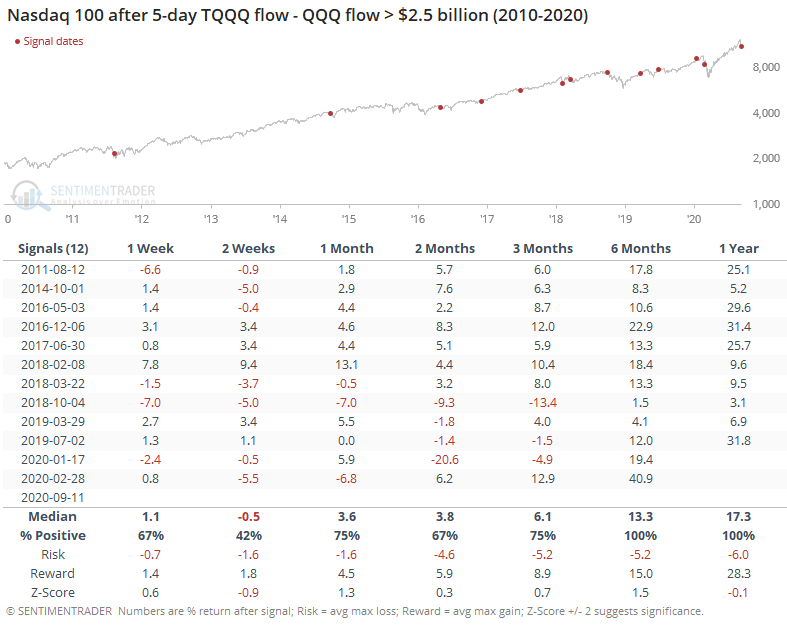
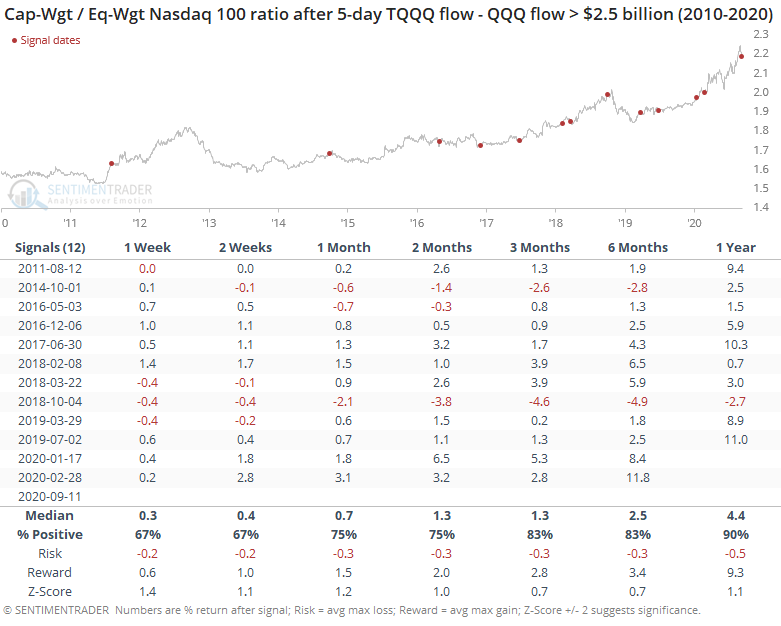
There was also no evidence that these infusions into leveraged funds preceded a drop in the big tech stocks dropping relative to the average tech stock.
During the brief selloff from the highs, we've seen modest evidence that something has changed, and the Nasdaq is likely to see further selling pressure. Pricks of a momentum bubble like the past week have had a slightly better record at preceding declines than sustained rebounds.
The fact that there has been no day with really intense selling appears to be a point in bulls' favor, and it's not canceled out by the rush into leveraged funds. The biggest knock against a sustained run to new highs remains the simple fact that so many options traders are betting on that very outcome, and markets rarely accommodate that kind of behavior for long.