Monday Color - New Highs, Material Gain, Financials, Gold, Small Traders, 5 Straight

Here's what's piquing my interest so far today.
High-Light
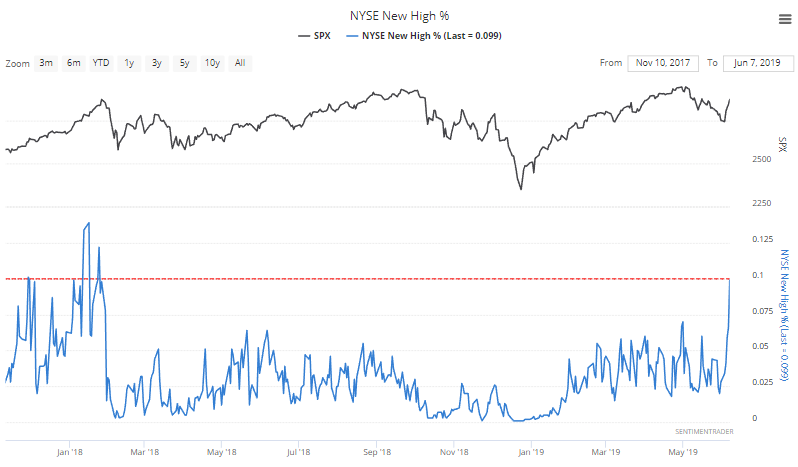
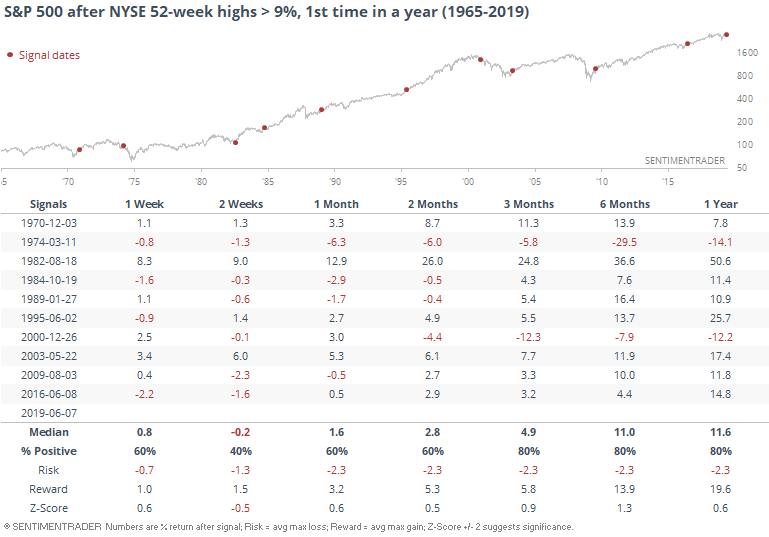
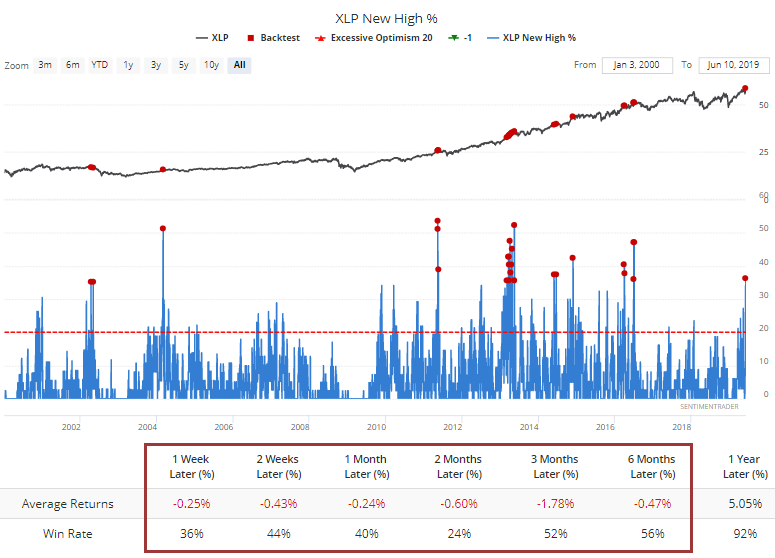
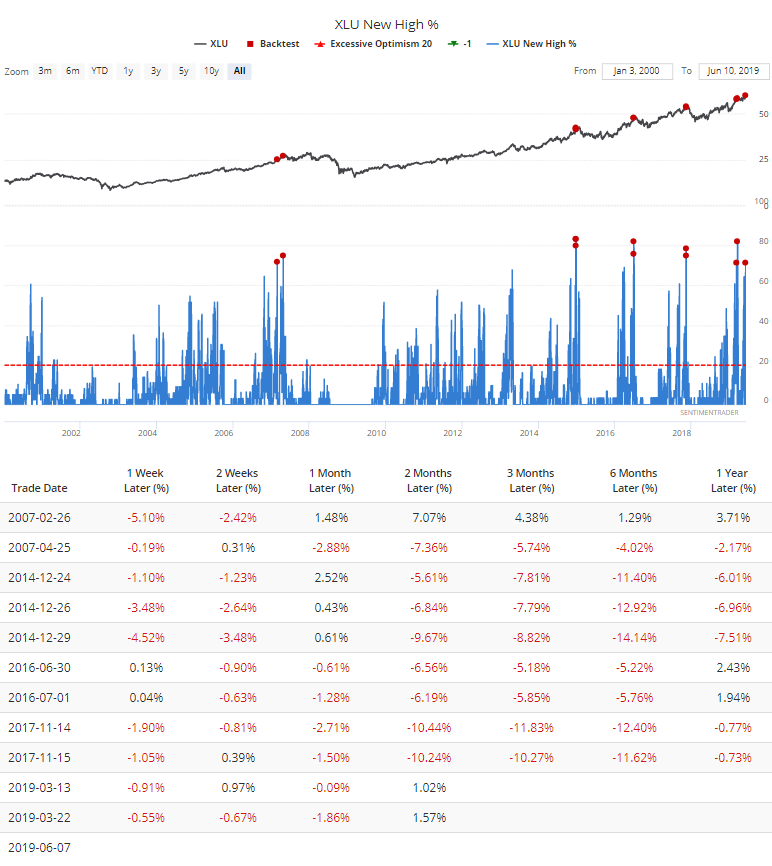
One of the most notable developments of the rally to end last week was the expanding number of securities that erased their May pullbacks. Nearly 10% of issues on the NYSE reached a 52-week high on Friday, the most since January 2018.
Historically, there have a lot more days with many more issues hitting new highs, but still.
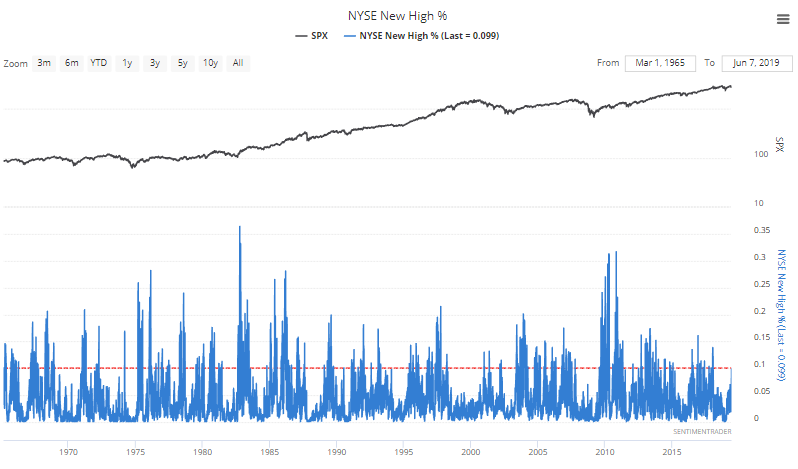
When more than 9% of securities hit a new high, and that's the most in at least a year, future returns were good once we got beyond the first couple of weeks. There were big failures in 1974 and 2000, which hit almost immediately.
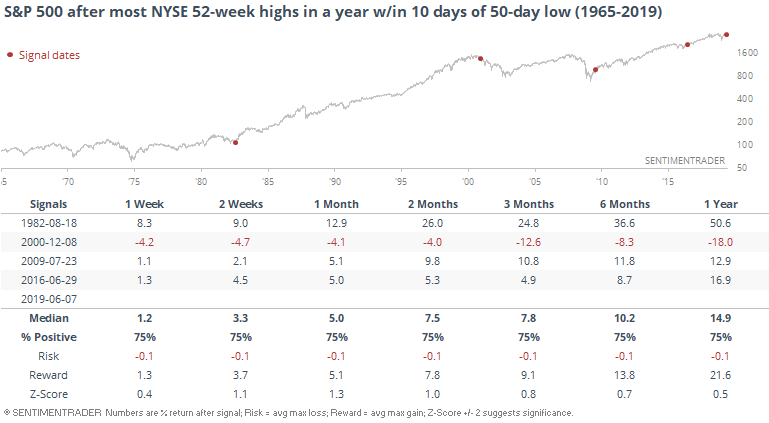
We look at the thrusty nature of the rally last week several different ways, with impressive results. When we get that kind of thrust off of at least a 50-day low, the gains tend to stick. Same for the surge in new highs, but the sample size is too tiny and one of them was a failure.
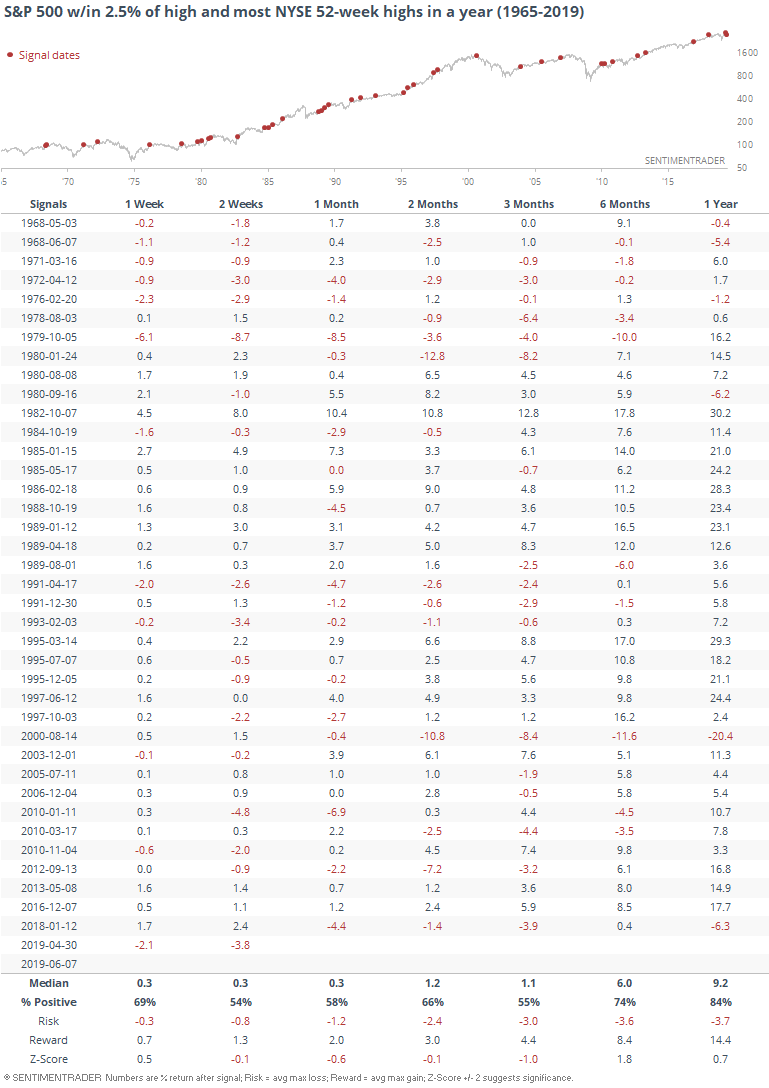
Even though the surge came off a 50-day low and the gains were steady and impressive, the S&P 500 was still more than 2% off its high. That sets up a possible positive divergence, or at least what looks like one on a chart. Divergences are inconsistent things, and tough to use to gauge imminent risk or reward.
The biggest failure in 1973 and '74 came when the S&P was well off its own high. By Friday, the index was within 2.5% of its peak. While that didn't mean the signal was perfect, and there were still some failures like 2000, future returns were still mostly good, especially longer-term.
Breadth Review
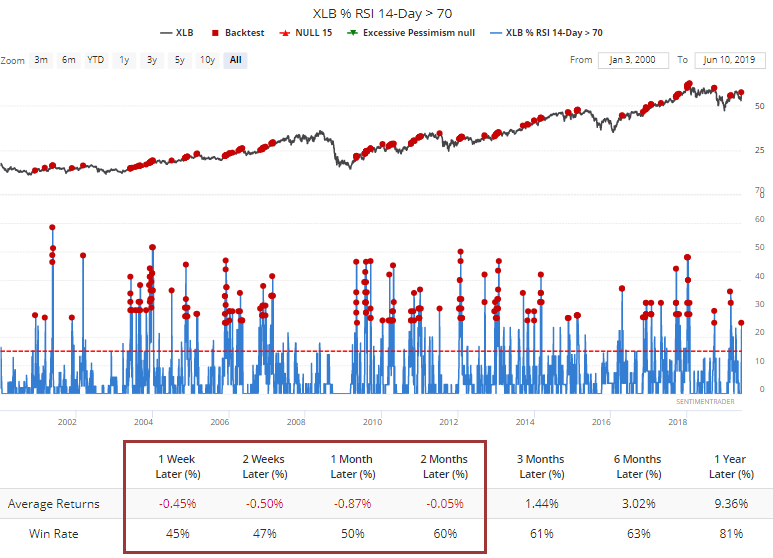
The jump was especially impressive in basic material stocks, and more than a quarter of them became overbought by Friday. That has preceded some weaker short-term returns.
The change in momentum was enough to jerk 40% of material stocks outside their upper volatility bands.
It was enough of a push in momentum among those stocks that the McClellan Oscillator jumped above +100.
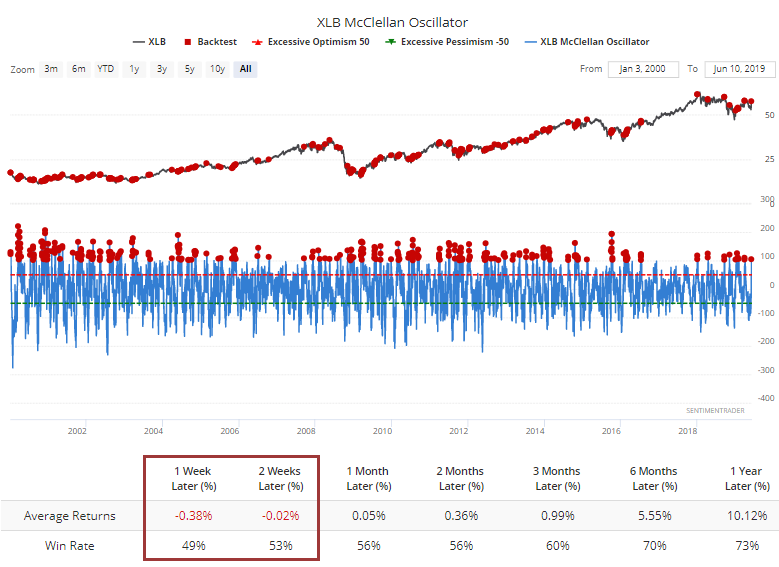
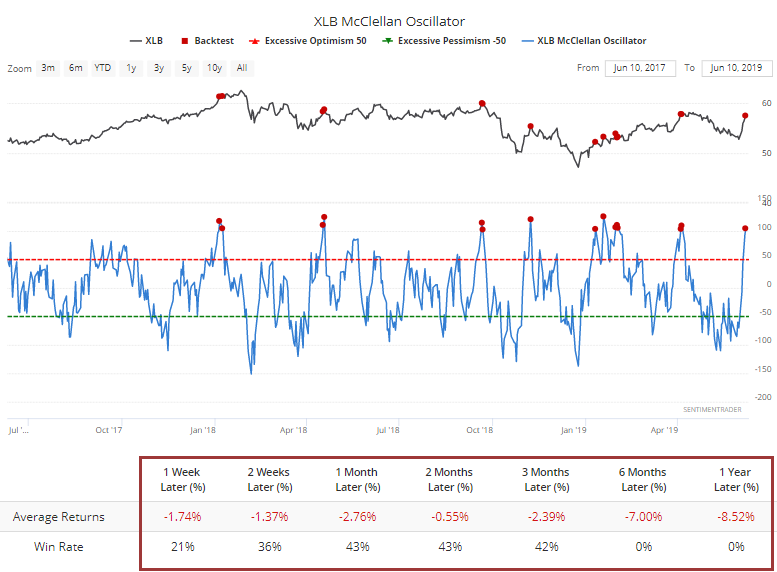
The recent trend needs to change for that sector, because over the past couple of years it has peaked almost immediately when the Oscillator got this high.
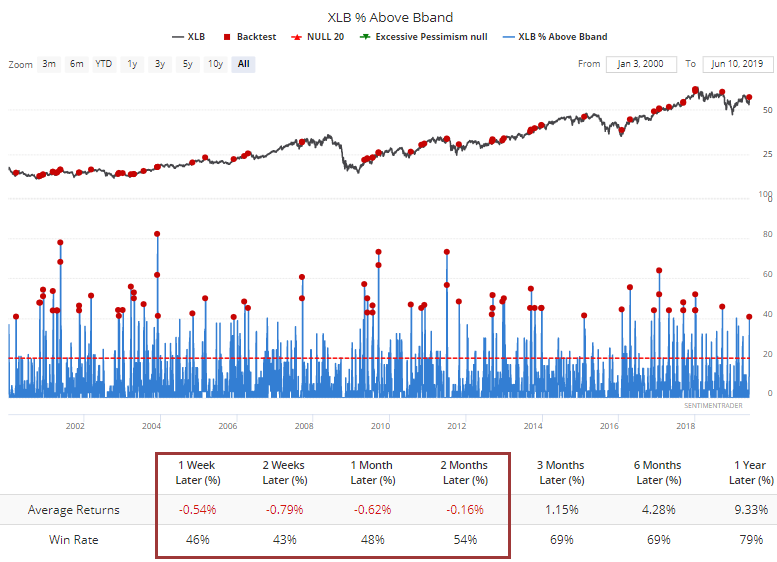
Consumer staples also enjoyed renewed vigor, and more than 35% of them hit a 52-week high. That's the most since 2016. While broad-based buying is assumed to be a universally good sign, there are times when too much of a good thing can be a bad thing, and defensive groups like staples tend to struggle after seeing this kind of buying interest.
Same for utilities, where more than 70% of stocks reached a new high. That has led to a sea of red before.
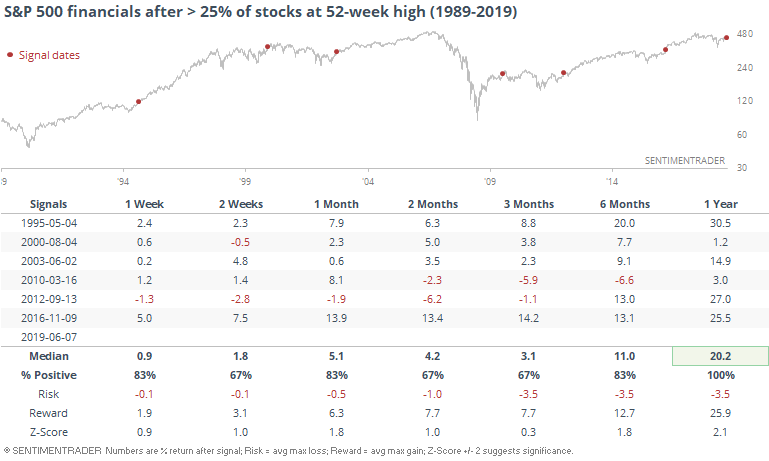
It was also a good week for financials, where more than a quarter of the stocks hit a new high. That, too, is the most in a year.
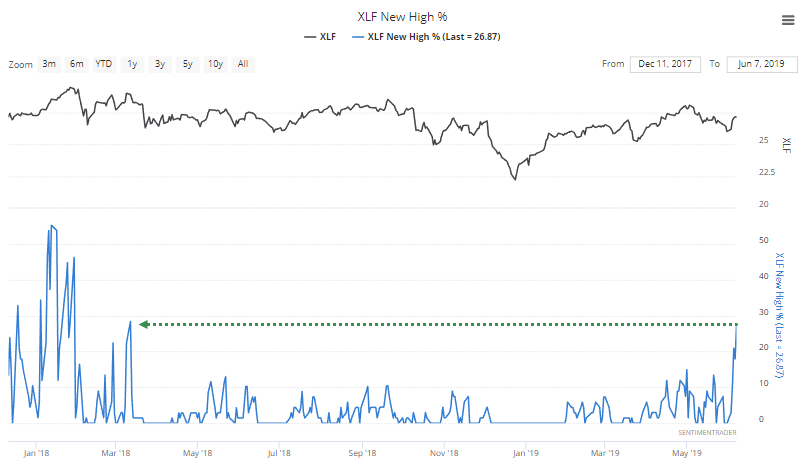
For that sector, it has been mostly a very good sign, with an excellent risk/reward ratio over the next year.
Heavy Metal
Like most other assets, gold had a good week last week. Hedgers took advantage, selling a heavy portion of their long position. Their long contracts dropped from more than 37% of all open interest to 27%.
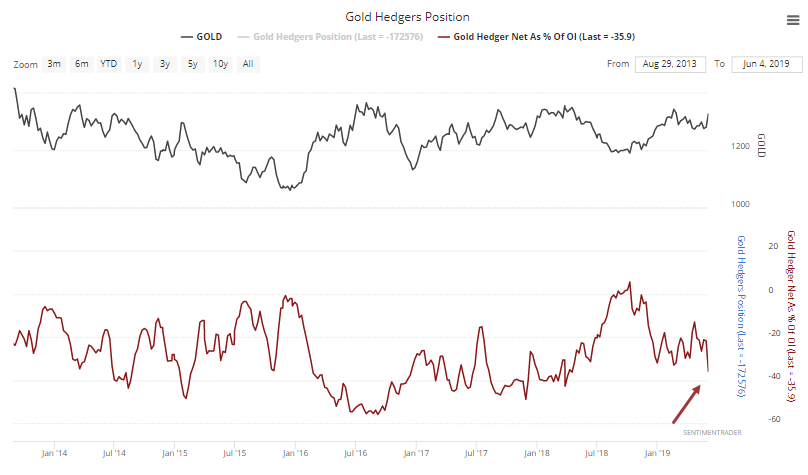
This is their most intense once-week liquidation of longs in more than a year.
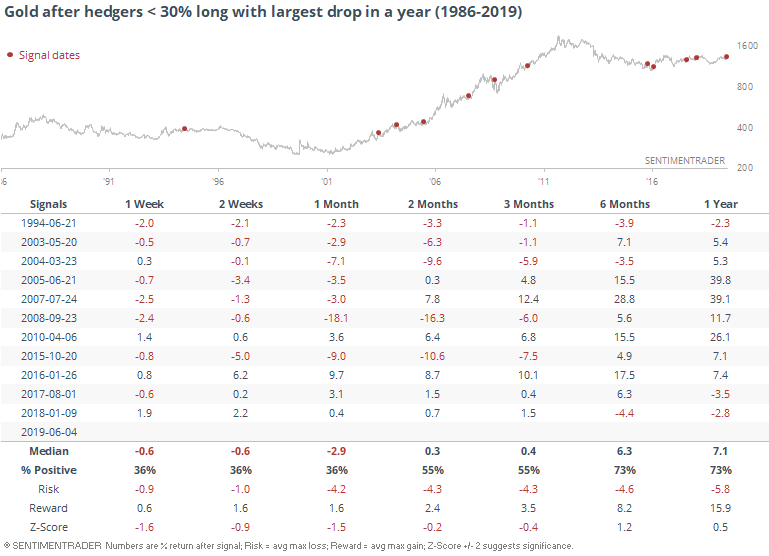
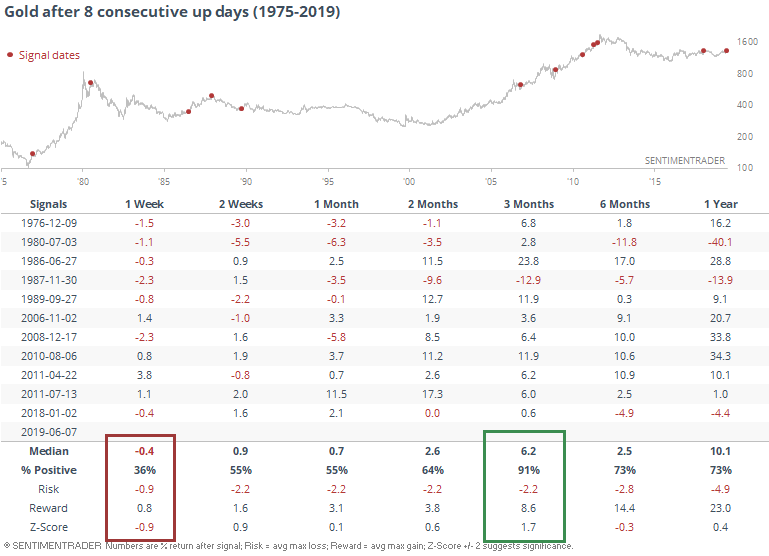
It's also been a little dicey in the short-term for the metal after it enjoyed 8 straight up days. Longer-term, though, it did well.
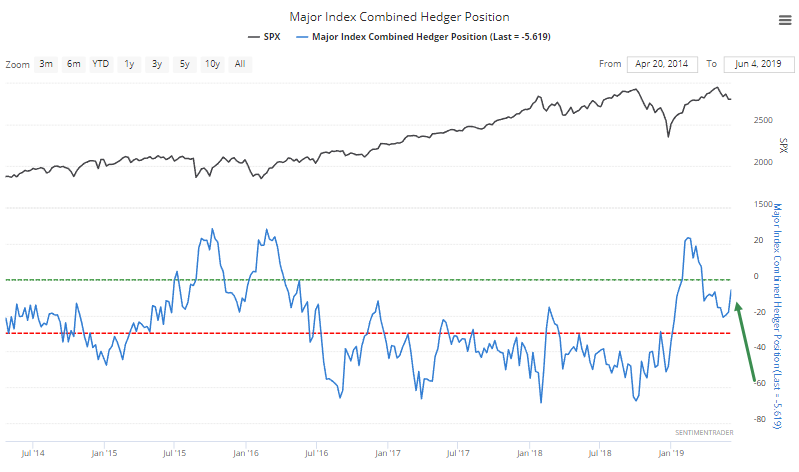
Buying Stocks
While "smart money" hedgers were selling gold, they were buying stocks, at least some of them. They reduced their net short in the major equity indexes by a large $13 billion. There is still no evidence of them wanting to sell aggressively.
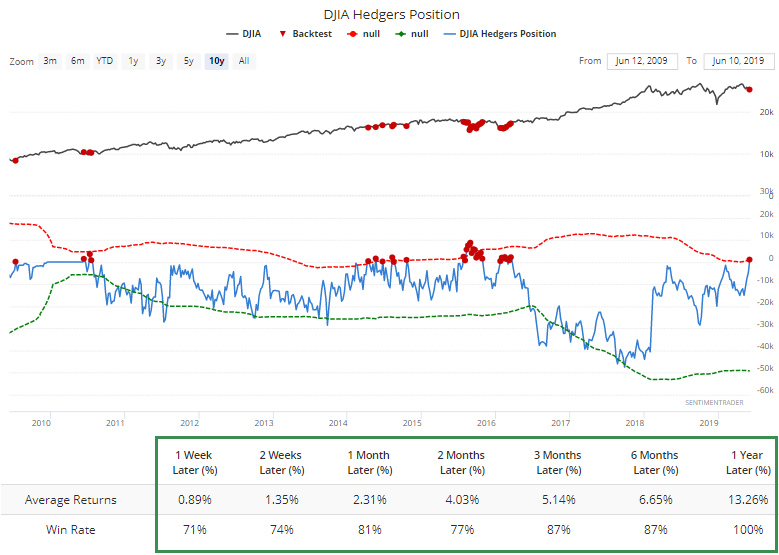
It was especially acute in the Dow Industrials, where they are once again net long. Granted, the last 10 years have been a mostly one-way street, but still, forward returns were very good when hedgers had this much confidence.
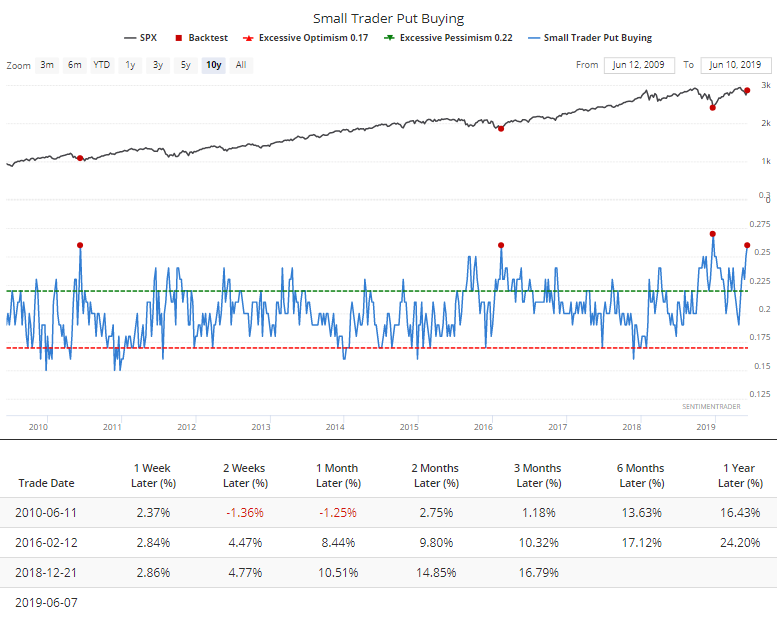
Small Traders Aren't
While hedgers were buying stocks, the smallest of options traders were picking up their hedges against it. They spent 25% of their options volume buying protective put options last week, one of the heaviest amounts since the financial crisis.
This has been a very impressive buy signal.
Prior to that, there was some volatility near the ends of the big bear markets.

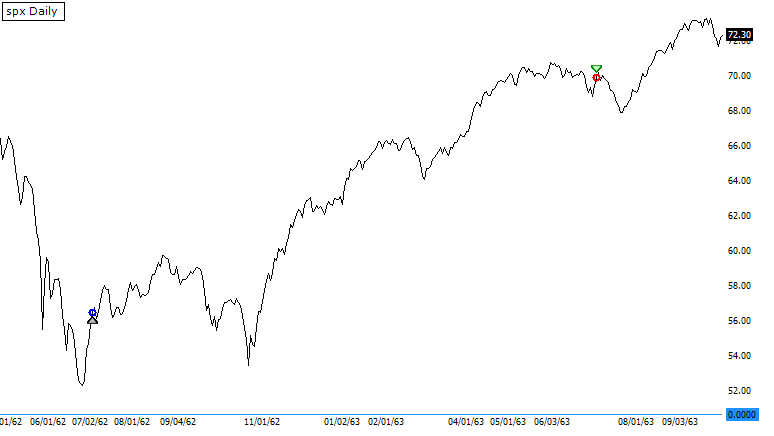
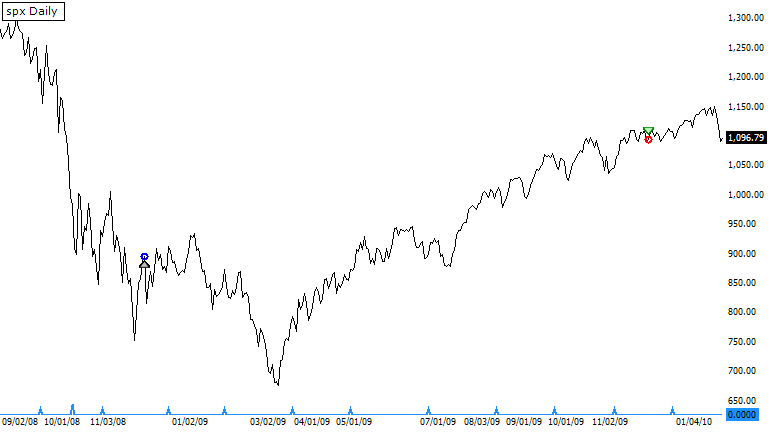
5 Up
The S&P 500 is on track for its 5th straight gain of more than 0.5% off a 50-day low. Remarkably, this has happened only twice before since 1928, on July 3, 1962, and November 28, 2008, both of which gained more than 22% over the next year...with some volatility.