Monday Color - Tiny Range, Options Traders, A Split S&P, Empire Fail

Here's what's piquing my interest on what's likely to be several waiting-for-the-Fed days.
No Commitment
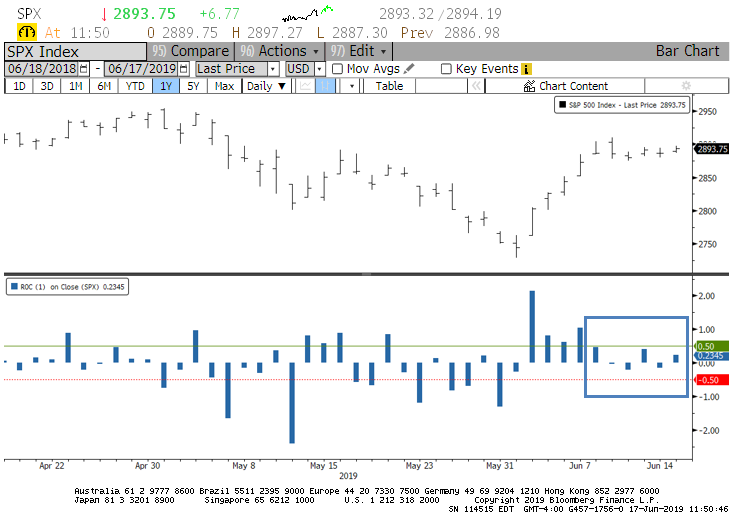
The WSJ notes that stocks have been stuck for the past week. The S&P 500 hasn't had a daily up or down move of more than 0.5% for what would be the 6th straight day, if today's meandering action continues. With the FOMC meeting looming mid-week, this seems probable.
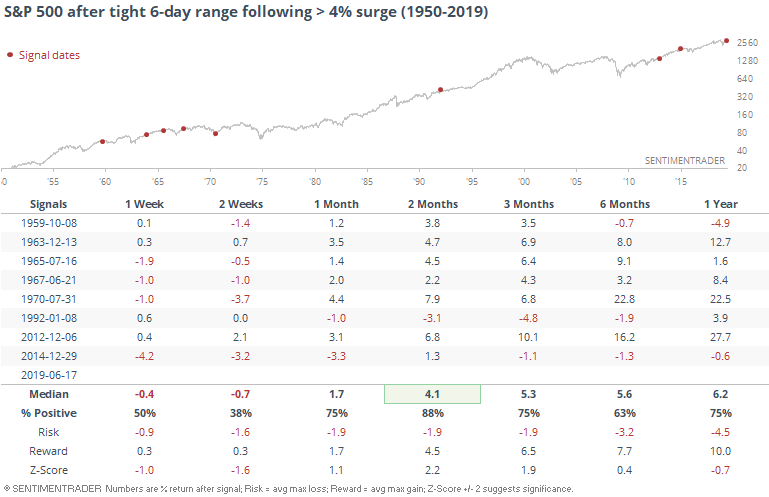
The decision and statement from the Fed is going to make all the difference, so historical price patterns may be little, if any, use here. But I thought it worth at least mentioning that when we've seen a tight range for more than a week following at least a 4% swift rally, there has been some short-term weakness, but it was a good longer-term sign, with a single loss over the next two months.
Small Traders
The smallest of options traders became extremely concerned during the May decline, as we saw in a few prior reports and notes. They're still recovery from that, and the amount they're paying in put premiums has come down significantly from the end of May and early June. Still, the extreme that triggered then is still essentially in effect.
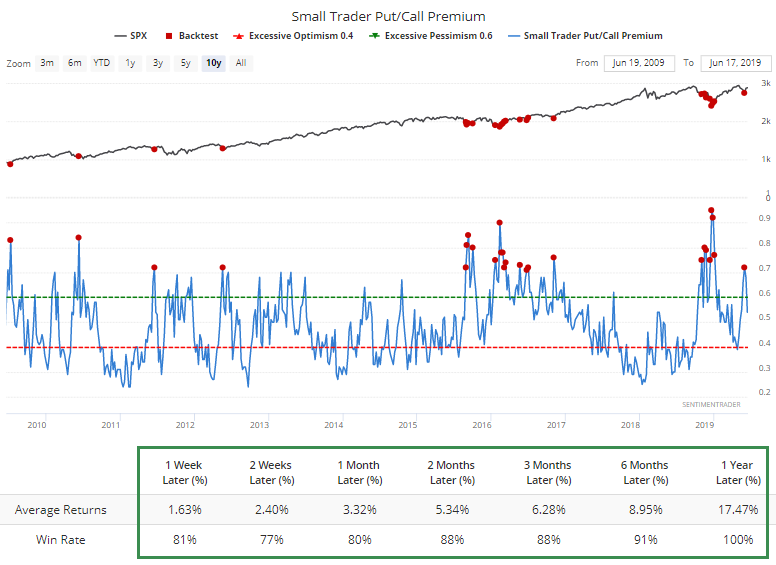
Last week, they became confident enough in the rally to reduce their put buying (in blue) and increase call buying (in red).
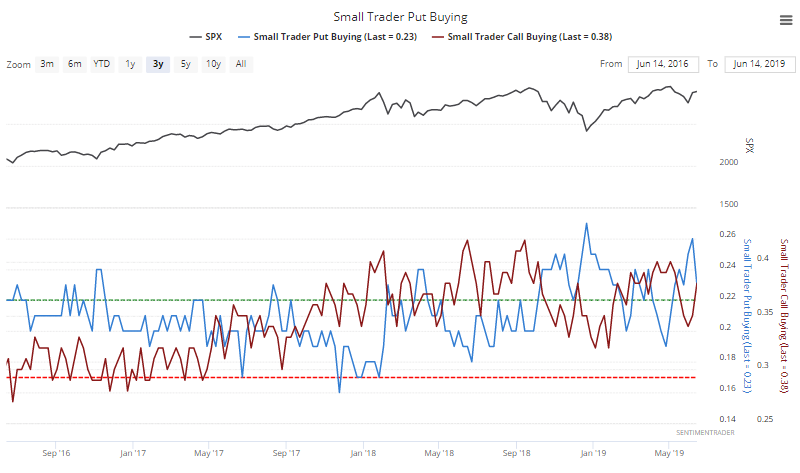
Neither one is particularly extreme at this point. The extreme in put buying from a week ago is the most compelling piece, as we saw that it has invariably led to higher returns.
Corrections
More than 40% of stocks within the S&P remain more than 10% below their 52-week highs, somewhat surprising given the recent surge among members.
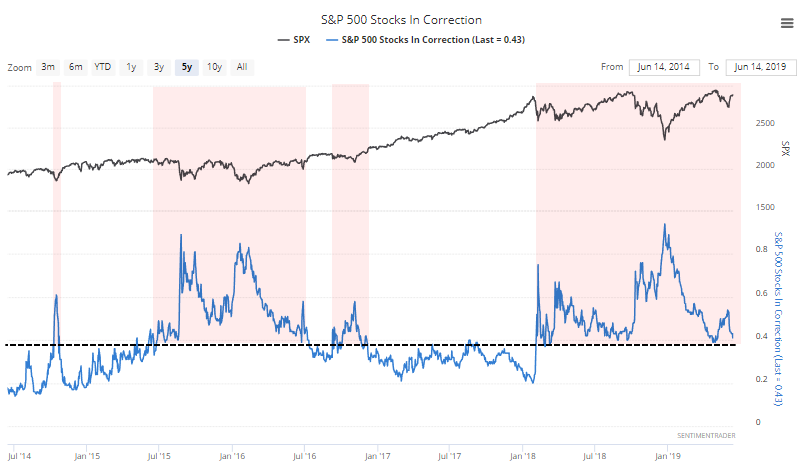
The healthiest market environments have tended to see fewer than 40% of members mired in correction territory, so this is a bit of a worry.
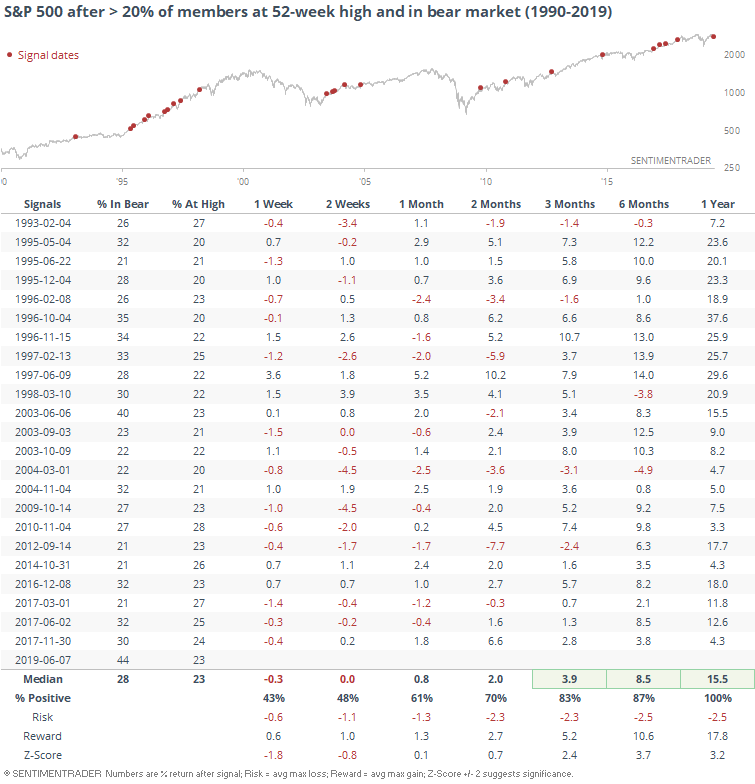
Same with the percentage of stocks still more than 20% from their peaks. Prior "blast off" stages of recent rallies have triggered when this figure falls and holds below 20%.
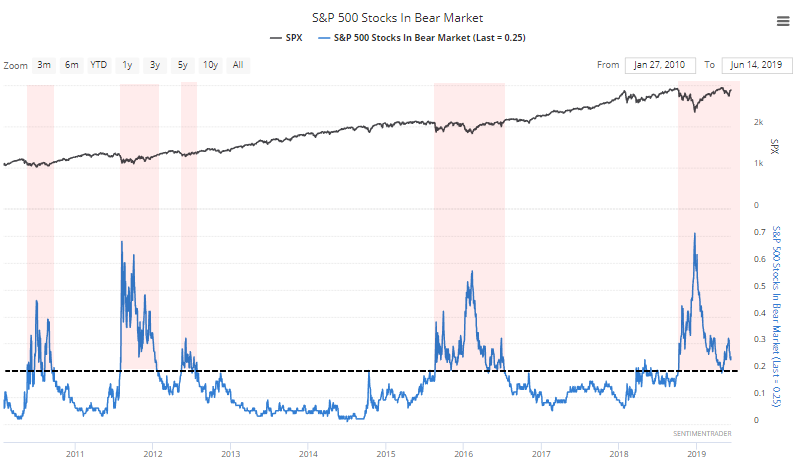
This is weird. We already know there has been a surge in S&P 500 members at a 52-week high, even if many of those were in defensive sectors. Over the past 25 years, there hasn't been another time when the S&P was so split between winners and losers.
There hasn't been another date when more than 20% of its members were at a 52-week high AND more than 40% were in a bear market at the same time. June 2003 came the closest, and that worked out fine. Most of the lesser extremes did, too, so it doesn't look like a worry.
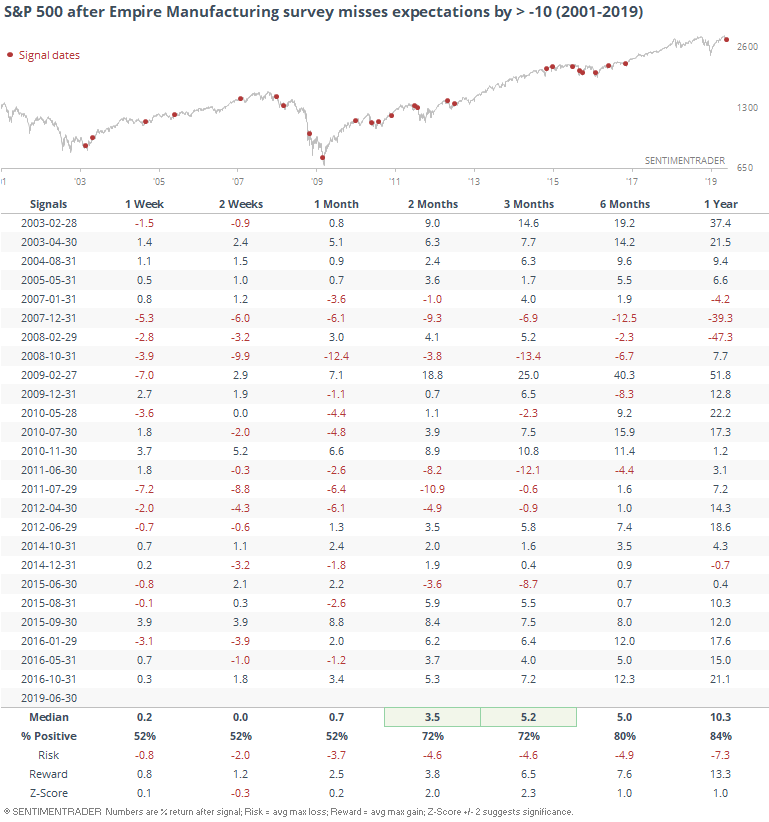
Manufacturing Pessimism
This morning's economic calendar was dominated by a plunge in the NY Fed's survey of manufacturing conditions. It dropped to the lowest level in several years. The survey only goes back to 2001, but weak readings have coincided with the last two recessions (and some false positives).
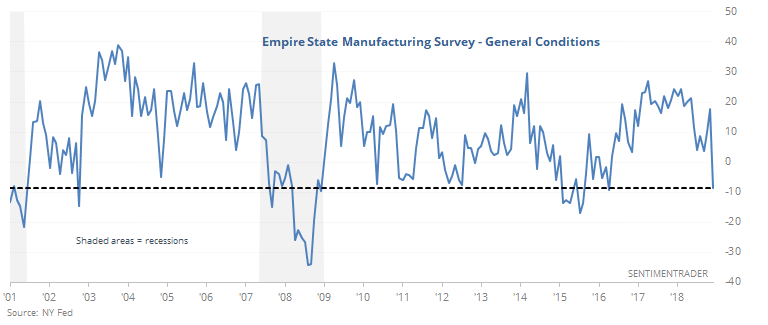
Does it matter to future returns? It was mixed - the weak readings in 2001 and 2008 were damning, of course, but there were also months when it was more like fear and less like prescience.
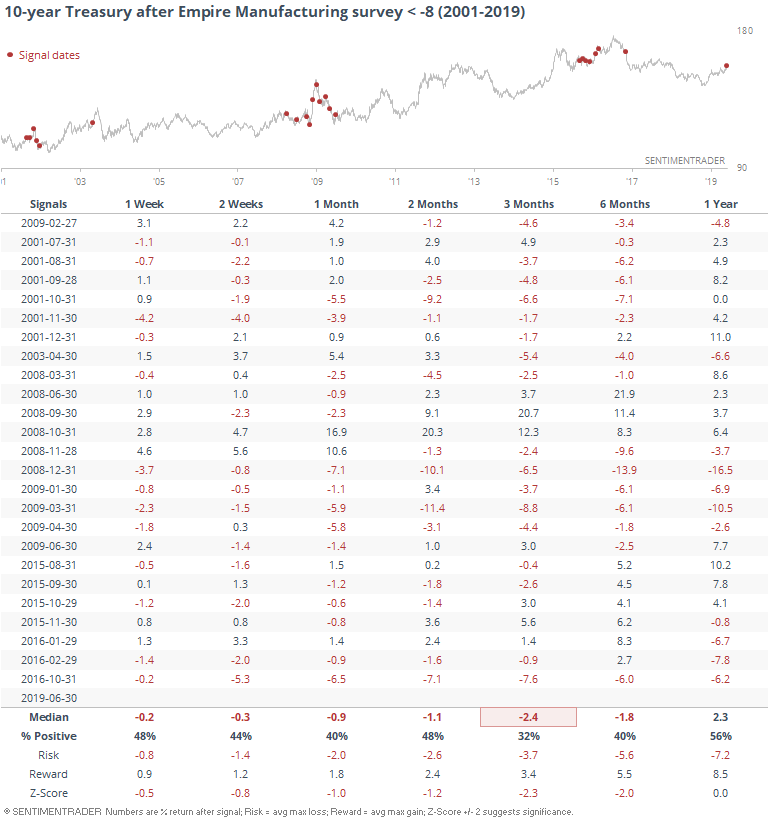
It wasn't necessarily a good reason to buy bonds.
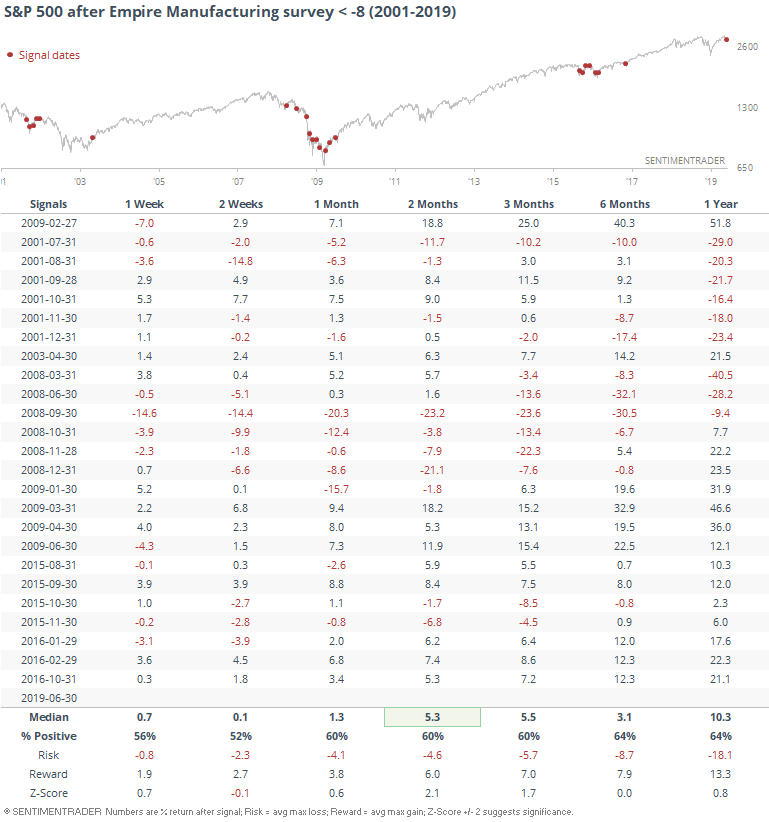
It's getting quite a bit of attention because although it's a tertiary indicator at best, it was extremely weak relative to economists' expectations. It was the 3rd-largest miss on record.
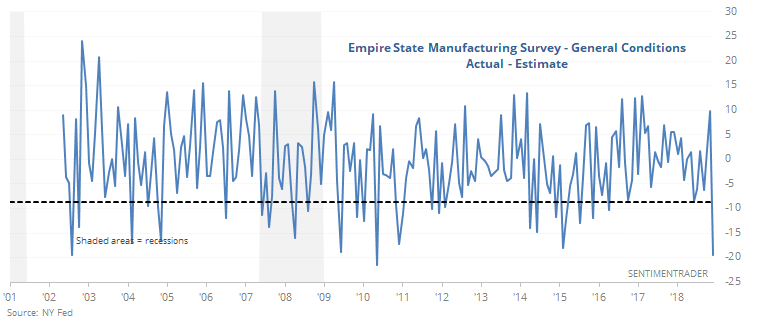
Again, this was not a consistent reason to worry. When the survey's actual results were at least 10 points weaker than economists' had guessed, the S&P did quite well in the months ahead.
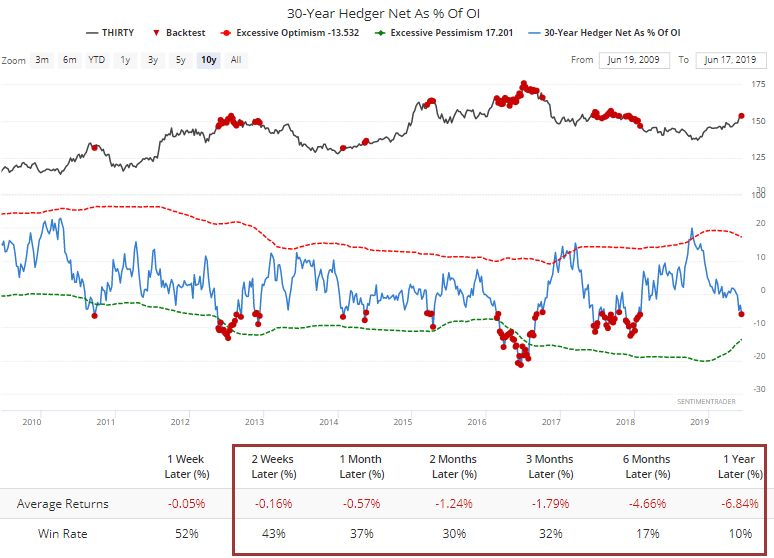
Bond Sellers
Among signs of increasing - and increasingly extreme - optimism on bonds, speculators have been aggressively buying 30-year Treasury bond futures. "Smart money" hedgers take the opposite side of speculators' trades, and are now holding more than 5% of the open interest net short. Bonds have struggled a bit under these conditions.
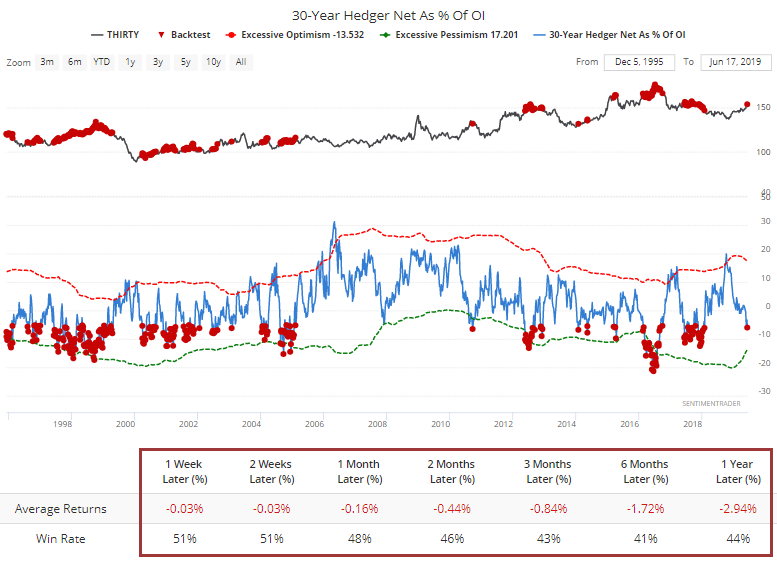
Especially over the past decade.